
A little more downwards movement takes this move into its fifth day. I am swapping the Elliott wave counts over. Yesterday’s alternate is now the main preferred wave count. This is in line with GDX and Silver.
Summary: The bigger picture remains the same, but a second wave correction should complete over the next one to two days. I expect it to move lower to at least 1,172.
Click on charts to enlarge
Main Wave Count
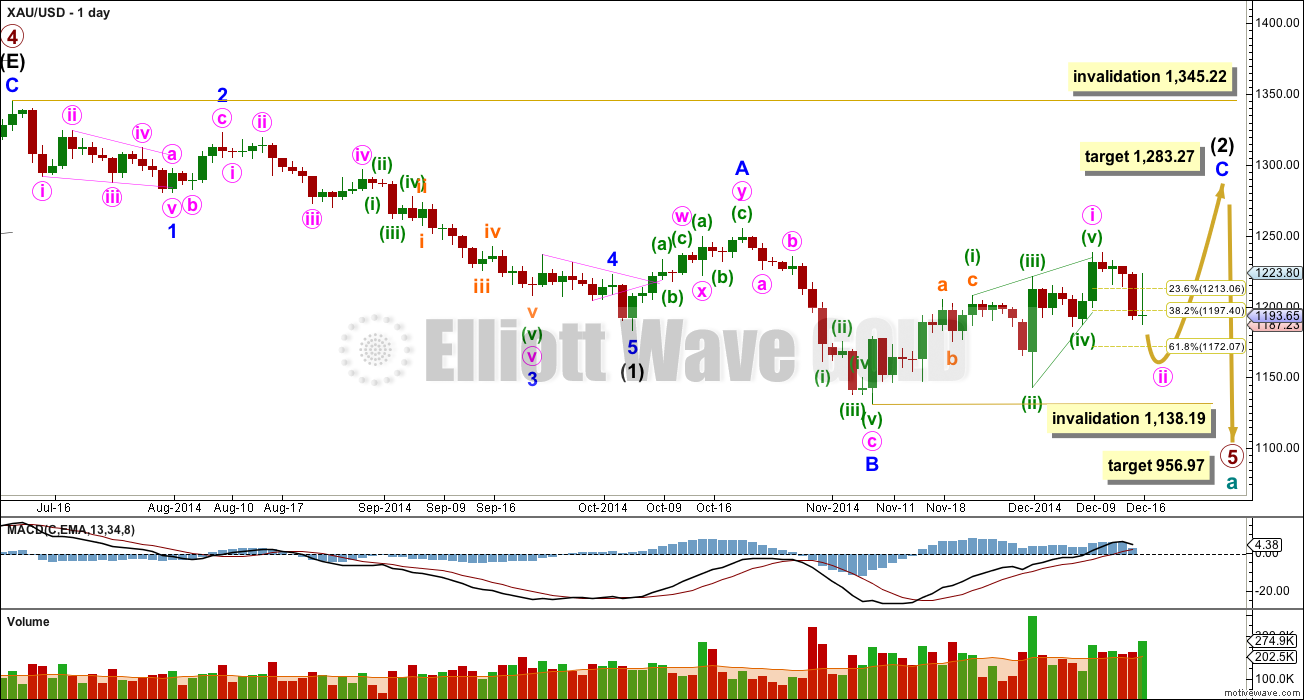
Primary wave 4 is complete and primary wave 5 is unfolding. Primary wave 5 may only subdivide as an impulse or an ending diagonal. So far it looks most likely to be an impulse.
Within primary wave 5 intermediate wave (1) fits perfectly as an impulse. There is perfect alternation within intermediate wave (1): minor wave 2 is a deep zigzag lasting a Fibonacci five days and minor wave 4 is a shallow triangle lasting a Fibonacci eight days, 1.618 the duration of minor wave 2. Minor wave 3 is 9.65 longer than 1.618 the length of minor wave 1, and minor wave 5 is just 0.51 short of 0.618 the length of minor wave 1. I am confident this movement is one complete impulse.
Intermediate wave (2) is an incomplete expanded flat correction. Within it minor wave A is a double zigzag. The downwards wave labelled minor wave B has a corrective count of seven and subdivides perfectly as a zigzag. Minor wave B is a 172% correction of minor wave A. This is longer than the maximum common length for a B wave within a flat correction at 138%, but within the allowable range of twice the length of minor wave A. Minor wave C may not exhibit a Fibonacci ratio to minor wave A, and I think the target for it to end would best be calculated at minute degree. At this stage I would expect intermediate wave (2) to end close to the 0.618 Fibonacci ratio of intermediate wave (1) at 1,283.27.
Intermediate wave (1) lasted a Fibonacci 13 weeks. If intermediate wave (2) exhibits a Fibonacci duration it may be 13 weeks to be even with intermediate wave (1). Intermediate wave (2) is now in its tenth week.
So far within minor wave C the highest volume is on two up days. This supports the idea that at this stage the trend remains up.
See the most recent Historic Analysis to see the long term channel about this whole downwards movement. The channel does not copy over to the daily chart when I put the daily chart on an arithmetic scale, so this channel must be drawn on a weekly chart on a semi log scale. The upper edge of that channel may be where intermediate wave (2) finally ends. I would not expect the upper edge of this channel to be breached.
The target for primary wave 5 at this stage remains the same. At 956.97 it would reach equality in length with primary wave 1. However, if this target is wrong it may be too low. When intermediate waves (1) through to (4) within it are complete I will calculate the target at intermediate degree and if it changes it may move upwards. This is because waves following triangles tend to be more brief and weak than otherwise expected. A perfect example is on this chart: minor wave 5 to end intermediate wave (1) was particularly short and brief after the triangle of minor wave 4.
Within minor wave C minute wave i subdivides perfectly as a leading contracting diagonal. When leading diagonals unfold in first wave positions they are normally followed by very deep second wave corrections. There is a nice example here on the daily chart: at the top left of the chart minor wave 1 was a leading contracting diagonal and it was followed by a deep 65% zigzag for minor wave 2. I will expect minute wave ii to be deep, at least to the 0.618 Fibonacci ratio at 1,172. When it is over then a third wave up should begin.
Minute wave ii may not move beyond the start of minute wave i below 1,138.19.
Intermediate wave (2) may not move beyond the start of intermediate wave (1) above 1,345.22. I have confidence this price point will not be passed because the structure of primary wave 5 is incomplete because downwards movement from the end of the triangle of primary wave 4 does not fit well as either a complete impulse nor an ending diagonal.
To see a prior example of an expanded flat correction for Gold on the daily chart, and an explanation of this structure, go here.
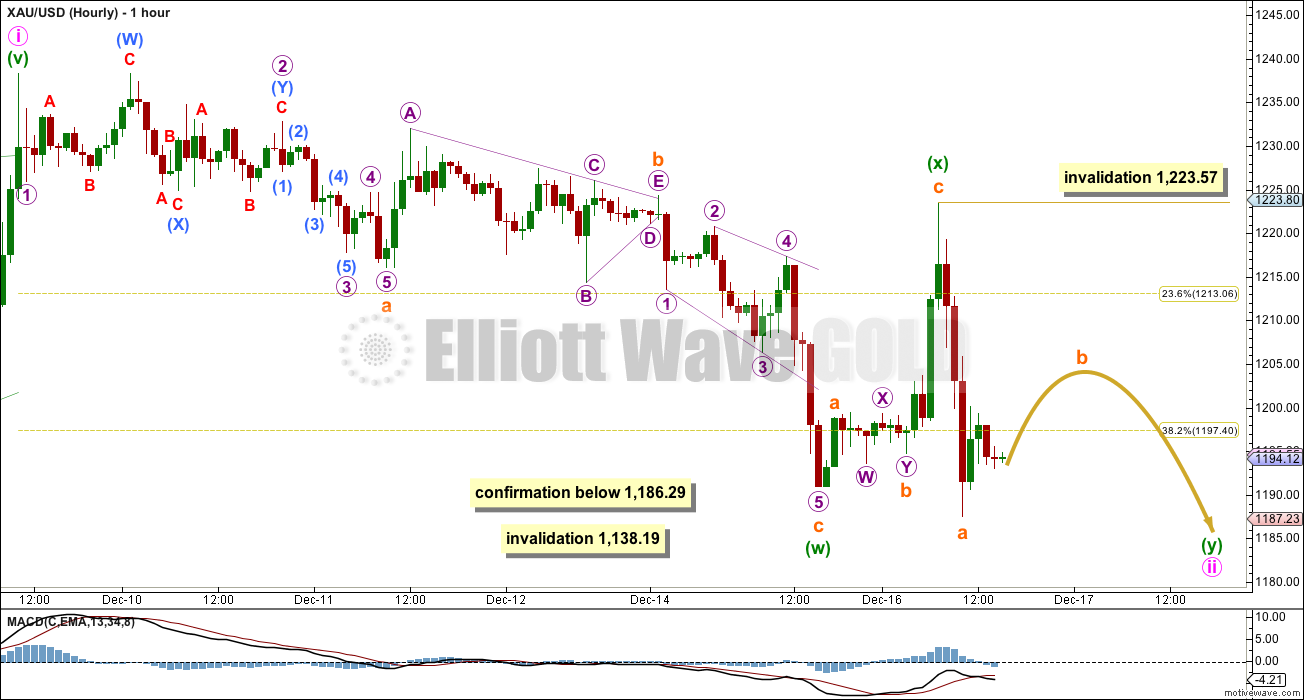
I would expect minute wave ii to be deep, and so I expect it is not over. I would not want to label this as complete at the low of 1,187. That would be far too shallow for a second wave correction following a first wave leading diagonal.
Minute wave ii so far looks like it may be unfolding as a double zigzag. However, there are more than several structures it could complete as. Over the next one or two days the wave count at the hourly chart level may change as more of this correction unfolds and the structure becomes clearer.
Within the first zigzag subminuette wave a subdivides okay as an impulse; the only problem here is the disproportion between micro waves 2 and 4. However, all subdivisions fit.
Within subminuette wave a micro wave B fits well as a running contracting triangle, and this is supported by MACD sitting right at the zero line while it unfolds. I am confident there is a triangle in this position. It is for this reason that I see minuette wave (w) as a zigzag.
Within subminuette wave c it fits best as an ending expanding diagonal. I have checked on the five minute chart to see if micro waves 1, 3 and 5 fit as zigzags, and this is how they look best. Although the trend lines of this structure look odd, the wave lengths are all expanding and all the sub waves subdivide as zigzags as they should within an ending diagonal. Within diagonals the fourth wave should overlap back into first wave price territory.
Subminuette wave c is 2.72 short of 1.618 the length of subminuette wave a.
If this analysis to this point is correct, then minute wave ii is most likely to be a double zigzag and not a double combination. Their purposes are quite different: double combinations exist to take up time and move price sideways, while double zigzags exist to deepen a correction. Considering the expected depth of minute wave ii a double zigzag would fit the purpose. I expect minuette wave (y) to move price lower.
If minuette wave (y) is a zigzag then within it subminuette wave b may not move beyond the start of subminuette wave a above 1,223.57. Subminuette wave a subdivides perfectly as a five wave impulse on the five minute chart.
I do not think that subminuette wave b is over at this point. It should move price sideways and / or higher. Because I do not know where subminuette wave b has ended I cannot use the ratio between subminuette waves a and c to calculate a target for the zigzag of minuette wave (y) to end for you. I should be able to do that tomorrow. The most likely length for subminuette wave c will be equality with subminuette wave a at 36.
Minute wave ii may not move beyond the start of minute wave i below 1,138.19.
At any time any movement at all below 1,186.29 would invalidate the alternate wave count below and so provide confidence in this main wave count.
Alternate Wave Count
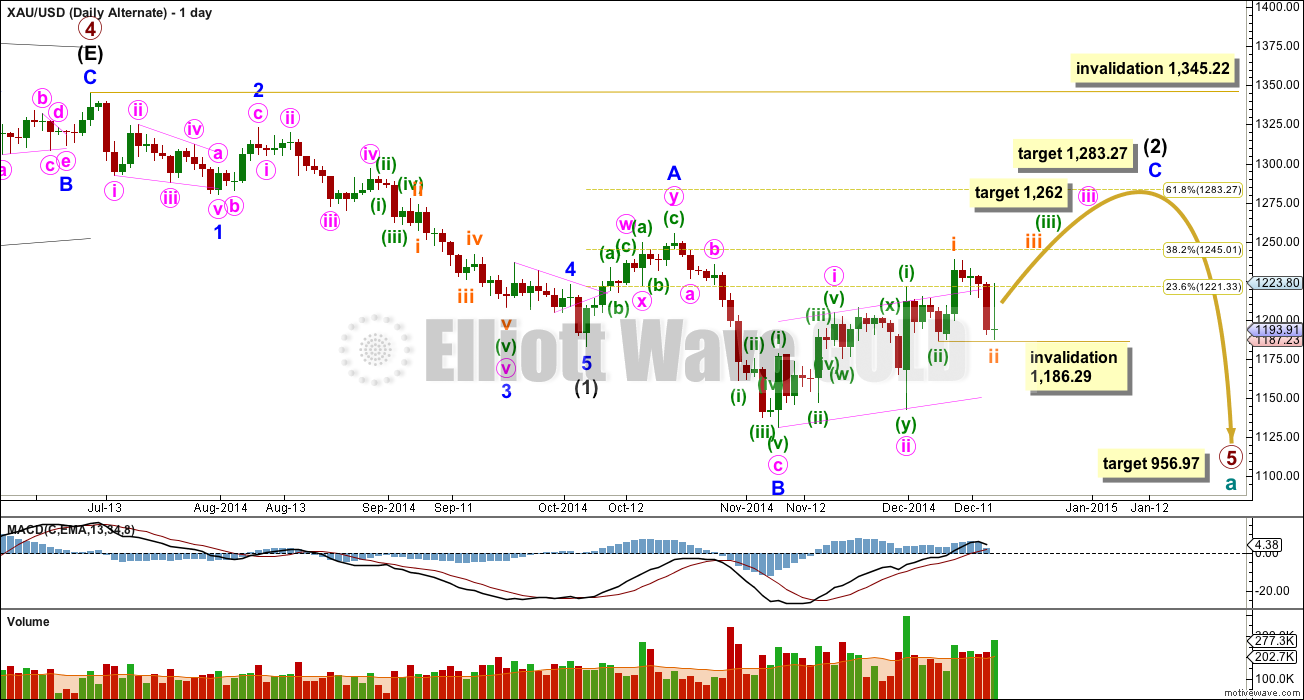
I almost do not want to publish this wave count today, because it has the “wrong” look. I consider it to now be extremely unlikely. I am concerned that publishing it gives it too much weight.
If minor wave C is within the middle of a third wave of a third wave of a third wave, then this current second wave correction should be brief and shallow. It is neither. This second wave correction has now lasted one day longer than the second wave correction one degree higher: minuette wave (ii) lasted four days and the current correction for subminuette wave ii is extremely deep and has lasted now five days. This gives this structure a strange look, and does not look like the middle of a third wave anymore.
Subminuette wave ii may not move beyond the start of subminuette wave i below 1,186.29. While price remains above this point this wave count will remain technically possible, but still unlikely.
Second Alternate Wave Count
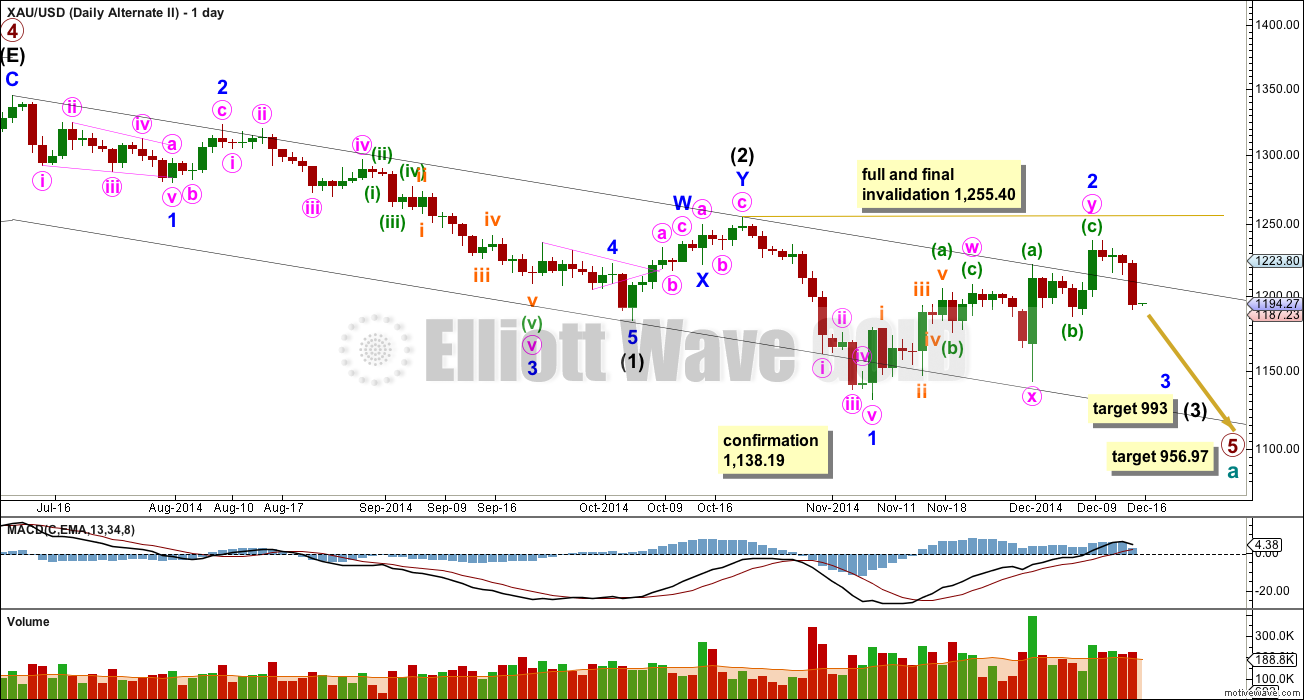
I have published this wave count before, and will publish it again today in response to a member’s query. I consider it to have an extremely low probability.
Of all the markets I have analysed daily over the last six or so years it is Gold which exhibits the most typical looking Elliott wave structures, probably because of the huge volume of this truly global market. It is often so typical it looks like a textbook perfect case. I have learned to give a lot of weight to the “right look” for this particular market, and to consider alternates and change my wave count earlier rather than later if a wave count changes from the right look.
For this wave count intermediate wave (2) looks to be too brief and too shallow. It lasted only 11 days and is only 45% of intermediate wave (1). That is the first indication this wave count may be wrong.
Minor wave 1 does not subdivide clearly as a five wave impulse, and looks better as a three on the daily chart.
Now minor wave 2 within a larger degree third wave of intermediate wave (3) is very deep and lasted longer than intermediate wave (2) one degree higher. It is 86% of minor wave 1 and has lasted twice the duration of intermediate wave (2) at 22 days.
The black channel is a base channel about intermediate waves (1) and (2). A lower degree second wave correction should not breach a base channel drawn about a first and second wave one or more degrees higher. Minor wave 2 clearly and strongly breaches this channel. This further reduces the probability of this wave count.
I will probably not publish this wave count again. Publishing it gives it too much weight.
This analysis is published about 4:05 p.m. EST.
3:15 pm EST WED Elliott Wave Gold Mod papudi • 2 hours ago
The main count is confirmed. It should keep going lower now for another day to two days.
Gold hit 1183.79 at 3:02 pm now main wave count is confirmed below 1186.29 confirmation point again.
At any time any movement at all below 1,186.29
would invalidate the alternate wave count below and also be the confirmation
point for this main wave count. I expect it to move lower to at least 1,172. Quite likely quite a bit deeper than that. It could get really close to but not below the invalidation point of 1,138.19.
Since 2 pm FOMC kitco says hit low 1184.80 TOS says low 1185.8 pmbull says low 186.41 Needed to go below 1186.29
Lara Today after FOMC minutes gold was volatile as expected. It made low of 1186.41 but did not violate the 1186.29 invalidation of one of your previous count. Since it is trading above 1198.
Can you provide your brief comment on this?
If the count changes back to earlier gold will be in impulse move will it?
Or do you think that god will have deep correction before this wave ii is complete?
Will appreciate before 3PM est.
1186.29 breached
The main count is confirmed. It should keep going lower now for another day to two days.
$1,167 may be bottom? If 1203 overnight high stays then gold low may be about$1,167 as Lara’s estimate of drop of about$36 in length.
Very fast news. I use this when FOMC news release time. Some are just headlines. A few have story details.
http://www.marketwatch.com/newsviewer
Wait begins for FOMC Minutes!!! Gold up or down???? Volatility for certain.
Lara, may you be filled with perfect health, balance, energy and strength in every way now!
Richard
Here is the charts I have been following. Lara is exceptionally talented in EW and this one Lara of Charts.
I tend to match both EW and Charts in agreement. That is the best mix.
http://www.kitco.com/ind/Tablish/2014-12-16-Precious-Metals-Stocks-Are-We-There-Yet.html
Good trading
papudi
I have read many of RAMBUS articles and yes he has very good articles and excellent charts and is acurate.
Lara wish you the best and get well soon!!!
Thank you very much. I’m actually quite sick today, and the analysis will be a little later. I’m sorry for that, but I really need to see a doctor.
I should be all good again in a couple of days.
And the worst thing? We have waves today. And I can’t surf!!