
A new low below 1,187.25 has invalidated the first alternate and confirmed the main Elliott wave count. I will not again publish the second alternate wave count because its probability is too low.
Summary: Downwards movement should continue to 1,167. If it completes in two days time it may last a total Fibonacci eight days.
Click on charts to enlarge
Main Wave Count
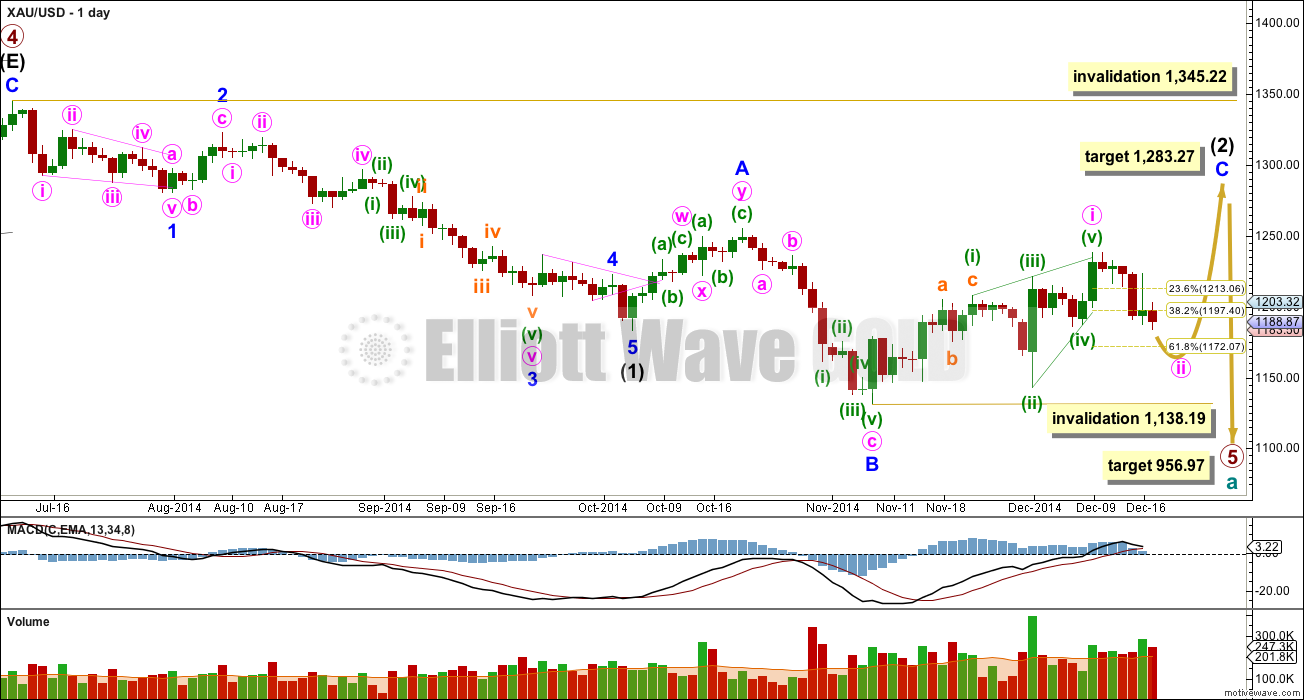
Primary wave 4 is complete and primary wave 5 is unfolding. Primary wave 5 may only subdivide as an impulse or an ending diagonal. So far it looks most likely to be an impulse.
Within primary wave 5 intermediate wave (1) fits perfectly as an impulse. There is perfect alternation within intermediate wave (1): minor wave 2 is a deep zigzag lasting a Fibonacci five days and minor wave 4 is a shallow triangle lasting a Fibonacci eight days, 1.618 the duration of minor wave 2. Minor wave 3 is 9.65 longer than 1.618 the length of minor wave 1, and minor wave 5 is just 0.51 short of 0.618 the length of minor wave 1. I am confident this movement is one complete impulse.
Intermediate wave (2) is an incomplete expanded flat correction. Within it minor wave A is a double zigzag. The downwards wave labelled minor wave B has a corrective count of seven and subdivides perfectly as a zigzag. Minor wave B is a 172% correction of minor wave A. This is longer than the maximum common length for a B wave within a flat correction at 138%, but within the allowable range of twice the length of minor wave A. Minor wave C may not exhibit a Fibonacci ratio to minor wave A, and I think the target for it to end would best be calculated at minute degree. At this stage I would expect intermediate wave (2) to end close to the 0.618 Fibonacci ratio of intermediate wave (1) at 1,283.27.
Intermediate wave (1) lasted a Fibonacci 13 weeks. If intermediate wave (2) exhibits a Fibonacci duration it may be 13 weeks to be even with intermediate wave (1). Intermediate wave (2) is now in its tenth week.
So far within minor wave C the highest volume is on two up days. This supports the idea that at this stage the trend remains up.
See the most recent Historic Analysis to see the long term channel about this whole downwards movement. The channel does not copy over to the daily chart when I put the daily chart on an arithmetic scale, so this channel must be drawn on a weekly chart on a semi log scale. The upper edge of that channel may be where intermediate wave (2) finally ends. I would not expect the upper edge of this channel to be breached.
The target for primary wave 5 at this stage remains the same. At 956.97 it would reach equality in length with primary wave 1. However, if this target is wrong it may be too low. When intermediate waves (1) through to (4) within it are complete I will calculate the target at intermediate degree and if it changes it may move upwards. This is because waves following triangles tend to be more brief and weak than otherwise expected. A perfect example is on this chart: minor wave 5 to end intermediate wave (1) was particularly short and brief after the triangle of minor wave 4.
Within minor wave C minute wave i subdivides perfectly as a leading contracting diagonal. When leading diagonals unfold in first wave positions they are normally followed by very deep second wave corrections. There is a nice example here on the daily chart: at the top left of the chart minor wave 1 was a leading contracting diagonal and it was followed by a deep 65% zigzag for minor wave 2. I will expect minute wave ii to be deep, at least to the 0.618 Fibonacci ratio at 1,172. When it is over then a third wave up should begin.
I do not think that minor wave C is complete at the high of 1,238 as an ending contracting diagonal for three reasons:
1. Intermediate wave (2) would be a very rare running flat correction.
2. Minor wave C would be substantially truncated, by $17.
3. This structure does not subdivide well as an ending diagonal because the third and fifth waves do not fit well as zigzags. Within an ending diagonal all the sub waves must be zigzags.
Minute wave ii may not move beyond the start of minute wave i below 1,138.19.
Intermediate wave (2) may not move beyond the start of intermediate wave (1) above 1,345.22. I have confidence this price point will not be passed because the structure of primary wave 5 is incomplete because downwards movement from the end of the triangle of primary wave 4 does not fit well as either a complete impulse nor an ending diagonal.
To see a prior example of an expanded flat correction for Gold on the daily chart, and an explanation of this structure, go here.
I do not want to publish a wave count which sees primary wave 5 complete at the low of 1,131. This downwards movement does not fit well at all as a complete five wave impulse. There would be inadequate alternation between the single zigzag of the second wave and the double zigzag of the fourth wave correction, and there would be no Fibonacci ratios between the first, third and fifth waves within it.
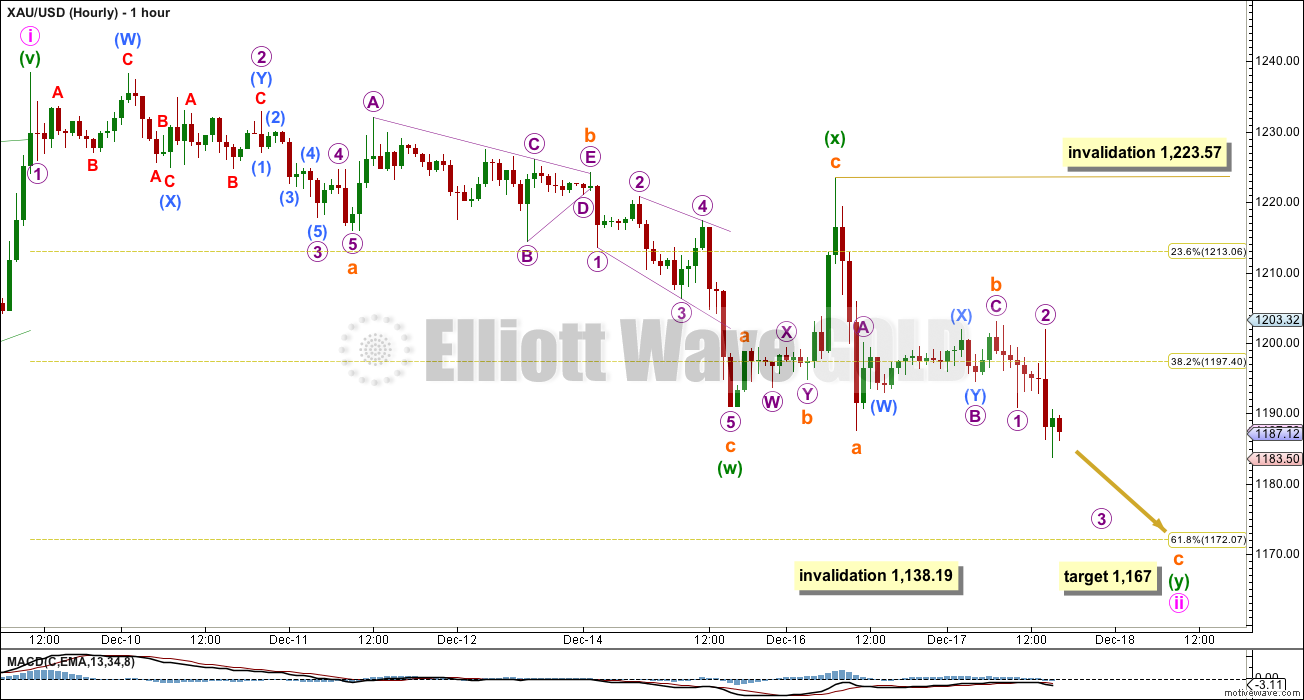
Minute wave ii is an incomplete double zigzag, most likely. The first zigzag in the double is labelled minuette wave (w). The double is joined by a three in the opposite direction, a zigzag labelled minuette wave (x). The second zigzag in the double labelled minuette wave (y) is incomplete.
Within minuette wave (y) at 1,167 subminuette wave c would reach equality in length with subminuette wave a. This target takes minute wave ii just below the 0.618 Fibonacci ratio of minute wave i, making minute wave ii a very deep correction. Second wave corrections following leading diagonals in first wave positions are normally very deep.
Depending on how long subminuette wave c lasts this correction could end in one more day, or it may take up to three more days. If it continues for two more days it may complete in a total Fibonacci eight days. That will be my expectation because Gold’s waves often exhibit Fibonacci durations (but not always).
Minute wave ii may not move below the start of minute wave i at 1,138.19.
This analysis is published about 5:50 p.m. EST.
The way I see it wave 4 completed at 1213 and wave 1 of completed at 1198. Wave 2 is unfolding. then wave 3 will follow?????
Is above scenario correct???? Any one
I have subminuette wave b ending at the recent high of 1,213.
It moved higher.
So this is now where subminuette wave c begins.
This is why I left the invalidation point up at the start of minuette wave (y); to allow for the possibility that subminuette wave b could continue sideways / higher.
So now my target is for subminuette wave c to = 1.618 X subminuette wave a = 58 length = 1,156
Any chance that gold could move back to the 1213-1223 zone before dropping to 1156? Thanks.
Yes, it’s possible. But unlikely.
This is the risk you must accept.
If wave 1 went from 1214 to 1192 are we looking at a wave 2 retracement to 1204/06?
yes GDX is really on a charge and once GLD takes off it will be a crushing wave III
Those miners just keep loading up…
GLD looks like its about to launch up into wave III
Question is, is it III of C of 2 or did wave 5 end at 1138 and this is a full blown wave 3?
Hey Lara, what do you think of this idea?
Jaf
Can you spot a consistent wave counts count in this wave 5 down?
While the structure of that expanded flat actually looks pretty good, when I put it into the bigger picture one and two degrees higher it does not look so good. You would be seeing this as minuette wave (ii) following minute wave ii; minute wave ii would have lasted 9 days and was very deep, now minuette wave (ii) would be ending its 13th day and also be expected to be rather deep. Because the lower degree second wave is so much longer in duration than the second wave one degree higher it does not have the right look.
But, it’s technically possible. Your subdivisions are all correct.
b finished at $1213ish – now starting 5 down – new target is $1156 which is 78.6% retrace
I agree. You just confirmed what i am thinking.
If this is micro wave 5 it is an impulse wave????
Gold broke out in hour chart. AND is not backing from high.
Almost 30$ bounce of the low… Can this be the start of the 3rd wave?
Gold may be playing out hourly wave count of Dec 16. confirmation was below 1286 Wave ii was to be complete.
Has any thing changed since that day?
well i guess she expected this rise by keeping 1223 invalidation….just seems more agressive then I expected!
Not expected, but saw as entirely possible.
B waves are horrible. They have the greatest variety in form and structure. I have learned the hard way to allow them room to move.
all this with USD near 52 wk high…which should be headwind for gold.
Gold keeps going back to 1215. Hope that resistance will hold???
The bounce tonight is just fibonacci retracements, 3 steps down 2 steps up, which have been happening since December 9th, when this wave began Intermediate wave (2). Target down and ahead this week $1,167.
The current bounce is micro wave 4 (purple). Should not cross 1201.83 the micro wave 2 high. If gold heads down here than it will have completed micro wave 4 and will head to final low for wave c completion.
If breaches 1201.83 I do not know wave count on hour needs to be revised.
Am I correct???????
Lara has labeled micro wave 3 below. I guess she was waiting gold to continue and finish micro wave 3 and then go up for micro wave 4 ??????
Lara
Stay well and be well in optimum, overall complete perfect health and strength, with a vibrant youthful immune system operating at 100% now.
I’m working on it! Should be better… tomorrow.
not liking this bounce!
Any one can help??
Target for subminuette wave iii was noted in Dec 12th:
At 1,247 subminuette wave iii would reach 0.618 (33) the length of subminuette wave i.
Is this wave structure changed from 3rd of 3rd of 3rd to just wave iii?
Thanks Lara.
So far so good. Once gold goes below 1170 by Friday what should be the trading plan in NY market.?
By the time NYSE opens Monday gold could be way up. Just thinking.
Friday’s action will dictate the action!!!!! However Fridays close have some small bite on long side???
How long the impulse wave iii will last? ????
What is the target of this wave iii?
papudi
The lower target is at 1,167 to end minuette wave (y) subminuette wave c
Thanks Lara…hope you feel better soon…
Thank you. I’m a bit better today. Its not stopping me from working, its really only stopping me from eating and surfing 🙁