
Christmas Eve was quiet, as expected, with a small red candlestick. Price remains above the invalidation point on the main hourly Elliott wave chart, which has increased in probability.
Summary: It is most likely a third wave up has just begun. First confirmation will come with a clear breach of the orange channel on the hourly chart. Thereafter, price confirmation would come with a new high above 1,198.24. The target is at 1,278. I would judge this main wave count to have about a 90% probability. Alternatively, a new low below 1,170.83 would indicate downwards movement may continue further to a target at 1,140, but not below 1,131.09.
Click on charts to enlarge
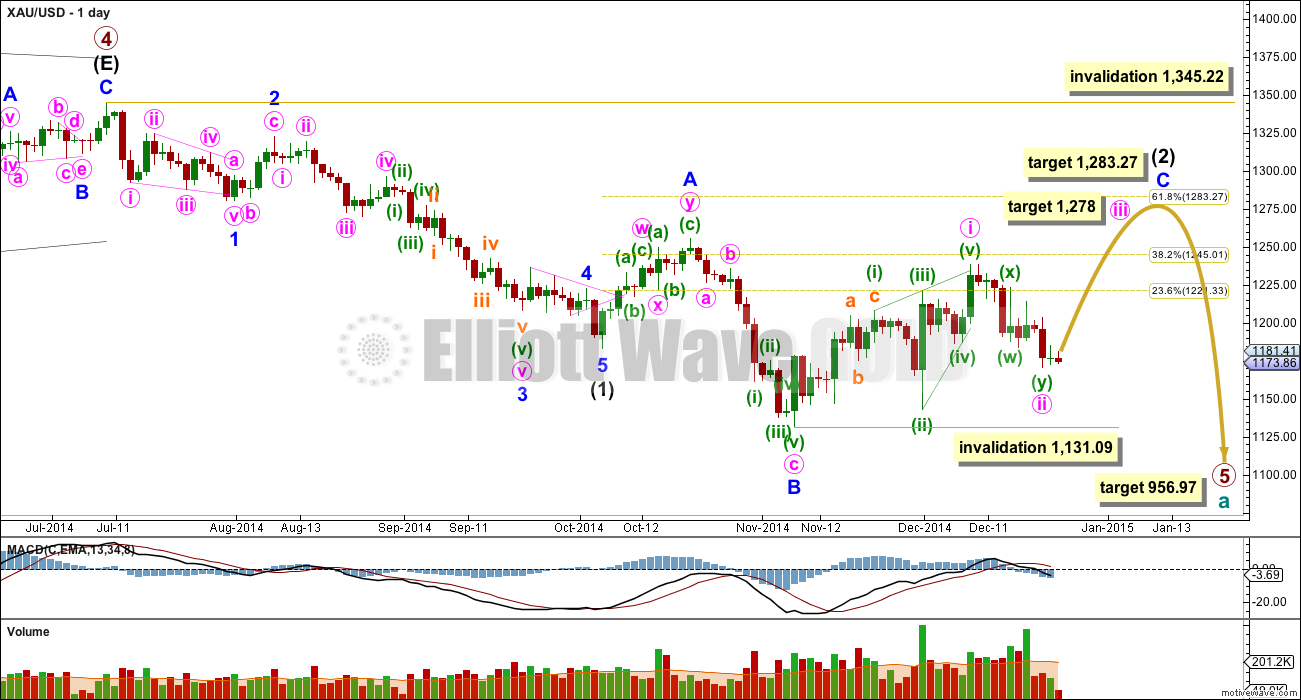
Primary wave 4 is complete and primary wave 5 is unfolding. Primary wave 5 may only subdivide as an impulse or an ending diagonal. So far it looks most likely to be an impulse.
Within primary wave 5 intermediate wave (1) fits perfectly as an impulse. There is perfect alternation within intermediate wave (1): minor wave 2 is a deep zigzag lasting a Fibonacci five days and minor wave 4 is a shallow triangle lasting a Fibonacci eight days, 1.618 the duration of minor wave 2. Minor wave 3 is 9.65 longer than 1.618 the length of minor wave 1, and minor wave 5 is just 0.51 short of 0.618 the length of minor wave 1. I am confident this movement is one complete impulse.
Intermediate wave (2) is an incomplete expanded flat correction. Within it minor wave A is a double zigzag. The downwards wave labelled minor wave B has a corrective count of seven and subdivides perfectly as a zigzag. Minor wave B is a 172% correction of minor wave A. This is longer than the maximum common length for a B wave within a flat correction at 138%, but within the allowable range of twice the length of minor wave A. Minor wave C may not exhibit a Fibonacci ratio to minor wave A, and I think the target for it to end would best be calculated at minute degree. At this stage I would expect intermediate wave (2) to end close to the 0.618 Fibonacci ratio of intermediate wave (1) at 1,283.27.
Intermediate wave (1) lasted a Fibonacci 13 weeks. If intermediate wave (2) exhibits a Fibonacci duration it may be 13 weeks to be even with intermediate wave (1). Intermediate wave (2) is now completing its tenth week, so it may continue now for three more.
So far within minor wave C the highest volume is on three up days. This supports the idea that at this stage the trend remains up.
See the most recent Historic Analysis to see the long term channel about this whole downwards movement. The channel does not copy over to the daily chart when I put the daily chart on an arithmetic scale, so this channel must be drawn on a weekly chart on a semi log scale. The upper edge of that channel may be where intermediate wave (2) finally ends. I would not expect the upper edge of this channel to be breached.
The target for primary wave 5 at this stage remains the same. At 956.97 it would reach equality in length with primary wave 1. At this stage because primary wave 5 is taking its time it may not be a typical short brief fifth wave following a triangle, and so I have a little more confidence in this target.
Within minor wave C minute wave i subdivides perfectly as a leading contracting diagonal. When leading diagonals unfold in first wave positions they are normally followed by very deep second wave corrections. There is a nice example here on the daily chart: at the top left of the chart minor wave 1 was a leading contracting diagonal and it was followed by a deep 65% zigzag for minor wave 2. Minute wave ii is now deep, just below the 0.618 Fibonacci ratio of minute wave i. Minute wave iii has most likely now begun.
I do not think that minor wave C is complete at the high of 1,238 as an ending contracting diagonal for three reasons:
1. Intermediate wave (2) would be a very rare running flat correction.
2. Minor wave C would be substantially truncated, by $17.
3. This structure does not subdivide well as an ending diagonal because the third and fifth waves do not fit well as zigzags. Within an ending diagonal all the sub waves must be zigzags.
Minute wave ii may not move beyond the start of minute wave i below 1,138.09.
Intermediate wave (2) may not move beyond the start of intermediate wave (1) above 1,345.22. I have confidence this price point will not be passed because the structure of primary wave 5 is incomplete because downwards movement from the end of the triangle of primary wave 4 does not fit well as either a complete impulse nor an ending diagonal.
To see a prior example of an expanded flat correction for Gold on the daily chart, and an explanation of this structure, go here.
I do not want to publish a wave count which sees primary wave 5 complete at the low of 1,131.09. This downwards movement does not fit well at all as a complete five wave impulse. There would be inadequate alternation between the single zigzag of the second wave and the double zigzag of the fourth wave correction, and there would be no Fibonacci ratios between the first, third and fifth waves within it.
Main Hourly Wave Count
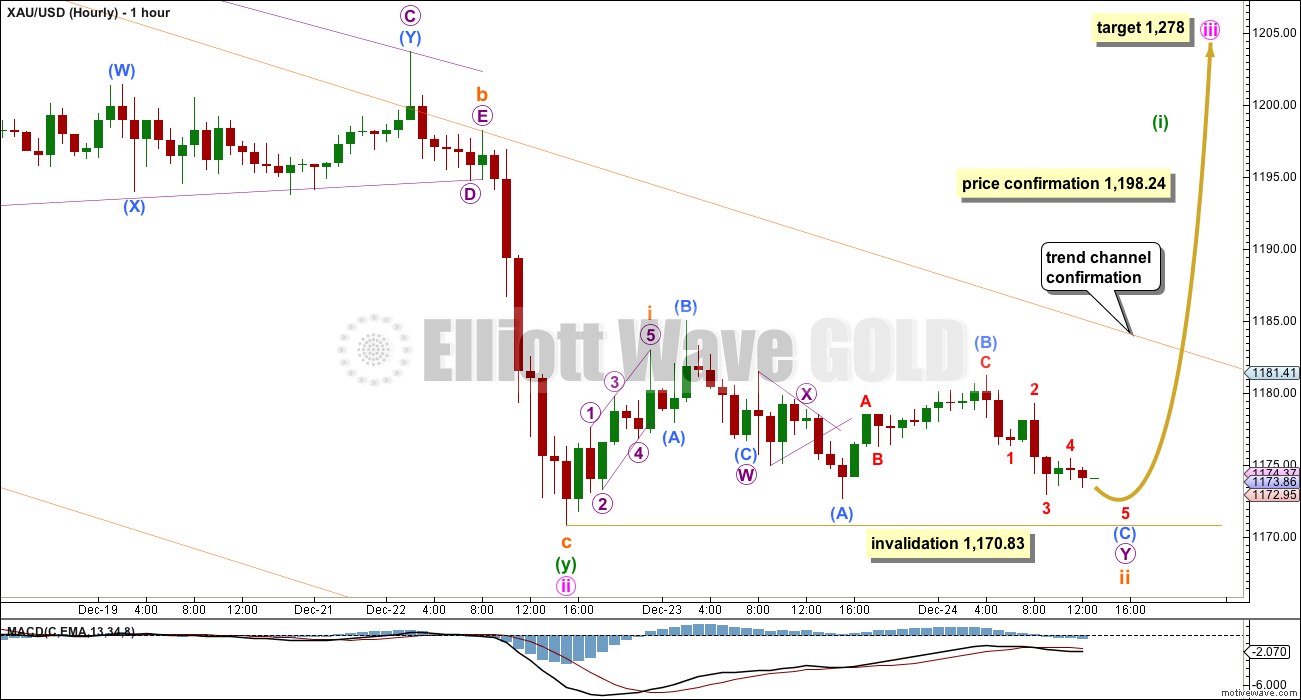
As expected a small second wave correction continued sideways. Subminuette wave ii is unfolding as a double flat correction. The subdivisions fit very well on the five minute chart, much better than for the alternate below. This is why I would judge this main wave count to be more likely, about 90%.
Within the second flat in this double, labelled micro wave Y, sub micro wave (C) is very likely to end at least slightly below the end of sub micro wave (A) at 1,172.68 to avoid a truncation and a very rare running flat. I expect just a little downwards movement to complete today’s session to achieve this.
Thereafter, a third wave up should begin.
This degree of labelling may be correct, but may need to be moved up one degree. The next movement should show an increase in upwards momentum, and if it is stronger than momentum within minute wave i then I will move the degree of labelling within this new upwards wave up one degree. It makes no difference to the target or expected direction at this stage.
At 1,278 minute wave iii would reach equality in length with minute wave i.
Draw a channel about minuette wave (y) as described in yesterday’s analysis. When the upper edge of this channel is clearly breached a trend change would be indicated. A new high above 1,198.24 would provide price confirmation of a trend change. The next movement is a third wave up.
Alternate Hourly Wave Count
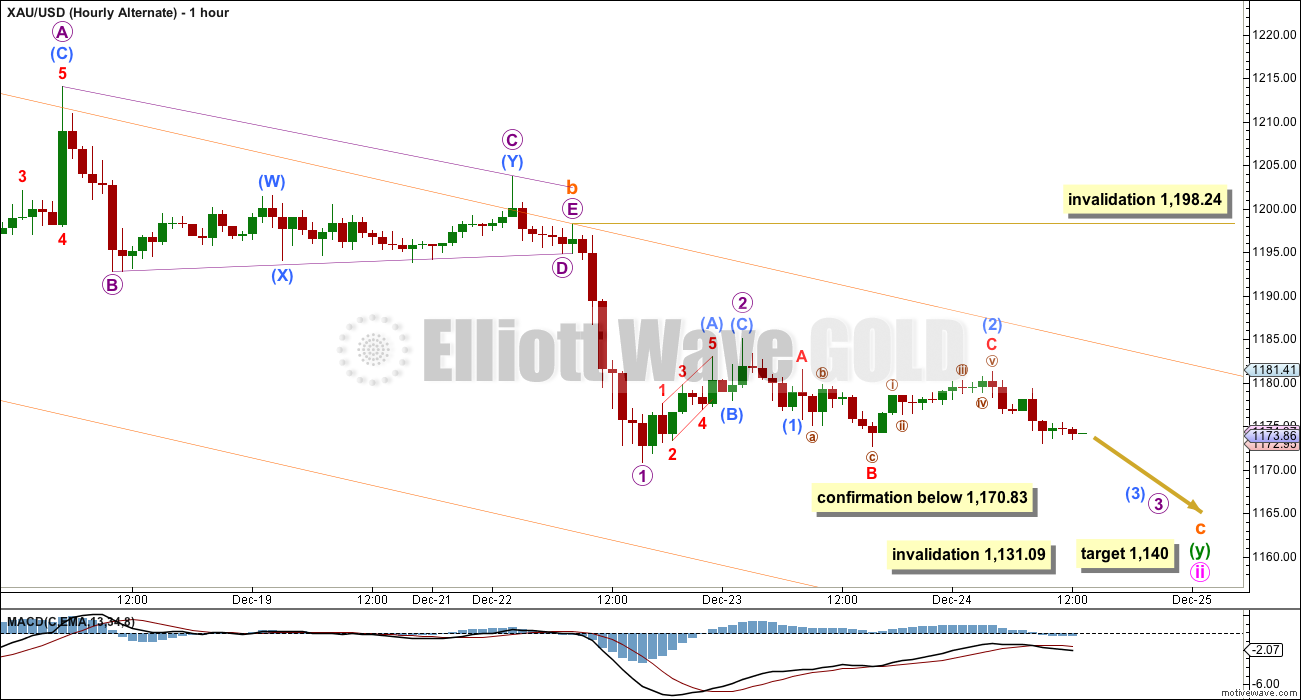
If this wave count is confirmed with a new low below 1,170.83 I would expect two more days overall of downwards movement. That would see minute wave ii last a total Fibonacci 13 sessions and have a 0.618 duration to minute wave i.
At 1,140 subminuette wave c would reach 1.618 the length of subminuette wave a.
Minute wave ii may not move beyond the start of minute wave i below 1,131.09.
On the five minute chart this wave count does not have as good a fit as the main wave count; the small upwards wave of sub micro wave (C) within micro wave 2 looks like a clear three, this wave count must see it as a five, and now minuscule wave C within sub micro wave (2) does not fit well as a five wave structure.
Today this wave count is less convincing. If a third wave down has begun at this low degree I would have expected a new low below 1,170.83 by now. I am providing this wave count mostly as a “what if”. What if I’m wrong? What if downwards movement continues? I think this is very unlikely today.
Micro wave 2 may not move beyond the start of micro wave 1 above 1,198.24. If the orange channel is breached this wave count would decrease substantially in probability before it is invalidated.
This analysis is published about 3:16 p.m. EST.
Gold validated completion of wave ii.
Wave iii has begun.
Assuming wave C target is 1283. AND wave iii target is 1278.
wave iii rise is 1278-1172= 106 from wave ii bottom.
Expect wave iv correction to be deep enough for wave v C target.
Expected wave iv correction 1272- 60 (wave ii)= 1212
Final wave v rise: 1212+ 71= 1283 ( all estimates)
Assuming no change in gold’s wave counts again.
Just thinking !!!!!!
Hi Papudi,
Wave iv cannot move below 1238 (wave i ).
If wave iii will end to 1278 then we will suppose that wave iv will be shallow because wave ii was deep and if it will be 23% of wave iii his target will be 1278-25= 1253. But now it is better to wait the wave iii end.
Thanks clearing.
What is the current sub min wave of wave iii?
Lara hope you had well deserved holiday and are well rested.
“Minor wave C minute wave i subdivided perfectly as a leading contracting diagonal”.
Do you think minute wave iii will also be a leading contracting diagonal or like the one wave A?
Three more weeks are lot of time for ups and down.
Anxious for this wave C to be over!!!
No, third waves may only subdivide as impulses.
So far: spot on, thank you very much. You are far ahead. Wish you some quiet days in spite of the action…..