
Upwards movement was expected. The main Elliott wave count is confirmed, and the alternate Elliott wave count which was judged to have a very low probability was invalidated.
Summary: A third wave up is confirmed. The target for it to end is at 1,278.
Click on charts to enlarge
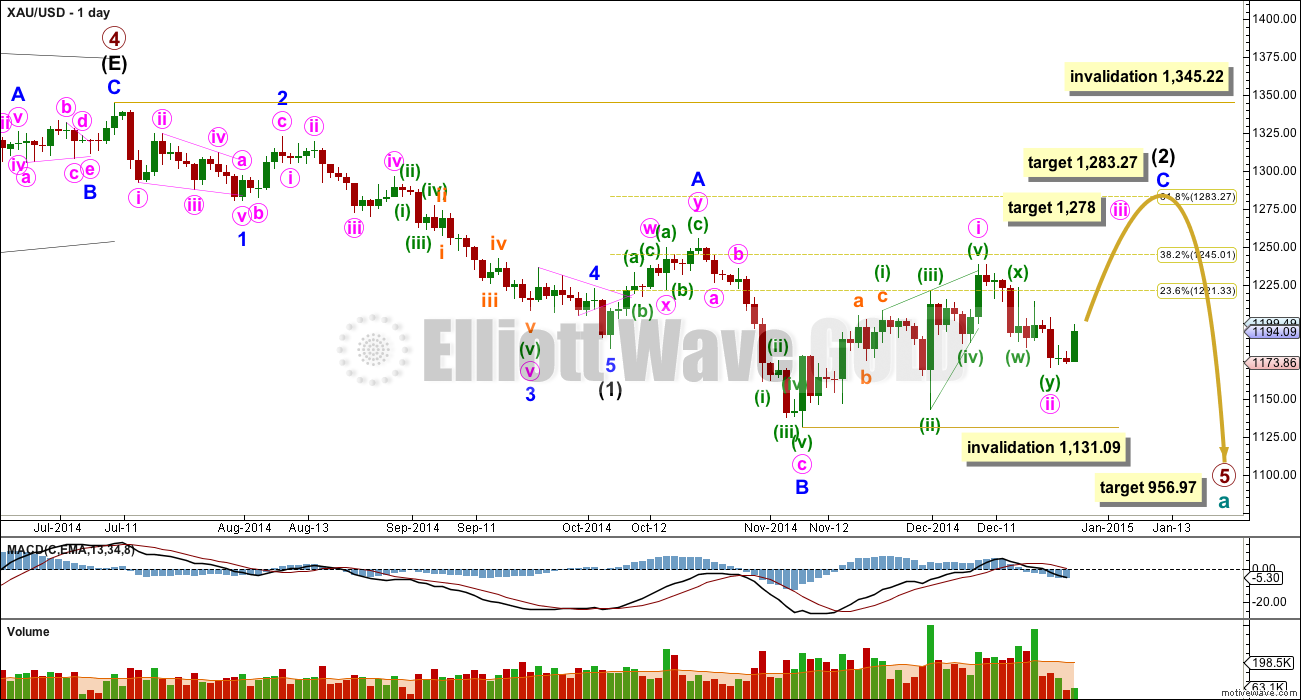
Primary wave 4 is complete and primary wave 5 is unfolding. Primary wave 5 may only subdivide as an impulse or an ending diagonal. So far it looks most likely to be an impulse.
Within primary wave 5 intermediate wave (1) fits perfectly as an impulse. There is perfect alternation within intermediate wave (1): minor wave 2 is a deep zigzag lasting a Fibonacci five days and minor wave 4 is a shallow triangle lasting a Fibonacci eight days, 1.618 the duration of minor wave 2. Minor wave 3 is 9.65 longer than 1.618 the length of minor wave 1, and minor wave 5 is just 0.51 short of 0.618 the length of minor wave 1. I am confident this movement is one complete impulse.
Intermediate wave (2) is an incomplete expanded flat correction. Within it minor wave A is a double zigzag. The downwards wave labelled minor wave B has a corrective count of seven and subdivides perfectly as a zigzag. Minor wave B is a 172% correction of minor wave A. This is longer than the maximum common length for a B wave within a flat correction at 138%, but within the allowable range of twice the length of minor wave A. Minor wave C may not exhibit a Fibonacci ratio to minor wave A, and I think the target for it to end would best be calculated at minute degree. At this stage I would expect intermediate wave (2) to end close to the 0.618 Fibonacci ratio of intermediate wave (1) at 1,283.27.
Intermediate wave (1) lasted a Fibonacci 13 weeks. If intermediate wave (2) exhibits a Fibonacci duration it may be 13 weeks to be even with intermediate wave (1). Intermediate wave (2) is ending its eleventh week. If it continues for two more weeks it may have an even duration with intermediate wave (1). It may be able to do this, but at this stage it is looking like it might need a little longer.
So far within minor wave C the highest volume is on three up days. This supports the idea that at this stage the trend remains up.
See the most recent Historic Analysis to see the long term channel about this whole downwards movement. The channel does not copy over to the daily chart when I put the daily chart on an arithmetic scale, so this channel must be drawn on a weekly chart on a semi log scale. The upper edge of that channel may be where intermediate wave (2) finally ends. I would not expect the upper edge of this channel to be breached.
The target for primary wave 5 at this stage remains the same. At 956.97 it would reach equality in length with primary wave 1. At this stage because primary wave 5 is taking its time it may not be a typical short brief fifth wave following a triangle, and so I have a little more confidence in this target.
Within minor wave C minute wave i subdivides perfectly as a leading contracting diagonal. When leading diagonals unfold in first wave positions they are normally followed by very deep second wave corrections. There is a nice example here on the daily chart: at the top left of the chart minor wave 1 was a leading contracting diagonal and it was followed by a deep 65% zigzag for minor wave 2. Minute wave ii is now deep, just below the 0.618 Fibonacci ratio of minute wave i. Minute wave iii has most likely now begun.
I do not think that minor wave C is complete at the high of 1,238 as an ending contracting diagonal for three reasons:
1. Intermediate wave (2) would be a very rare running flat correction.
2. Minor wave C would be substantially truncated, by $17.
3. This structure does not subdivide well as an ending diagonal because the third and fifth waves do not fit well as zigzags. Within an ending diagonal all the sub waves must be zigzags.
Minute wave ii may not move beyond the start of minute wave i below 1,138.09.
Intermediate wave (2) may not move beyond the start of intermediate wave (1) above 1,345.22. I have confidence this price point will not be passed because the structure of primary wave 5 is incomplete because downwards movement from the end of the triangle of primary wave 4 does not fit well as either a complete impulse nor an ending diagonal.
To see a prior example of an expanded flat correction for Gold on the daily chart, and an explanation of this structure, go here.
I do not want to publish a wave count which sees primary wave 5 complete at the low of 1,131.09. This downwards movement does not fit well at all as a complete five wave impulse. There would be inadequate alternation between the single zigzag of the second wave and the double zigzag of the fourth wave correction, and there would be no Fibonacci ratios between the first, third and fifth waves within it.
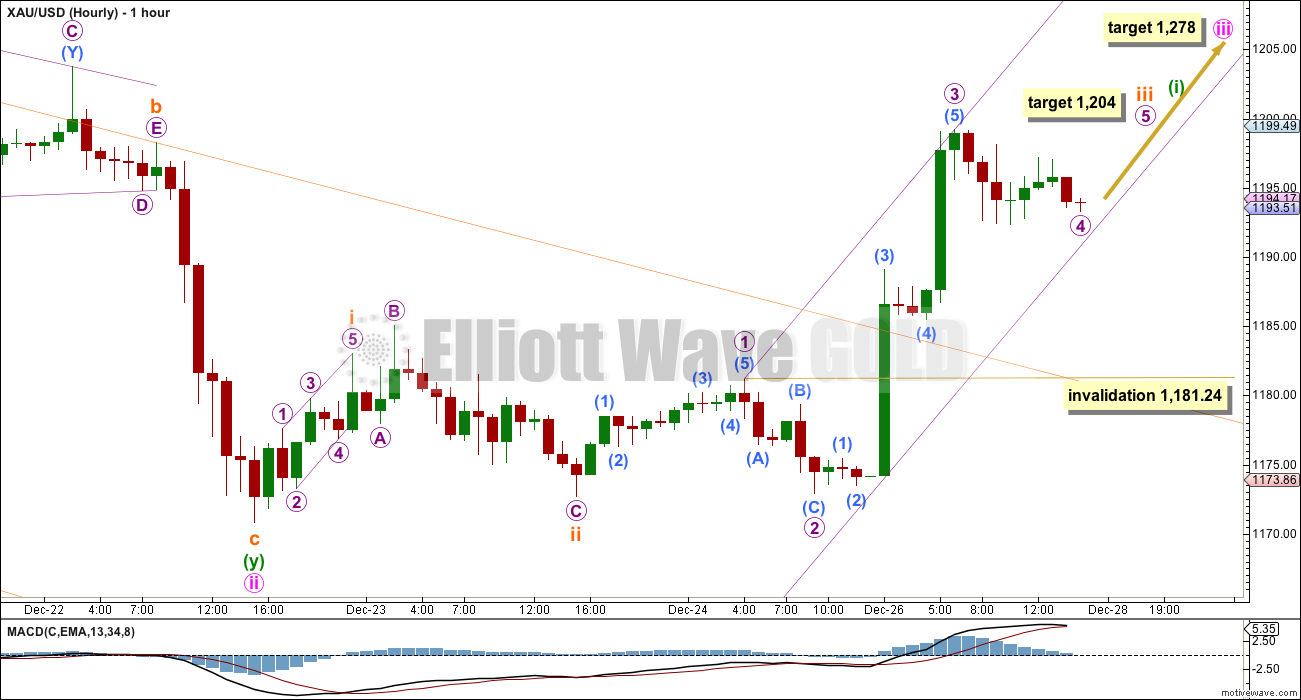
I have adjusted the wave count slightly for the beginning of minute wave iii. In the next few days I may also consider moving the degree of labelling within this upwards movement all up one degree. It may be as labelled here that minuette wave (i) is incomplete, or it may be that the middle of the third wave has just passed. I am using MACD as a guide; the middle of the third wave should show stronger momentum than the middle of minute wave i now off to the left of the chart. So far it does not, and I am judging that it has not yet passed.
This wave count expects to see a further increase in upwards momentum over the next few days.
Minute wave iii may only subdivide as a simple impulse, and within it most likely the first wave is incomplete.
Within minuette wave (i) subminuette waves i and ii are complete. Subminuette wave iii would reach 2.618 the length of subminuette wave i at 1,204. Subminuette wave iv may show up on the daily chart, so when subminuette wave iii is complete we may see a small red candlestick or doji for a shallow fourth wave correction.
I have drawn a best fit channel about the middle of minuette wave (i). If this channel is breached by downwards / sideways movement that may be subminuette wave iv.
Within subminuette wave iii micro wave 4 may not move into micro wave 1 price territory below 1,181.24.
When subminuette wave iii is over then the invalidation point must move up to the end of subminuette wave i at 1,183. Subminuette wave iv may not move into subminuette wave i price territory. At that stage the channel should be redrawn using Elliott’s first technique: the first trend line from the highs of subminuette waves i to subminuette wave iii (wherever it ends up), with a parallel copy on the low of subminuette wave ii. Expect subminuette wave iv to find some support at the lower edge of the channel.
Overall, I am expecting more upwards movement. Minute wave iii must make a new high above the end of minute wave i at 1,238.38, and it must move far enough above that to allow room for downwards movement for a subsequent fourth wave which may not move back into first wave price territory. At 1,278 minute wave iii would reach equality in length with minute wave i.
This analysis is published about 4:20 p.m. EST.
My line in sand is 1200. It must close above this for EW.
Today may be the test of Friday’s breakout.
Oil drops to 5 year low today and US Dollar at 5-year high today. Both put downward pressure on Gold.
Oil just hit Lara’s initial wave 3 target. AND Usd is going for the top rail at 92. Under this scenario I agree how gold can be going higher in wave iii????
Lara, if possible, please provide a quick update before publishing today’s analysis. Thanks.
I agree …….1156 by 31st Dec
From the low at 1170,67 a series of i-ii, i-ii, i-ii is still valid. Invalidation point is at 1172,78
Invalidation point of 1,181.24 has been invalidated at 10:48 am EST gold hit 1180.77.
“Within subminuette wave iii micro wave 4 may not move into micro wave 1 price territory below 1,181.24.”
Gold charts show a downtrend on gold at 1, 5, 15, and 30 minutes and 1 hour time frames.
New wave count???? below 1160 is the target.
What next now the invalidation point has been violated
Lara if the target is $1283, this would mean the upper trendline from 2011 would be breached on the weekly chart for the first time. I get it may just be one weekly candlestick with a long wick, but nonetheless still breached. Can you transfer the upper maroon line from the weekly over to the daily going forward so we can see where this trendline comes into play? Thank you!
That’s a good point. Yes, it would see that channel slightly breached on the weekly chart (on a semi-log scale).
The minimum I would expect is for C to move above A at 1,255.40. So yes, a 50% retracement at 1,264 would touch the maroon channel.
I think I’m going to move the daily chart back to a semi log scale and take the Fibonacci retracement off, and put the maroon channel back on. And maybe remove the price target and use the channel instead. That will probably be more accurate.
Thanks Chapstick. An excellent point.
Lara,
Great call on iii of C of 2, impressive!!