
The correction may have ended 4.46 below the expected low. The Elliott wave count remains the same.
Summary: There are two possible scenarios for Monday: either a short sharp upwards thrust to 1,235 (which would be confirmed with a new high above 1,213.45), or one more spike down to 1,168 – 1,172 before the third wave up begins (confirmed with a new low below 1,186.29). While price remains below 1,213.45 and above 1,186.29 both scenarios will be possible. Overall, the minor degree trend remains up and I still have confidence in the mid term target at 1,262 which remains the same for both scenarios.
Click on charts to enlarge
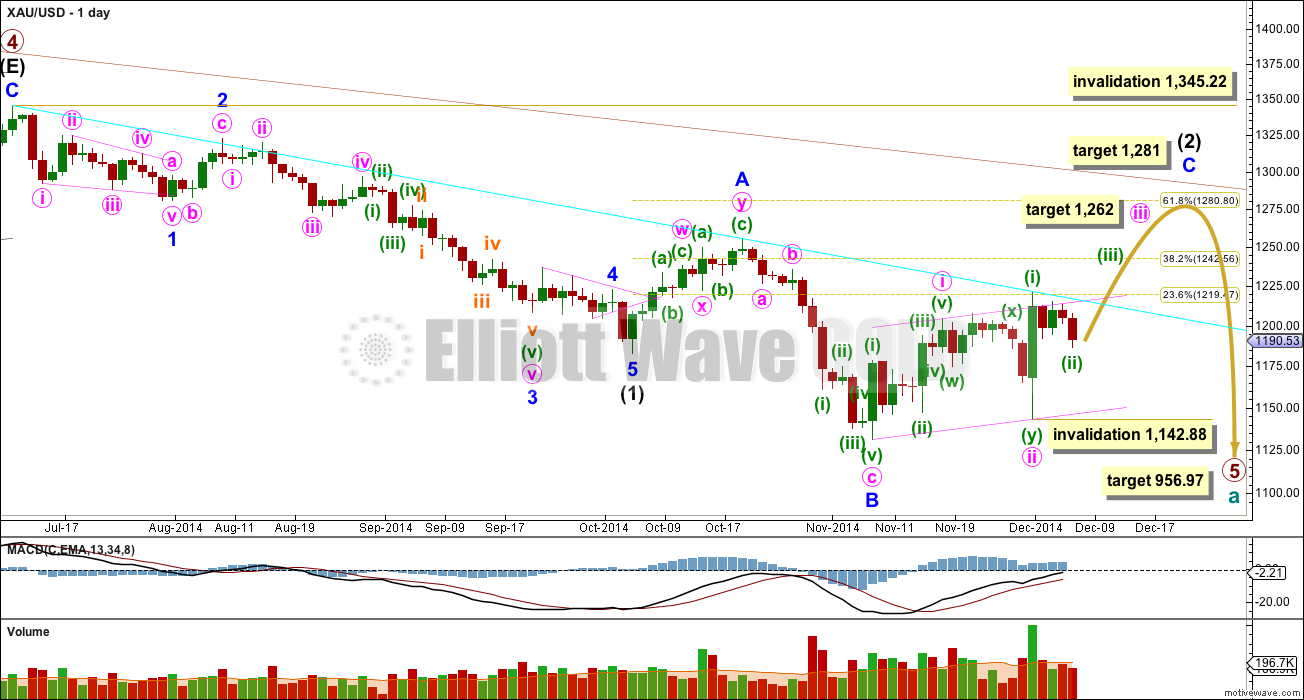
Primary wave 4 is complete and primary wave 5 is unfolding. Primary wave 5 may only subdivide as an impulse or an ending diagonal. So far it looks most likely to be an impulse.
Within primary wave 5 intermediate wave (1) fits perfectly as an impulse. There is perfect alternation within intermediate wave (1): minor wave 2 is a deep zigzag lasting a Fibonacci five days and minor wave 4 is a shallow triangle lasting a Fibonacci eight days, 1.618 the duration of minor wave 2. Minor wave 3 is 9.65 longer than 1.618 the length of minor wave 1, and minor wave 5 is just 0.51 short of 0.618 the length of minor wave 1. I am confident this movement is one complete impulse.
Intermediate wave (2) is an incomplete expanded flat correction. Within it minor wave A is a double zigzag. The downwards wave labelled minor wave B has a corrective count of seven and subdivides perfectly as a zigzag. Minor wave B is a 172% correction of minor wave A. This is longer than the maximum common length for a B wave within a flat correction at 138%, but within the allowable range of less than twice the length of minor wave A. Minor wave C may not exhibit a Fibonacci ratio to minor wave A, and I think the target for it to end would best be calculated at minute degree. At this stage I would expect intermediate wave (2) to end close to the 0.618 Fibonacci ratio of intermediate wave (1) just below 1,281.
Intermediate wave (1) lasted a Fibonacci 13 weeks. If intermediate wave (2) exhibits a Fibonacci duration it may be 13 weeks to be even with intermediate wave (1). Intermediate wave (2) has just completed its eighth week, and so it may continue now for another five weeks.
So far within minor wave C the highest volume is on an up day. This supports the idea that at this stage the trend is up.
The upper maroon trend line is the upper edge of the Elliott channel drawn about this impulse on the weekly chart, and copied over here to the daily chart. See the most recent Gold Historic Analysis to see how this trend line is drawn on the weekly chart. If minor wave C lasts long enough it should find extremely strong resistance at that trend line, I would not expect that trend line to be broken while primary wave 5 is incomplete.
The aqua blue trend line is a simple TA trend line which is showing where price is currently finding resistance. The power of the middle of the upcoming third wave should break above this trend line.
The target for primary wave 5 at this stage remains the same. At 956.97 it would reach equality in length with primary wave 1. However, if this target is wrong it may be too low. When intermediate waves (1) through to (4) within it are complete I will calculate the target at intermediate degree and if it changes it may move upwards. This is because waves following triangles tend to be more brief and weak than otherwise expected. A perfect example is on this chart: minor wave 5 to end intermediate wave (1) was particularly short and brief after the triangle of minor wave 4.
Intermediate wave (2) may not move beyond the start of intermediate wave (1) above 1,345.22. I have confidence this price point will not be passed because the structure of primary wave 5 is incomplete because downwards movement from the end of the triangle of primary wave 4 does not fit as either a complete impulse nor an ending diagonal.
To see a prior example of an expanded flat correction for Gold on the daily chart, and an explanation of this structure, go here.
*Note: I am aware (thank you to members) that other Elliott wave analysts are calling now for the end of primary wave 5 at the low at 1,131. I am struggling to see how this downwards movement fits as a five wave impulse: I would label the second wave within it (labelled minor wave 2) intermediate wave (1), and the fourth wave intermediate wave (4) (labelled as a double zigzag for minor wave A). Thus a complete impulse down would have a second wave as a single zigzag and a fourth wave as a double zigzag, which would have inadequate alternation. Finally, the final fifth wave down would be where I have minor wave B within intermediate wave (2). This downwards wave has a cursory count of seven, and I do not think it subdivides as well as an impulse as it does as a zigzag. If any members come across a wave count showing possible subdivisions of a complete primary wave 5 I would be very curious to see it.
Main Hourly Wave Count
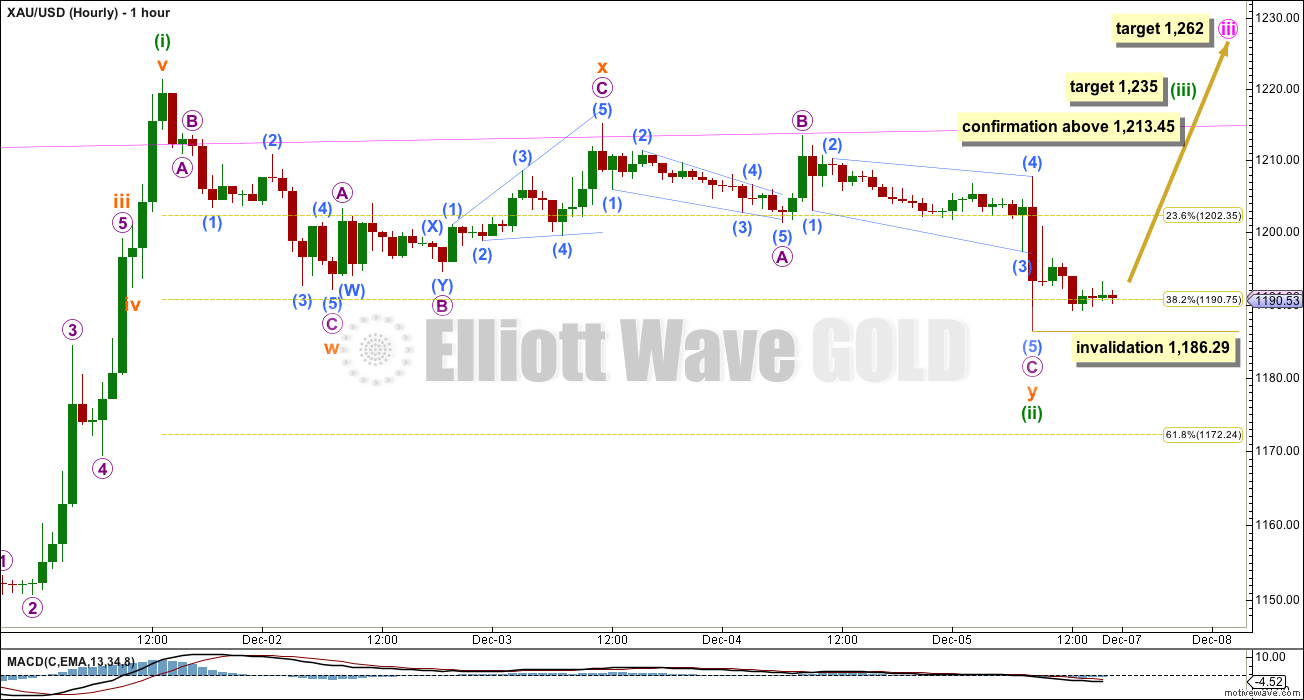
This wave count follows on from last hourly wave count. It is slightly adjusted.
Minuette wave (ii) may have completed not as a double combination but as a double zigzag. Within the second structure of the double, subminuette wave y, its B wave is less than 90% the length of its A wave so this structure cannot be a flat correction. Unfortunately, micro wave A is ambiguous and can be seen as either a three or a five.
Double zigzags are different in purpose to double combinations. While double combinations exist to take up time and move price sideways, double zigzags exist to deepen a correction when the first zigzag does not move price deep enough. Subminuette wave w did not reach down to the 0.382 Fibonacci ratio and so that certainly fits the description of not moving the correction deep enough.
If minuette wave (ii) is a double zigzag then it is over now. The second structure in the double is a complete 5-3-5, and has deepened the correction.
Within minuette wave (iii) no second wave correction may move beyond the start of its first wave below 1,186.29.
At 1,235 minuette wave (iii) would reach 0.618 the length of minuette wave (i). This would be a slightly unusual relationship for a third wave, but it is entirely possible (I have seen third waves which are shorter than the first waves before). The core Elliott wave rule which must not be broken is that the third wave may not be the shortest of the actionary waves (actionary waves are waves 1, 3 and 5 within an impulse). This is not the same as the third wave must be the longest, which is a common misunderstanding of Elliott wave rules.
However, this would be a little unusual and so for that reason I do not have full confidence in the target at 1,235. If it is wrong it will be too low.
I do have confidence in the target for minute wave iii. At 1,262 it would reach 1.618 the length of minute wave i. This is a very common ratio for a third wave.
Minuette wave (iii) must move far enough above the end of minuette wave (i) at 1,221.34 to allow room for movement for a subsequent fourth wave correction for minuette wave (iv) which may not move back into minuette wave (i) price territory. All Elliott wave rules for an impulse must be met for minute wave iii.
Alternate Hourly Wave Count
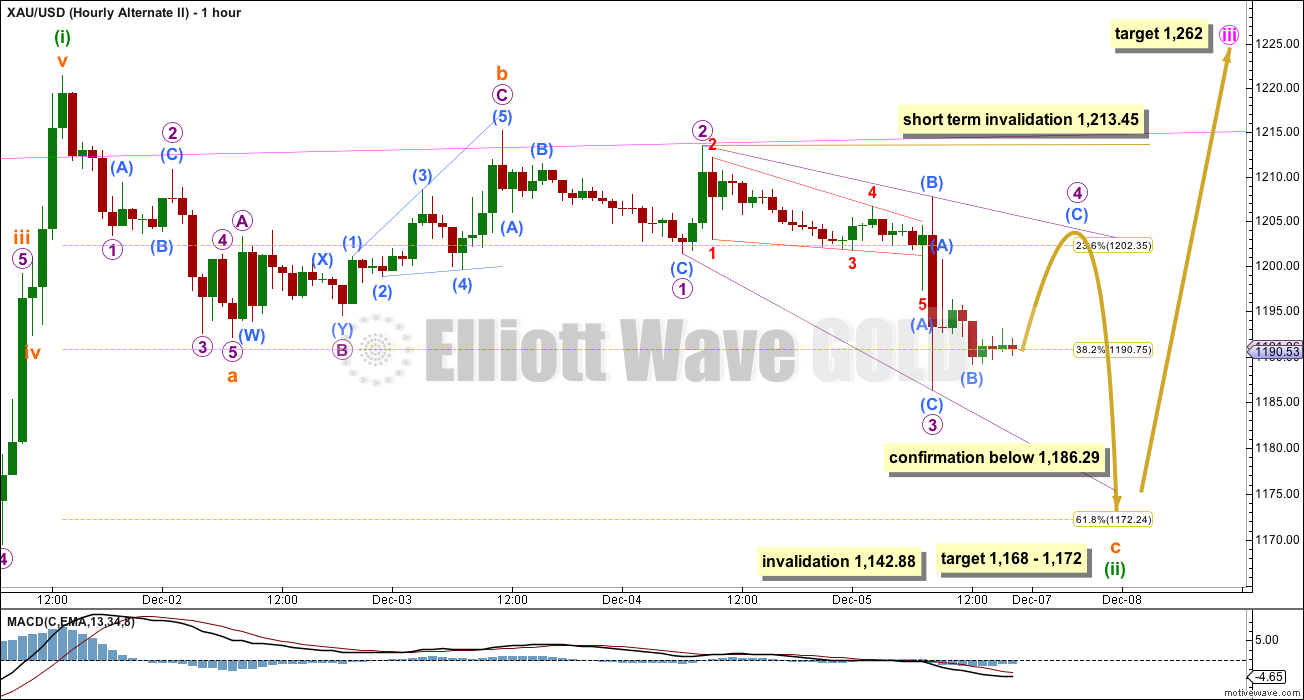
This wave count sees the subdivisions within minuette wave (ii) differently. What if it is a single zigzag and not a double?
Subminuette wave a does fit very nicely as a five wave impulse. There is perfect alternation between its second wave, a flat, and its fourth wave as a zigzag.
Subminuette wave b is seen as a complete zigzag in the same way as the main wave count sees this movement.
If minuette wave (ii) is a single zigzag then within it subminuette wave c must subdivide as a five wave structure. I have considered both an impulse and ending diagonal. It is difficult to see how the third wave would subdivide for an impulse, and so an ending diagonal is much more likely and has a better fit.
Within an ending diagonal all the sub waves may only subdivide as zigzags, and the fourth wave must overlap back into first wave price territory.
Within the possible ending diagonal of subminuette wave c micro wave 1 fits well as a zigzag. Micro wave 2 is a 0.88 correction of micro wave 1, only just longer than the maximum common length which is between 0.66 to 0.81.
Micro wave 3 fits well as a zigzag, and within it sub micro wave (A) is a leading contracting diagonal.
Micro wave 4 so far has not overlapped back into micro wave 1 price territory. It must move above 1,201.39. The rule for the end of a fourth wave of a diagonal is it must not move beyond the end of the second wave above 1,213.45.
This ending diagonal is expanding because micro wave 3 is longer in length with micro wave 1. This means micro wave 4 should be longer than micro wave 2, so it should reach above 1,198.35. It is most likely to end within the common range of 0.66 to 0.81 the length of micro wave 3, between 1,204.22 to 1,208.29.
Thereafter, a final zigzag downwards to the target would complete an ending expanding diagonal for subminuette wave c.
At 1,168 subminuette wave c would reach 1.618 the length of subminuette wave a. At 1,172 minuette wave (ii) would reach the 0.618 Fibonacci ratio of minuette wave (i). This gives a $4 target zone with a reasonable probability. If this target is met in one more day with one more candlestick then minuette wave (ii) may complete in a Fibonacci five days total.
Minuette wave (ii) may not move beyond the start of minuette wave (i) below 1,142.88.
If the main wave count is correct then it should be confirmed quickly on Monday. If the alternate is correct then it too should be confirmed on Monday as well.
This analysis is published about 08:58 p.m. EST.
Gold action is not like it is in wave (iii). It is flat. As long as price staying above 1195 is encouraging.
Gold price upto 1210 it will be not be clear on which wave count is in play.
Is there any other clue to look for: like how price is subdivided going up to 1210?
How the wave (iii) green is expected to be subdivide? (a,b,and c or five micro waves)?
By Monday evening it will be decided which wave count is at play.. Lara your guidance will not be till close on Monday?????
With both wave counts outcome is same. Monday is the moment of truth for GOLD.
I hope certainly gold will resolve this in next 24 hour trading window
In this case one can expect gold to close higher on Monday than Friday’s close.
I know of two trader’s forums where participants took large amount short positions on miners before closing.
Personally USD broke out to new high and Euro down. Both negative for gold. Along with these two currencies YEN broke to new low.
USD is heading towards 92 and Euro is heading for below 120.
That is a huge concern. Unless the short term trend in currencies changes on Monday.
Thanks Lara!!!!!
Gold was up over 2% on the week while the USD was up for the week as well. The correlation is not strong. It’s been a frustrating few days for the gold bulls, but I think Lara’s count is still correct. The move from $1220 is clearly corrective IMO. Gold had the perfect downside catalyst a week ago and initially moved lower. However, the $80 upside move in 12-14 hrs on bad news tells me the move from $1130 is clearly not over. Gold should be higher next week after being up 2%+ this week.
Thanks for clarity. I think current counts are both positive gold bulls.
papudi
Yes both gold counts are positive. Just the alternate wave count has maybe up to a one day delay detour before moving up to the same target as the main wave count.
For an interesting correlation check out an inverse Nikkei and Au chart.
http://www.zerohedge.com/news/2014-12-04/inside-look-shocking-role-gold-new-normal
Now that Abenomics seems to tip from teeter to totter, will the correlation continue or decouple? Interesting, no, that serious equity market and economic troubles bring forth tonnes of unallocated bullion on the LBMA, and 90 to 1 levered GC contracts on the Comex for selling, when the opposite would seem to be called for? Do large and powerful sovereign and banking cartel market players have a vested interest in diverting public sentiment away from real money to protect their fiat currency “utopias?”
It is clear that the dollar is not, in purchasing power terms, what it was in ’71, ’80, or even ’00, yet by default we continue to use the shrinking USD currency ruler to measure Au and Ag. For short term trading the international reserve USD is as good as any other fiat currency ruler, but long term, a purchasing power adjusted chart takes on a whole different appearance from the nominal price chart in Elliott Wave perspective. Also, what is one to make of the spike in dealer premiums over spot to acquire physical Au and Ag over the last three years of declining nominal currency PM prices in the paper/digital markets, or the backwardation of GOFO and the futures co-basis?
Any Elliott Wave purist will tell you price reflects sentiment, and shifts in sentiment occur in identifiable wave patterns, but didn’t Elliott develop his principles when the dollar currency was still defined as a fixed weight of Au ($20.67, later $35, per Troy oz.) and at least redeemable for Ag specie? What happens when both government and financial powers are heavily motivated to influence public sentiment vis a vis their fiat currencies against historic money? If one were a currency manipulator, wouldn’t one use Elliott Wave principles to lend the appearance of legitimacy to price movement influence of one’s HFT algo actions on the Forex, LBMA, and Comex? Please remember that the Federal Reserve is a government legislated cartel of banks, and that both the US govt, and the banks are dependent on the continuation of a fractional reserve debt based fiat currency system, probably for their very survival. To what lengths would you go to preserve such a monetary [sic] system, particularly if you benefited so much by it?
I’m sort of off topic with all this big picture manipulation conspiracy stuff, but it doesn’t take much investigation to realize something is rotten in more than the State of Denmark. I do lament not being able to provide Au, Ag, HUI, even S&P and Oil 1968 (gold pool collapse) to present day inflation/purchasing power adjusted monthly data or charts for Lara’s practiced eyes’ perusal. I think such charts would provide more accurate EW readings, especially at cycle and super cycle degrees.
Best regards, Der Kratz