
A new high above 1,213.45 confirmed the main hourly Elliott wave count and invalidated the alternate.
The short term target at 1,235 has been exceeded by 3.38 so far, but the structure is incomplete. The target was too low. The higher mid term target remains the same.
Summary: Upwards movement should continue and momentum should increase further. I do not have a target for minuette wave (iii) for you, and we will have to use channels to show when it is done. The mid term target for minute wave iii at 1,262 remains the same, but there should be one more consolidation phase for minuette wave (iv) along the way up to this target.
Click on charts to enlarge
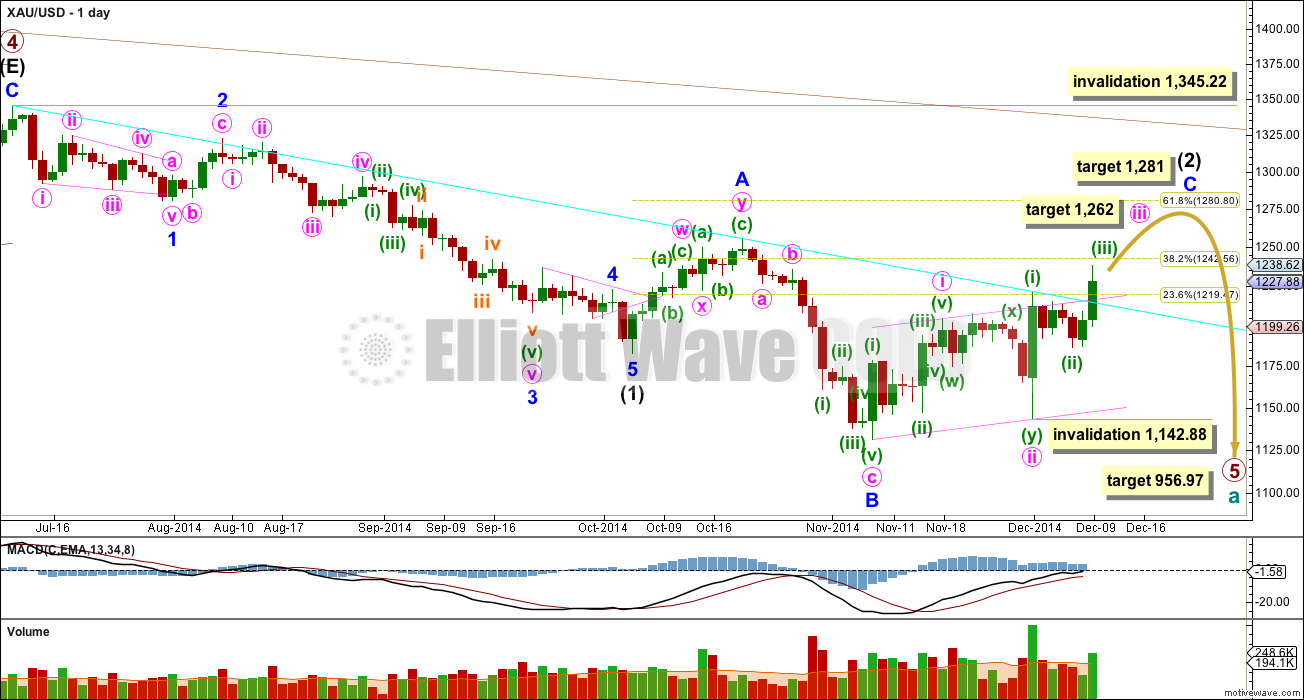
Primary wave 4 is complete and primary wave 5 is unfolding. Primary wave 5 may only subdivide as an impulse or an ending diagonal. So far it looks most likely to be an impulse.
Within primary wave 5 intermediate wave (1) fits perfectly as an impulse. There is perfect alternation within intermediate wave (1): minor wave 2 is a deep zigzag lasting a Fibonacci five days and minor wave 4 is a shallow triangle lasting a Fibonacci eight days, 1.618 the duration of minor wave 2. Minor wave 3 is 9.65 longer than 1.618 the length of minor wave 1, and minor wave 5 is just 0.51 short of 0.618 the length of minor wave 1. I am confident this movement is one complete impulse.
Intermediate wave (2) is an incomplete expanded flat correction. Within it minor wave A is a double zigzag. The downwards wave labelled minor wave B has a corrective count of seven and subdivides perfectly as a zigzag. Minor wave B is a 172% correction of minor wave A. This is longer than the maximum common length for a B wave within a flat correction at 138%, but within the allowable range of twice the length of minor wave A. Minor wave C may not exhibit a Fibonacci ratio to minor wave A, and I think the target for it to end would best be calculated at minute degree. At this stage I would expect intermediate wave (2) to end close to the 0.618 Fibonacci ratio of intermediate wave (1) just below 1,281.
Intermediate wave (1) lasted a Fibonacci 13 weeks. If intermediate wave (2) exhibits a Fibonacci duration it may be 13 weeks to be even with intermediate wave (1). Intermediate wave (2) has just begun its ninth week, and so it may continue now for another five weeks in total.
So far within minor wave C the highest volume is on an up day. This supports the idea that at this stage the trend is up.
The upper maroon trend line is the upper edge of the Elliott channel drawn about this impulse on the weekly chart, and copied over here to the daily chart. See the most recent Gold Historic Analysis to see how this trend line is drawn on the weekly chart. If minor wave C lasts long enough it should find extremely strong resistance at that trend line, I would not expect that trend line to be broken while primary wave 5 is incomplete.
The aqua blue trend line is a simple TA trend line which is showing where price is currently finding resistance. The power of the middle of the upcoming third wave should break above this trend line. If this trend line begins to be breached that may be the earliest indication that the main hourly wave count is correct today. I am copying this trend line over to the main hourly wave count today.
The target for primary wave 5 at this stage remains the same. At 956.97 it would reach equality in length with primary wave 1. However, if this target is wrong it may be too low. When intermediate waves (1) through to (4) within it are complete I will calculate the target at intermediate degree and if it changes it may move upwards. This is because waves following triangles tend to be more brief and weak than otherwise expected. A perfect example is on this chart: minor wave 5 to end intermediate wave (1) was particularly short and brief after the triangle of minor wave 4.
Intermediate wave (2) may not move beyond the start of intermediate wave (1) above 1,345.22. I have confidence this price point will not be passed because the structure of primary wave 5 is incomplete because downwards movement from the end of the triangle of primary wave 4 does not fit as either a complete impulse nor an ending diagonal.
To see a prior example of an expanded flat correction for Gold on the daily chart, and an explanation of this structure, go here.
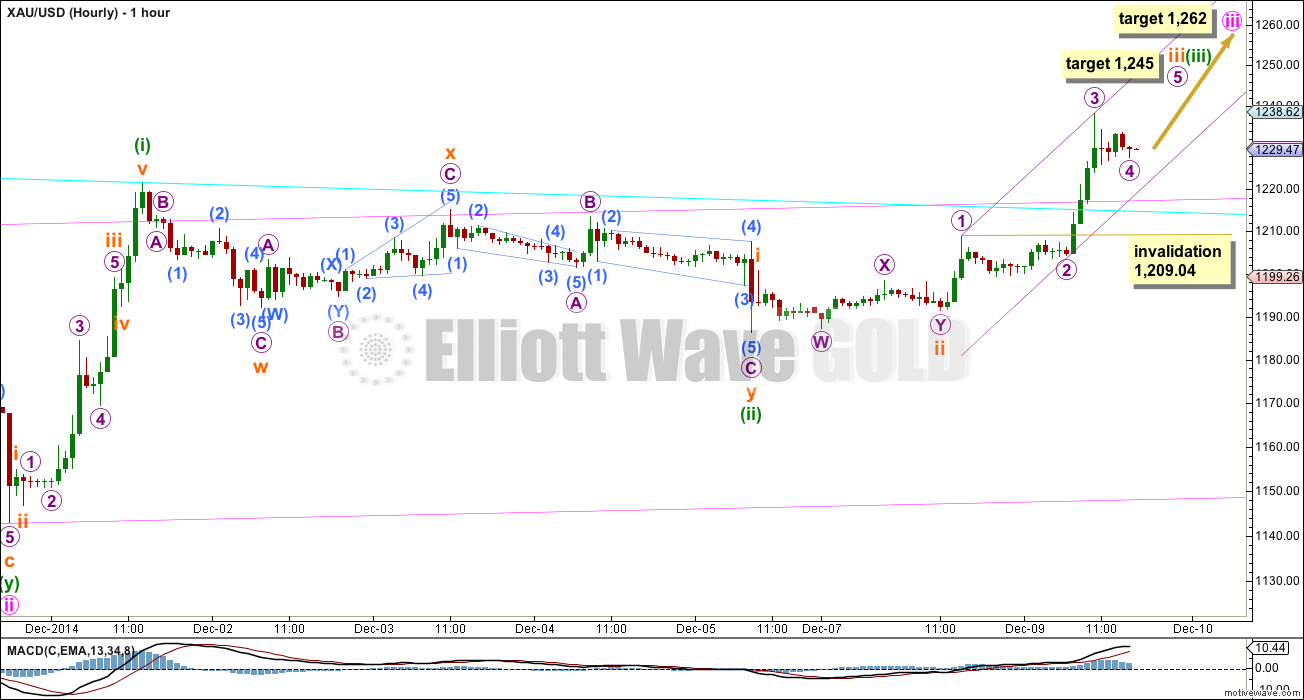
The middle of a third wave up is underway. The structure for minuette wave (iii) is incomplete.
Minuette wave (iii) has passed 0.618 the length of minuette wave (i). Were it to reach equality in length with minuette wave (i) it would end above 1,262 which is the target for minute wave iii to end in its entirety. I do not think that minuette wave (iii) will exhibit a Fibonacci ratio to minuette wave (i) and so a target for it to end would better be calculated one degree lower, at subminuette wave degree. I cannot do that until subminuette waves iii and iv are complete.
Within minuette wave (iii) subminuette waves i and ii are complete. Subminuette wave iii is close to completion, and needs only the final fifth wave up for micro wave 5 to complete. At 1,245 micro wave 5 would reach equality in length with micro wave 1. If micro wave 4 moves any lower before micro wave 5 begins then this target must also move correspondingly lower.
I have checked the end of micro wave 2 (is this where it ends?) carefully on a five minute chart. Importantly, I see the upwards middle of it subdivides best as a three. Micro wave 2 looks like a sideways double combination, zigzag – X – triangle, on the five minute chart and so I will label it as over here. Micro wave 4 looks like a triangle.
Micro wave 4 may not move into micro wave 1 price territory.
I expect a continuation of upwards movement for the next day; Wednesday should complete another green candlestick. Look out for a possibly strong fifth wave, typical of commodities, to end minuette wave (iii). This may not happen, but it happens often enough to be something to look out for.
Use trend channels to indicate when minuette wave (iii) is over. For now draw a channel using Elliott’s first technique about the middle of this third wave: draw the first trend line from the highs labelled micro waves 1 to 3, then place a parallel copy on the low labelled micro wave 2. When this channel is breached that would indicate subminuette wave iii is over and subminuette wave iv is unfolding. When that happens redraw the channel about subminuette waves using the same technique: the first trend line from the ends of waves 1 to 3 with a parallel copy on the end of the second wave. Look for that redrawn channel to show where subminuette wave iv may end.
When we can count a complete five wave impulse upwards for minuette wave (iii) then it should be over. The following sideways movement for minuette wave (iv) should show up on the daily chart as a sideways consolidation lasting a few days, and it may be very deep because minuette wave (ii) was shallow. But we are not there yet.
Momentum within minuette wave (iii) has not yet exceeded momentum within minuette wave (i). Because the third wave should be stronger than the first wave I would expect to see a further increase in upwards momentum over the next 24 hours. The final fifth wave may be even stronger still, or it may not. Sometimes commodity fifth waves are very strong.
This analysis is published about 04:52 p.m. EST.
When is the wave 5 rally today coming to 1245 or are we stuck in an extended 4th wave correction or has wave 5 ended already today at 1238 and we are in multi-day wave (iv) down. Today some big oil sell off hammered gold as well or was just an Elliott Wave correction unexpectedly.
We’re stuck in a fourth wave now. But it has to be shallow. The invalidation point is REALLY close by at 1,221.34
Actually Richard, after further analysis the invalidation point has to be at 1,186.29.
Lara,
When using motive wave, how do you treat the following problem… labeled counts become skewed when switching between time frames. Exp. A candlestick that is labeled minuette 1 on a daily chart becomes skewed to another location when toggling to a 6 hour, 1 hour etc..
Do you have different charts for each time frame?
Great work btw…
Good question. I’ll do another video tomorrow showing you all how I decide on the wave count and how I use Motive Wave, members seem to find this useful sometimes.
The short answer is different wave counts for different time frames. Start at the highest time frame and finish that wave count. Then create a new wave count based on that first one, and look at the new count on a lower time frame and fill in the subdivisions. Rinse and repeat as you move from monthly through to hourly and even 5 minute.
Thanks, that would be amazing of you. I would certainly appreciate that!
Lara excellent job identifying correct EWs.
Micro wave 4 moved back up again to 1240 and now down to 1227.
Is microwave 4 developing as W,X and Y?
papudi
Micro wave 4 is a down wave and you think it hit 1238 at 1 am EST? That surely would be micro wave 5 moving up like it is supposed to. Micro wave 5 has to exceed 1238 and target is 1245. See Lara comment.
“Subminuette wave iii is close to completion, and needs only the final fifth wave up for micro wave 5 to complete. At 1,245 micro wave 5 would reach equality in length with micro wave 1. If micro wave 4 moves any lower before micro wave 5 begins then this target must also move correspondingly lower.”
Sorry I was not clear. At 1238 wave X of WXY of micro 4 completed. Now for micro wave 4 to complete it needs Y bottom???
Micro 4 is still not complete and may go longer than 48 hour???
papudi
What you are saying is a big surprise. Lara was mentioning micro 4 on the downside and no menton of WXY or going way back up, that doesn’t sound right. I think we should be in the 5th wave.
Nope. I think my wave count was actually wrong up to subminuette wave degree.
This is minuette wave (iv). Its subdividing as a 5-3-5 zigzag with the B wave a triangle.
Do I understand correctly that green minuette wave (iii) and orange Subminuette wave (v) will complete at the same time? Then green minuette wave (iv) will begin having deep correction.
Currently there are three waves with colors, orange, green and Pink.
Once the the Pink wave (v) is complete intermediate wave (2) C will complete.
Looking for next impulse move up.
Yes. You are exactly right.
At this stage I think that green minuette wave (iii) was actually complete, because we have a small red candlestick on the daily chart. This must be minuette wave (iv) because a lower degree wave should not show up on the daily chart.