
Some upwards movement was expected, but the target at 1,226 has been passed. The Elliott wave count remains the same, and I have a new alternate for you.
Summary: In the short term upwards movement may end at 1,234. Thereafter, the main wave count expects a downwards wave to end below 1,204.65. I should have a target for that downwards wave for you tomorrow. Alternatively, if price remains above 1,216.77 it is possible that the final upwards wave has begun, but this has a low probability.
Click on charts to enlarge.
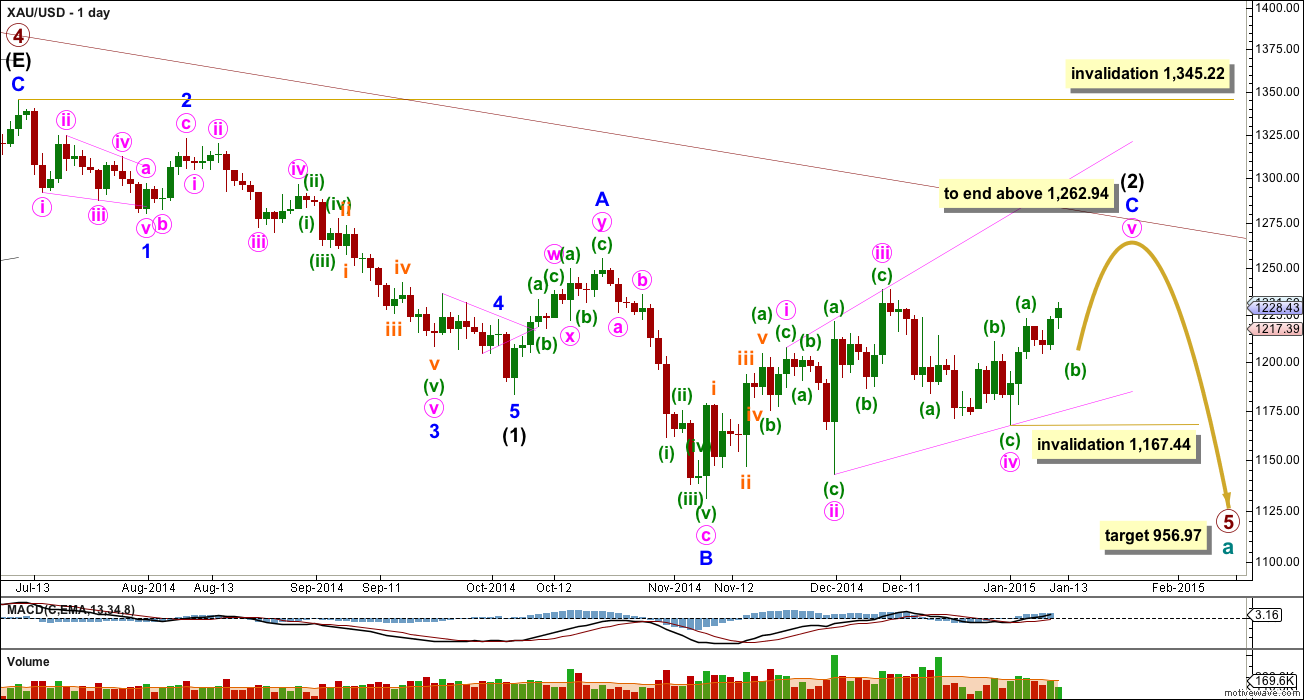
Primary wave 4 is complete and primary wave 5 is unfolding. Primary wave 5 may only subdivide as an impulse or an ending diagonal. So far it looks most likely to be an impulse.
Within primary wave 5 intermediate wave (1) fits perfectly as an impulse. There is perfect alternation within intermediate wave (1): minor wave 2 is a deep zigzag lasting a Fibonacci five days and minor wave 4 is a shallow triangle lasting a Fibonacci eight days, 1.618 the duration of minor wave 2. Minor wave 3 is 9.65 longer than 1.618 the length of minor wave 1, and minor wave 5 is just 0.51 short of 0.618 the length of minor wave 1. I am confident this movement is one complete impulse.
Intermediate wave (2) is an incomplete expanded flat correction. Within it minor wave A is a double zigzag. The downwards wave labelled minor wave B has a corrective count of seven and subdivides perfectly as a zigzag. Minor wave B is a 172% correction of minor wave A. This is longer than the maximum common length for a B wave within a flat correction at 138%, but within the allowable range of twice the length of minor wave A. Minor wave C may not exhibit a Fibonacci ratio to minor wave A. Minor wave C is extremely likely to move at least slightly above the end of minor wave A at 1,255.40 to avoid a truncation and a very rare running flat correction. It may end when price touches the upper edge of the maroon channel, copied over here from the weekly chart. To see how to draw this channel click here.
To see a prior example of an expanded flat correction for Gold on the daily chart, and an explanation of this structure, click here.
So far within minor wave C the highest volume is on three up days. This supports the idea that at this stage the trend remains up. Even for the last 13 trading days the highest volume is in four up days.
Minor wave C may be either an impulse or an ending diagonal. With all the overlapping within it, an ending diagonal looks more likely, and it is now within the final fifth wave up. The diagonal is expanding and the trend lines clearly diverge. Expect the final fifth wave of expanding diagonals to fall short of the i-iii trend line. Minute wave v should be longer than equality with minute wave iii which would be achieved at 1,262.94. This would also see minor wave C end above the end of minor wave A at 1,255.40 avoiding a truncation and a very rare running flat.
Within an ending diagonal all the sub waves must subdivide as zigzags. The fourth wave should overlap first wave price territory. The rule for the end of a fourth wave of a diagonal is it may not move beyond the end of the second wave.
Intermediate wave (2) may not move beyond the start of intermediate wave (1) above 1,345.22. I have confidence this price point will not be passed because the structure of primary wave 5 is incomplete because downwards movement from the end of the triangle of primary wave 4 does not fit well as either a complete impulse nor an ending diagonal. If it is seen as a complete impulse there would be inadequate alternation between the single zigzag of the second wave and the double zigzag of the fourth wave correction, and there would be no Fibonacci ratios between the first, third and fifth waves within it.
Main Hourly Wave Count
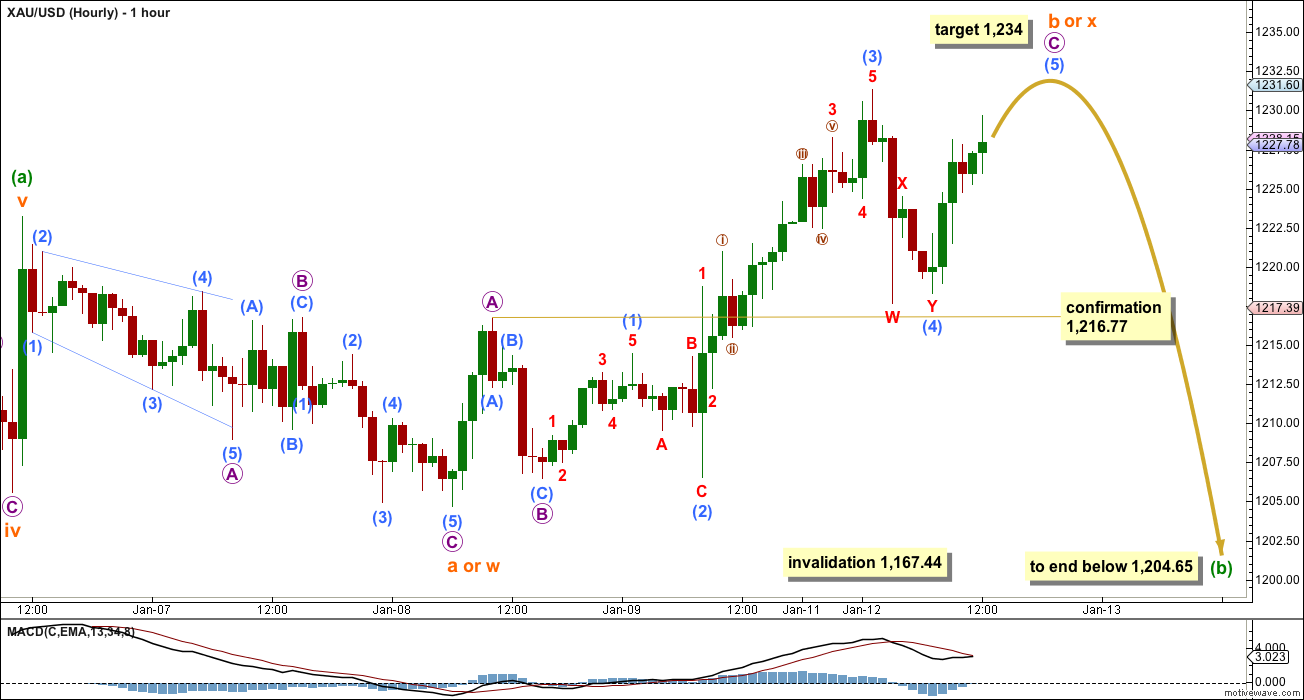
It is most likely that minuette wave (b) is incomplete. I would judge this main wave count to have about an 85% probability.
Minuette wave (b) at this stage looks like it may be unfolding as an expanded flat correction, which are very common structures. The text above for the daily chart links back to a prior example of an expanded flat within Gold so you may see what these look like when they’re done.
If minuette wave (b) is an expanded flat correction then so far within it subminuette wave b is a 144% correction of subminuette wave a. This is a little longer than the maximum common length of 138%, but still well within the allowable limit of 200%. I have seen plenty of expanded flats with rather long B waves.
Expanded flats subdivide 3-3-5 and the B waves within them often convince us there has been a trend change, right before their C waves move strongly in the opposite direction. I am judging this wave count to have the highest probability because it would be unlikely for minuette wave (b) to have been over in just two days, and because expanded flats are very common.
Within subminuette wave b the structure must subdivide as a three, and this upwards movement looks like it may be a zigzag. At 1,234 submicro wave (5) would reach 0.618 the length of submicro wave (3).
When micro wave C can be seen as a complete five wave structure, with one final upwards wave complete, then subsequent movement below 1,216.77 would confirm this main wave count and invalidate the alternate below. When I know where subminuette wave b has ended I can calculate a target downwards for subminuette wave c for you. I would expect subminuette wave c to most likely be either 1.618 or 2.618 the length of subminuette wave a, so either $30 or $49 in length, depending on how high subminuette wave b goes.
If minuette wave (b) is a flat correction then it is extremely likely that subminuette wave c will move at least slightly below the end of subminuette wave a at 1,204.65 to avoid a truncation and a very rare running flat. Subminuette wave c must subdivide as a five wave structure, most likely an impulse. C waves of expanded flats are normally clear and strong.
It is also still possible (but now much less likely) that minuette wave (b) may be unfolding as a combination or a triangle. These possibilities would expect mostly sideways movement for a few days yet. I will keep these in mind and chart them if they show themselves to be more likely.
Alternate Hourly Wave Count
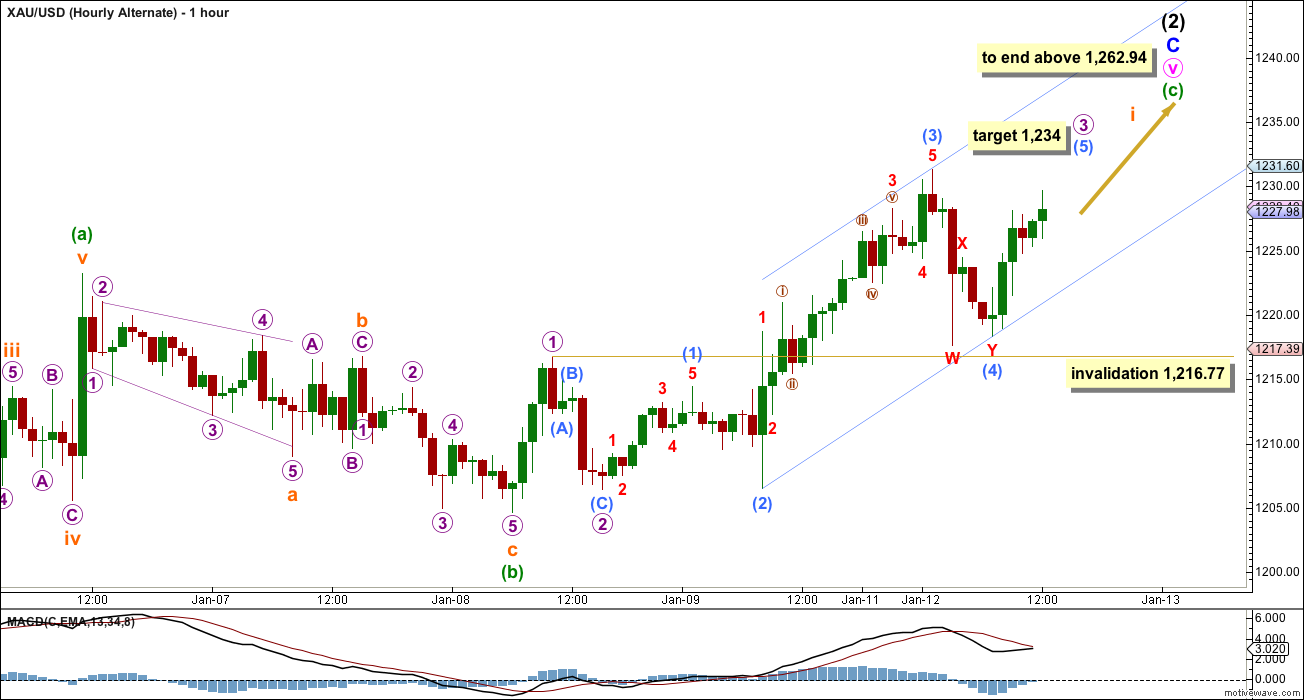
By simply moving the degree of labelling within minuette wave (b) up one degree it is possible to see that it could be over. However, this wave count has a low probability. It would see minuette wave (b) as lasting only two days, which is more brief than the prior two minuette (b) waves within the larger diagonal structure on the daily chart. This is possible, but unlikely.
A-B-C and 1-2-3 both subdivide 5-3-5. When the 5-3-5 is complete then what happens next should tell us which wave count is correct. A new low below 1,216.77 would invalidate this alternate and confirm the main wave count because micro wave 4 may not move into micro wave 1 price territory.
Once micro wave 3 (which the main wave count sees as micro wave C) is complete and we see a sideways movement which is very corrective and remains above 1,216.77, then at that stage it may be micro wave 4 and minuette wave (c) upwards may be underway. Market behaviour (strongly down or sideways?) will provide clues at that stage as to which wave count is correct.
This analysis is published about 1:40 p.m. EST.
Lara issued a SECOND UPDATE at 1:03 am Tuesday
Lara thanks I see your new analysis tonight. Thanks a lot
This analysis is published about 1:03 a.m. EST.
Lara is gold high of $1,241.25 at 8:20 pm instead of your high target of 1,234 a problem for the main wave count still being a probability? You had mentioned minuette wave b being an expanded flat correction at 144% within allowable limit of 200%. I think it may have reached between 190 and the 200% mark now.
Hi Lara,
Would love any update on Silver anytime, please-pretty-please 🙂
No, or at least, I don’t think so.
Alternation (the guideline) applies to similar waves within the same movement, such as waves 2 and 4 or waves 1 and 5 or waves A and C.
I guess it could apply to these B waves… and it should be applied flexibly.
Gold seems to be encountering some resistance at around the last high of 1239 (from December), which is to be expected before it can break above.
Someone here previously mentioned an inverted HNS forming. On the daily I see its neckline is about 1234 currently.
Interesting that this 1234 also matches Lara’s 1234 target on the hourly. So this 1234-39 area could be pivotal for the next while.
Silver is also up at Res trendlines of 1675, then 1782 and major support-turned-resistance @ 1860
That 18.60 is inside Lara’s last Silver target range for minute C and minor 2.
Wonder whether silver has enough momentum to reach up that high in time before the next trend change?
seems the alternate is in motion
Lara did not provide any confirmation of alternate wave . Only invalidation is mentioned.
Gold moving higher than 1234 makes the confirmation?
Lara did talk about minuet the wave b being an expanded flat correction at 144%. Well, we are around the 200% mark now.
Actually not quite 200%, however, above 190%. Technically still ok, but seriously questionable.
Note the numerous holidays plus half-days virtual-holidays etc from late December thru start-of January across North America, Europe, and the Far East. For cyclical price-time analysis, one must adjust time count accordingly.
Thus, this is just in the 13th week now IMO
the next turn window is later on this week.
For the Gold, watching TL and SILVER. Both indic next leg up.
Gold closed monday above horizontal resistance and gann line.
Silver outperformed gold for the week and is doing so again today.
I watch SILVER chart for insight into gold. That’s not EW theory but it’s reality.
IMO with no chart weakness in Silver, gold won’t correct much until next turn window.
Lara any comment on gold’s spike to 1241 at 8:30PM EST?
May be this is the begining of down wave now with huge inverted hammer a reversal in candlesticks pattern.
Hi Lara and E wavers:
For some years I have been reading Ron rosen’s EW on gold and SPX. He has been wrong becaz he has been calling for gold above 2000 in 2013 and again in Jan of 2014.
Again today he posted this EW count on gold. Take a cursory look at his new count and see if it deserve any merit???
Although he quotes EWP and i got familiar with EWaves.
http://www.321gold.com/editorials/rosen/rosen011215.pdf
His archive posts:
http://www.321gold.com/archives/archives_authors.php
GDXJ getting close to resistance. Larger 4th wave pullback may “fit” well with Lara’s main Gold count. My upside target range shown in yellow after pullback.
Bob B, yes miners have pushed well ahead of gold, they are due for either a pause or correction.
Nice chart. Did you do the chart or is there a service charting GDXJ ? I like to trade miners but as Lara does not chart them every day, their volatility can be dangerous.
This is my own chart and I’m not a pro. Just trying to plan my entry and exit points for JNUG and JDST from where I think GDXJ is, and considering Lara’s Gold and GDX counts. Chart is made using “free” tools on Stockcharts.
It’s stockcharts and it’s free just google it and enjoy.
J.
To clarify, I meant GDXJ projected move at end of the chart, not chart itself but analysis. Looking for service that does EW analysis for miners, GDXJ etc. Lara does GDX every week or so but volatility in miners is so great I’m looking for everyday analysis.
Are you saying the blue line projections on Bob B chart above are created by stockcharts?
No that’s his own ingenuity.
There is software that does EW wave counts for you but according to some EW traders it’s not too good and makes counting errors.
EWI (Elliott Wave International), does daily $HUI analysis. $HUI is similar to GDX. They are expensive, not even close to Lara in detail, and not nearly as accurate as Lara.
GDXJ has been strong versus Gold since mid-December
Lara, thanks for making the 85% probability call, many analysts wiggle and waffle so as to claim they were never wrong. Respect to you.
I bought a small position in DUST at the close today as written analysis mentioned 85% probability of main hourly wave count gold heading down.
Also video gave several strong reasons supporting the main wave count. Also after 2 strong days up in gold, likely due for a strong correction down.
Glad I decided not to buy DUST Friday night as it dropped 10.72% today.
Now I cross my fingers and toes in a Fibonacci ratio pointing down. LOL
FWIW, was previously down on JNUG since bought last Wed near 37. Held to 41.84 today. Also opened small position on JDST near close today, sold half of position in MUX at today’s high.
Alister, great JNUG trade. May our DUST/JDST choices be wise and properous for us and the main wave count validate below 1,216.77 ASAP.
Just fyi, MUX is largely a Silver stock, even tho McEwen was a gold guy. As you may already know.
J, thanks for the heads-up – I actually had no idea! Despite having read many articles on the company, I remember none of them highlighting this. Good lesson to actually read the quartely reports! Thanks for your comments on here and all the best with your trading.
Friday was not the day to buy DUST. I am still concern to short yet. GDXJ and gold just broke out of head and shoulder formation. Must respect HnS break.
Chart of gold below shows waves and HnS.
Unless this B wave is deceiving as Lara says.
On 8th Jan Kara wrote: Of all Elliott waves it is B waves which exhibit the greatest variety in
form and structure. They can be quick sharp zigzags (which can even
fool us into thinking they’re impulses; for a great example of this look
at minor wave B to the low on the daily chart) ,,,,,,
Gold is in impulse wave feeling that way????? Alll we need to be right that gold is in wave B!!!!
Lara, what’s the probability % for the alternate? Ty…..
15% ALTERNATE 85% MAIN HOURLY
Ty Richard
Lara, I think we are wave iii simply because of time. If gold needs to get to $1265ish AND not reach upper trendline, there isn’t time for b wave to continue lower especially below $1205ish. Just my opinion though.
There is lots of time
Ok, whatever you say. With no signs of reversal and if this is wave iii, 1.618 * wave i = $1260ish. Int 2 finishes its 13 week fri. This all fits perfectly with the big picture.
Why people are talking about 13th week? Since 7th of October the 2nd wave started it is already 15th week.
As I understand duration is not a strict rule but more guidance in EW so the wave can continue longer than 13 weeks.
Chapstick, I always appreciate your contributions and the reasoning you give for them, even (and often especially) when you may sometimes question Lara’s main wave count. Thank you for posting.
Replied to Chapstick in wrong place (Alister)
My bad, beginning its 14th week today
This is 13th week.. See my post 8 minutes ago higher up. Adjust for major holidays just past… adjust time counts every january.
Yep, long and strong. Lara’s daily chart has been on-track for a long time
Would perhaps the rule of alternation allow for the possibility that Minuette wave (b) is shorter than the other b waves so far ?