
The second wave ended just short of the target at 1,225.15 by 0.99. Thereafter, upwards movement looks like a typical third wave.
Summary: The trend at minute, minor and intermediate degree remain up today, but this structure is getting close to completion. A small shallow fourth wave correction should show up on the daily chart as one to three red candlesticks or doji. Thereafter, a final short fifth wave up may take price up to touch or get very close to that maroon trend line.
Click on charts to enlarge.
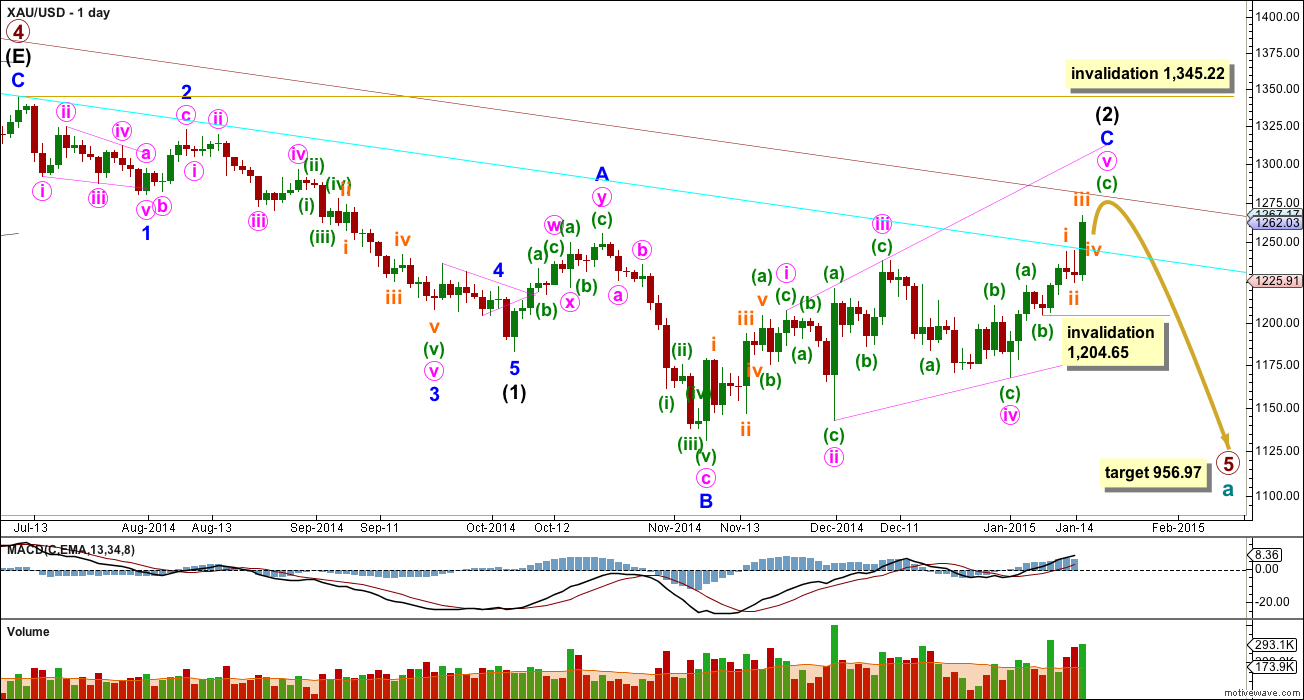
Primary wave 4 is complete and primary wave 5 is unfolding. Primary wave 5 may only subdivide as an impulse or an ending diagonal. So far it looks most likely to be an impulse.
Within primary wave 5 intermediate wave (1) fits perfectly as an impulse. There is perfect alternation within intermediate wave (1): minor wave 2 is a deep zigzag lasting a Fibonacci five days and minor wave 4 is a shallow triangle lasting a Fibonacci eight days, 1.618 the duration of minor wave 2. Minor wave 3 is 9.65 longer than 1.618 the length of minor wave 1, and minor wave 5 is just 0.51 short of 0.618 the length of minor wave 1. I am confident this movement is one complete impulse.
Intermediate wave (2) is a close to complete expanded flat correction. Within it minor wave A is a double zigzag. The downwards wave labelled minor wave B has a corrective count of seven and subdivides perfectly as a zigzag. Minor wave B is a 172% correction of minor wave A. This is longer than the maximum common length for a B wave within a flat correction at 138%, but within the allowable range of twice the length of minor wave A. Minor wave C may not exhibit a Fibonacci ratio to minor wave A. Minor wave C is extremely likely to move at least slightly above the end of minor wave A at 1,255.40 to avoid a truncation and a very rare running flat correction. It may end a little short of the upper maroon trend line (most likely) or it may end when price touches the upper edge of the maroon channel, copied over here from the weekly chart. To see how to draw this channel click here. I have created a parallel copy of this upper maroon trend line and pulled it down to sit right on the high of primary wave 4. Upwards movement for the last two candlesticks is extremely close to this trend line, and this is where a small correction began.
To see a prior example of an expanded flat correction for Gold on the daily chart, and an explanation of this structure, click here.
So far within minor wave C the highest volume is on four up days. This supports the idea that at this stage the trend remains up.
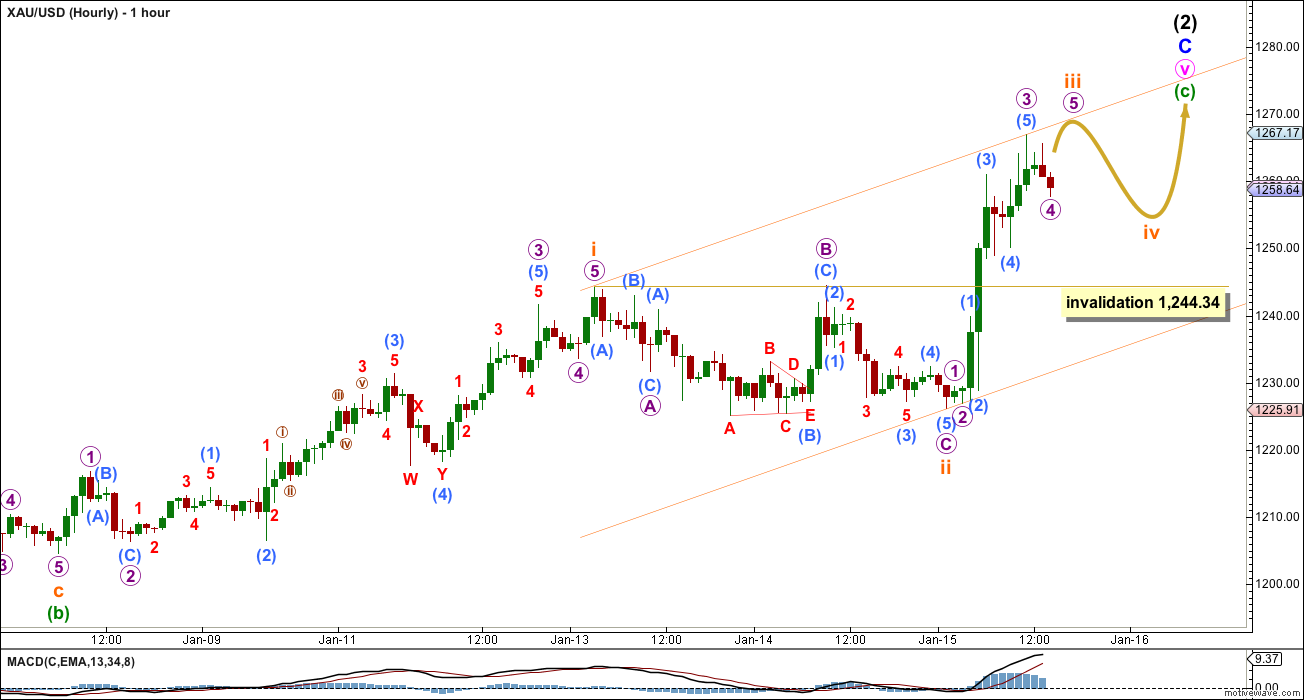
Minor wave C may be only subdivide as an impulse or an ending diagonal. With all the overlapping within it, an ending diagonal looks more likely, and it is now ending the final fifth wave up. The diagonal is expanding and the trend lines clearly diverge. Expect the final fifth wave of expanding diagonals to fall short of the i-iii trend line. Minute wave v is now longer than equality with minute wave iii which was achieved at 1,262.94. Minor wave C has moved above the end of minor wave A at 1,255.40 avoiding a truncation and a very rare running flat.
Within an ending diagonal all the sub waves must subdivide as zigzags. The fourth wave should overlap first wave price territory. The rule for the end of a fourth wave of a diagonal is it may not move beyond the end of the second wave.
The final zigzag up of minute wave v must be a clear zigzag on the daily chart, and must have a cursory count which is corrective. By this I mean 3, 7, 11… (adding multiples of 4 in series). So far it has a count of 5 which is impulsive (an impulsive count is 5, 9, 13…). It needs to complete a small shallow fourth wave correction, and then a final fifth wave up.
Within minute wave v minuette wave (c) has passed equality in length with minuette wave (a), and its structure is incomplete. Were it to continue until it is 1.618 the length of minuette wave (a) at 1,295 the maroon channel would be breached, and I do not expect it to be. Minuette waves (a) and (c) may not exhibit a Fibonacci ratio to each other, and the target for this upwards move to end would better be calculated at subminuette wave degree. I can only do that for you when subminuette wave iv is over, and it has not yet begun.
Intermediate wave (2) may not move beyond the start of intermediate wave (1) above 1,345.22. I have confidence this price point will not be passed because the structure of primary wave 5 is incomplete because downwards movement from the end of the triangle of primary wave 4 does not fit well as either a complete impulse nor an ending diagonal. If it is seen as a complete impulse there would be inadequate alternation between the single zigzag of the second wave and the double zigzag of the fourth wave correction, and there would be no Fibonacci ratios between the first, third and fifth waves within it.
My labelling of subminuette wave ii yesterday was wrong: micro wave A was shorter than I had it labelled as a single and not a double zigzag. Subminuette wave ii is still a regular flat correction, and micro wave B within it is a 102% correction of micro wave A. There is no Fibonacci ratio between micro waves A and C. Micro wave C ends below the end of micro wave A, and a truncation and a rare running flat was avoided.
When I look at subminuette wave iii on a five minute chart I see it beginning with at least two clear first and second waves labelled micro and submicro waves 1 and 2. It needs to complete the corresponding fourth wave corrections before a final fifth wave up. I expect current downwards movement is micro wave 4 which is incomplete. It may not move into micro wave 1 price territory below 1,229.06, but it shouldn’t get close to that point as it should be shallow because micro wave 2 was very deep.
Subminuette wave iii is now slightly longer than equality with subminuette wave i. It may not move too much higher so that it retains this ratio of equality. I expect micro wave 5 upwards to be relatively short. Because I do not know where micro wave 4 has ended, because it is incomplete, I cannot calculate a target up for subminuette wave iii for you.
I expect micro wave 5 to make new highs to complete subminuette wave iii, before subminuette wave iv begins.
I expect subminuette wave iv to be relatively shallow. It should show up on the daily chart as at least one red candlestick or doji so that the wave count has the right look at the daily chart level.
Subminuette wave iv may not move into subminuette wave i price territory below 1,244.34.
Draw a channel about this upwards impulse of minuette wave (c) using Elliott’s first technique, and redraw the channel as subminuette wave iii comes to an end: draw the first trend line from the highs of subminuette waves i to iii then place a parallel copy on the low of subminuette wave ii. Look for subminuette wave iv to end either midway within the channel, or to find support at the lower edge. The final fifth wave up for subminuette wave v may also end midway within the channel or find resistance at the upper edge.
I expect the final fifth wave up of subminuette wave v to be relatively short and brief, and should find very strong resistance at the upper maroon trend line on the daily chart. This maroon trend line may be the best way to see where upwards movement ends, rather than a price target in this instance.
This analysis is published about 3:35 p.m. EST.
NYSE is closed Monday I just checked
oh, that’s right!
so the next analysis will be for the Tuesday session of 20th January.
I knew there was a reason I wasn’t too concerned about a horrible connection in Fiordland this weekend when I made the booking….
What gold & silver trader really cares about NYSE??
Gold & silver trade for the regular Comex time on Monday.
(actually closes 30 mins early at 1pm EST instead of 1:30)
Comex is main price discovery market for Gold & Silver in US
Electronic Globex trading (small vol) opens 6pm Sunday, as usual but is closed monday afternoon.
The Hong Kong and London gold exchanges, which are major driver of Gold price, trade regular hours on Monday.
So Monday is an American holiday, however Canada is open.Can we only trade Canadian ETF’s (2x) or can we still trade US ETF’s too?
For futures traders, CME Globex halts trading for 5 hours on Monday from 13:00 – 18:00 EST.
So you’re OK to go Monday…
Indeed, historically there has even been a Crash in gold or silver on such days before.
This is something that stirred the “gold & silver are manipulated” conspiracy crowd.
ETF owners can buy and sell funds or stocks that are cross-listed in US and Canada.
For example, can buy CEF.A in canada, sell CEF in US.
Or buy PHYS on nyse and sell PHY.U on tsx.
MUX and GG in US; MUX and G in canada.
Etc, etc.
It’s also a cheap way to convert $$ between USD and CAD.
30 min with best fit channel
Including fib retracements. Hope we dont get caught up on 61.8% fib and we also have maroon channel resistance.
I also noticed GDX broke below 11:00am low so the sideways movement cant be a triangle?
Any feedback Lara?
have to leave my computer now…
From chart perspective PM sector has breakout to upside and traders are buying Miners NUGT, JNUG, USLV and UGLD.
These BO looks very compelling. Shorts be careful here.!!!!!!
Here’s a 20 minute with best fit channel.
candlestick must remain below line to 1:20pm and then it crystalizes to confirm 20min breakdown..
HI.
i don’t know about Elliot waves..
but something about harmonic patterns
i hope this could be helpful
I guess gold is making bearish ABCD in daily timeframe
starting from 1146.
and target for D to be completed at 1292…. and that could be the point where we will get the reversal..
from that point gold can got to 1133 (2.1618) or 3.1618 (1073).
I hope that is helpful and correct
Thanks
Switched over to 15min
We have a break… one full candlestick below line and not touching.
Will monitor on 20min and 30min for same
Im still getting FXCM feeds
hopfully this is it,!!!!!!!!!!!!!!!
loaded on dust at 12.85
FXCM in trouble. Hope that doesn’t affect Lara’s data feeds.
http://www.cnbc.com/id/102343957
Lara calls for inter 1 in primary 5 to be most likely to be an impulse. That would solve our problem for now…
Maybe there is a typo in your post. Intermediate (1) was over in early October 2014 per the first chart in Lara’s post yesterday. We are all debating the end of intermediate (2).
I added trend channel
2 to 4 with copy on 3
Need to break below..
Yell “DROP!” at your screen in unison
Thanks Jaf for posting chart.
It appears it is around 1276 and lower!!!!
Confirmation that it is over comes in at around 1269.67 (top of wave 1 within subminuette v).
Day is not over yet. Analysis in the middle of battle betwn Bulls/bears.
Yes SWZ has made the mess of wave counts.
With the mess going on with europe, are we going to see 1300s with this up trend? How is the wave count going to be? Hope Lara help sort out this soon .
This is my last idea… An extended 5th wave….
Note this is a 10minute chart
I believe Lara has said in the past that extended 5-th waves are not unusual for commodities. Another point is that it is unusual (per Frost and Prechter) to have multiple waves extend. In my opinion, wave 3 may have been large but was not an extension. Comments?
Gold is making a new high now at 11:34 am
Yrs, $1282 so far. Acting like maroon trendline not even there. A close above the line would be very very concerning for the entire count especially with inverse H&S targeting $1345. Looking more carefully, maroon trendline looks to sit around $1278
Lara-
Is int (2) C wave over? It met the target today at 10 AM.
How about Fib duration point of view?
We all appreciate your brief comment.
Nope, but we are in 5 of subminuette 5.
this is exactly what my analysis will be focussing on over the next few days
Gold right now came back up to 1,278.28 at 11:26 am just 50 cents of the high at 10:13 am and stopped at a trend line there and is touring down now.
Her video and analysis for Gold last night and for GDX this morning has Lara’s description that subminuette iii was over last night and sub. iv as “over or half over” and that sub. v would be little, short, with a short breakout up.
That’s your description confirmation. Maybe someone can give a count confirmation and we could wait and see if anything else happens until 2 pm Lara shows up. Meanwhile I’m in DUST.
Can anyone confirm wave (2) is done now? Ready for the fall to bottom?
Wow! Lara, spot on again. You rock!!
I had bought some DUST at the close last night and expected gold to drop during market hours and sell DUST and buy GDX on the way up. Because Subminuette wave iv and v happened so fast I ended up selling my DUST at 9:40 am and then bought the same amount of DUST back at 10:12 am 1 minute before the peak for $1 less so I came out ahead on that trade.
I have my DUST now and no other investments and will wait for Lara’s analysis. She can confirm the gold peak and also clarify if any trend channel confirmation and price confirmation for official Elliott Wave confirmation of a trend change and that intermediate wave (2) has ended and intermediate wave (3) has begun. I can always buy more DUST then even though it will be much more expensive.
It appears that Gold peaked at $1,278.75 at 10:13 am EST, which was only $1 from Lara’s original projected peak she had for gold since Fall 2014. Lara had been mentioning at least 1,262.94 for the high and in Thursday nights analysis and in the video she said it is best to project where gold would cross the upper maroon weekly trend line on daily chart. That maroon trend line point appears to be at $1,280. Unless gold does an extra burst up, it appears that $1,278.75 is the gold high to end subminuette wave v of minor wave C of intermediate wave (2) of Primary wave 5.
The multi day subminuette wave iv correction and subminuette wave v sure went lots faster than expected only about half a day. Subminuette wave v was to be a “final little fifth wave with a short breakout up.”
This is what I have…
That’s how I counted it as well. We should get final confirmation that the peak is in with movement below 1262.80 (or 1262.70 from what I was looking at).
Sold my longs this morning, and I’ve been going short for the last hour.
Final 5 of subminuette v possibly underway.
….either that or upwards movement is complete. I can count a 5 wave structure, but am not 100% confident.
I think the top may be in now. We needed some fireworks to end intermediate 2. Can someone more knowledgable please confirm the subdivisions within subminuette v?
I think thats top for this sub wave count. Hope the bigger picture (counts) are correct. Thats yet to be seen
How much further up? Is short really the right position now? 1277 rising?
Haven’t really seen a blow off top yet in GLD or the miners.
I think it’s going higher
Almost to old high of Lara 1281 in sight!!!!
$1274.50 so far, must reverse here to avoid blowing up entire wave count
So now were a bit past that, do you think the count is in doubt?
Not yet, little early to throw in towel
Is anyone gonna get short?
Already a little bit short.
almost
Yes bot NUGT Jun 15 PUT at top
Next will be gld Jun PUT and vertical call spread
I have maroon at 1270.7
Subminuette v will make new highs at maroon channel
We were almost finished subminuette wave four ias per Lara in GDX update for GDX and Gold waves, wake up!
Hi guys,
Anyone can check wich level, the price will touch the maroon trend on the daily chart today ?
Thanks
Approximately 1275
Lara wrote this: I expect micro wave 5 to make new highs to complete subminuette wave iii, before subminuette wave iv begins.
Is that what is happening now to complete the sub wave iii?
Was it iii or v? A bit confused… US market does not look too good. Will it continue to go up more higher?
subminuette iv sure look like a triangle and if my count is correct…it could end this morning and a brief sharp thrust would follow. It may correspond to a reversal in the SPX as well.
Chapstick
Is wave iv complete? AND gold is moving to high to int (2) C?
Is wave v done already? That was quick.
I think it’s either that or Intermediate Wave 2 is or close to completely done. That is the question
First casualty of SWZ action:
Casualties From Swiss Shock Spread From New York to New Zealand
. Global Brokers NZ Ltd. said losses from the franc’s surge are forcing it to shut down. IG Group Holdings Plc
estimated an impact of as much as 30 million British pounds ($45.5
million) and Swissquote Group Holdings SA set aside 25 million francs
($28.4 million). Read More:
http://www.bloomberg.com/news/2015-01-15/new-zealand-currency-broker-closes-on-losses-after-swiss-shock.html
Gold is in wave iv and it needs to be shallow. Lara wrote: Look for subminuette wave iv to end either midway within the channel, or to find support at the lower edge.
Midway has been achieved already. Wait for COMEX boyz to do their usual take down of gold in first hour of market opening.
I have noticed time of the day is important.
3xetf tops / bottoms around 2L30 to 3:30 pm. On COMEX most damage is done by 10:30 and then it is quite trading.
Just issued – GDX Elliott Wave Technical Analysis – 16th January, 2015 Use the trend channel for a revised high target.
Richard
I always worry about what am I missing from conversation here on board. I do not have FB account. I hope any one posting FB page I will miss them.
I don’t use Facebook. When I want to trade or get update I scan this page. Does that mean I will miss something?
No worries, I don’t think so.
Are the miners showing signs of weakness? Gold made new highs today and the miners did not. GDX was stronger than GDXJ. This is not a sign of strength for the miners. While it is highly likely that GDX and GDXJ will achieve higher highs to complete their EW patterns before a downturn, the new high may be only marginally higher than the high on 01/13. If this is the case, due to price erosion, the highs may already be in for the 3x etf’s, NUGT and JNUG.
if Gold drops a lot Friday I’ll buy some GDX again, if not I may end up waiting for Lara’s report Friday to decide whether I buy GDX again at all and when maybe before Friday close or Monday. Friday and Monday may be unusual from the aftermath of Switzerland’s central bank stunning markets by scrapping its long-standing cap on the strength of the currency. I sold my GDX today and bought a little DUST cheap at the close. I will prepare for a change in direction in investing from up to down in DUST once we have a confirmed top and see if Lara gives any trend change confirmation channels and trend change price confirmations for intermediate wave (3) down, down, down.
This is looking more like subminuette iv and I think subminuette iii ended at $1267. Never got the quick pop for micro 5 above $1267 so Lara’s wave count looks disproportionate if micro 4 is still in progress….just my thoughts. Gold could top on Monday.
I was thinking the same thing. There was a small correction that was similar to the 2nd in length (in terms of time). It was also an appropriate %.
I’m looking now at the hourly chart and it does look like this sideways movement is subminuette wave iv already. So subminuette wave iii should be over, and it was just very slightly longer than subminuette wave i.
Lara, thanks for that clarification that subminuette wave iii is over and iv started.
You were one of the few since last fall that forecast gold would go to 1,280 area and now you are one of the few forecasting gold will go down, let alone drop below November low, let alone drop to $957.
Keep doing what you are doing with Elliott Wave, you are doing it exceptionally well.
You set the bar very high in EW forecasting
Thanks for the reply Lara. We all appreciate your extra effort at this critical juncture. It’s maybe too early to tell, but sub iv is starting to look like a triangle to me with a,b and possibly c complete. That would fit well with the small amount of room left for sub v.
You mention upwards movement could be over tomorrow already.
Are you referring to Subminuette iv or sub. v being over Friday? Thank you Matt.
Both could be over today, if this is indeed some kind of triangle. Sub v may be very quick and short because of that.
Thanks Lara for clarification. Great Job. No one I know does it like you that I know.
My confidence in gold price projection has increased because of your excellent work and understanding of complex EW.
Lara expects the final fifth wave up of subminuette wave v to be relatively short and brief…….,
So you think it will happen Monday after Friday;s one day red candle???
I labeled Lara’s waves on gold chart and most minute waves transform in to a gold head and shoulder. Any correction welcomed.
Below is a head and shoulder with Ewaves in red for gold.
After this wave iv correction GDX is looking better and better along with GDXJ. for wave v play.
After seeing the HnS BO of gold today here is another HnS for GDX. Similarly there is one for GDXJ both looking bullish and ready to rock!!!
Shahab / Davey
Difficult to pick agree noting a mere 10% drop in bullion price on week of 29th Oct 2014 resulted in a 75% in in DUST – but the gold miners have a had a good flogging for a long time now so there’s not much life left to beat out of them actually. DUST calls and NUGT puts !!
I did a historic price study calls do not yield any better result. Put option does.
Matthew, I compare gold and GDX over time (1 year, 6 months, 3 months etc). Yes miners have huge short-term spikes compared to gold but those spikes tend to settle down somewhat over time. Just my thoughts and I am certainly not a pro at EW or trading.
So what is the price of dust going to be when gold hits 956???
I was considering same. Rough figures: gold down 25%, miners usually move higher and lower than gold so maybe gdx at minus 35% puts dust at maybe 31. Lots of guessing in that figure.
Another way to play the wave 3 and wave 5 is to buy long term PUT option on NUGT or JNUG when wave (2) C ends. With daily price decay option shall yield good return.
Just take a small position and make the best preparation and buying decision you can and watch Lara chart daily and get out at the major correction waves on the way down like intermediate wave (iv) get out for that one,
Shahab
First let think of what the NUGT price will be when gold is completing wave (2) C.
Just think how trecherous was the wave 2 c. one milestone at a time.
Countertrend intermediate wave (2) was difficult to trade and the b wave portions of that even more difficult. Other waves not as dangerous as more predictable to forecast and trade
Richard
On the way down to 950+ do you think any other waves will be as bad as int (2) (A,B,and C)?
Gold has many waves to go thru and the big one is wave (4) after wave (3) is done.
Intermediate wave (4) I would avoid.
Then I would get out close to the bottom as don’t want to spend a lot of time in choppy waves finding last minor difference to exact bottom as with 3X ETF there is slippage expenses when choppy.
After having gone through intermediate 2, I wholeheartedly agree! Int 3 may end close to $1000 (1.618 x Int 1). Good enough for me! Wouldn’t want to sit through several extra months of choppiness during int 4 just to get an extra few bucks.
I just bought a small amount of DUST 1 minute before close.
My assessment is subminuette wave iii may peak overnight. Then subminuette wave iv closes down one to three days. Then subminuette wave v to peak and end short term rally next week.
“A small shallow fourth wave correction should show up on the daily chart as one to three red candlesticks or doji.” “Subminuette wave iv may not move into subminuette wave i price territory below 1,244.34.”
Did the same thing, will buy more in the morning if dust goes lower.
Plan same here. Hope it works out.
Richard, that sounds correct, will take a strong heart to make those short-term buys and sells.
What do you see as price for GDX at subminuette iv low? Price for GDX at subminuette v peak?
my 2 cents and a random observation – AEM and ABX both stalled – AEM failed to close over 200 MA 3 times in the past week, and ABX failed to close above its 50MA twice now with this upsurge in Gold. That’s why I think GDX goes down from here tomorrow.
Based on Lara’s projection GDX may go down Friday so I look to buy GDX near gold low during Friday. Important to buy miners near gold bottom as Beta co-efficient for miners provides a bigger change in momentum sell DUST fast near it’s high and buy GDX fast within minutes of it’s low as sentiment swings fast and so does price of miners and when the knife stops falling then many will start buying cheap so you want to be one of the fastest one to buy low while making sure you got it right.
If GDX doesn’t drop enough Friday I may buy it as low as possible Monday if gold is down and hasn’t peaked yet. I may end up waiting for Lara’s update Friday before deciding to buy GDX Friday or Monday as must be sure of your buy because weekends are risky to hold investments.
Nerves of steel and good timing and a lot of preparation and watching the one investment I am in the watching it the whole day almost every minute as this is my income.
Hard to project a GDX price next bottom Friday and next top next week. Just at next gold low for the day Friday I am looking to sell my DUST and buy GDX and hold until sell GDX at early next week high.
Wow, and I thought I was an addict. I’ve been investing and swing trading in gold for over 16 years… I watch it every day…. But watching it every minute….? I gotta hand it to you, that’s tough… even I would go squirrelly.
Lara, do today’s events change your gdx target?
No. It looks like for GDX the target for minuette wave (iii) was not met. GDX looks like its now within minuette wave (iv), which should end soon if its not over already.
GDX now needs only the final fifth wave up to complete, as does Gold.
The target for GDX may be too optimistic.
Redraw the channel about the up move for GDX: from minuette waves (i) to (iii), then a copy on (iv). Look for (v) to reach the upper edge. When that channel is breached that provides confirmation that minute wave c is over, so at that stage minor wave 2 should be over.
I’m driving from Wanaka to Te Anau, into Fiordland tomorrow. I have to check out early. If I have time I’ll post a chart for GDX for you all. It may be chart only, no text, so no explanation of my target calculation. But I think a chart is all most of you need anyway.