
This third wave has blitzed all targets so far, and the structure is incomplete.
Summary: The next possible point for this to end is about 44.43. A new high above 57.14 would provide price confirmation that the downwards fall is over for the mid term.
Click on charts to enlarge.
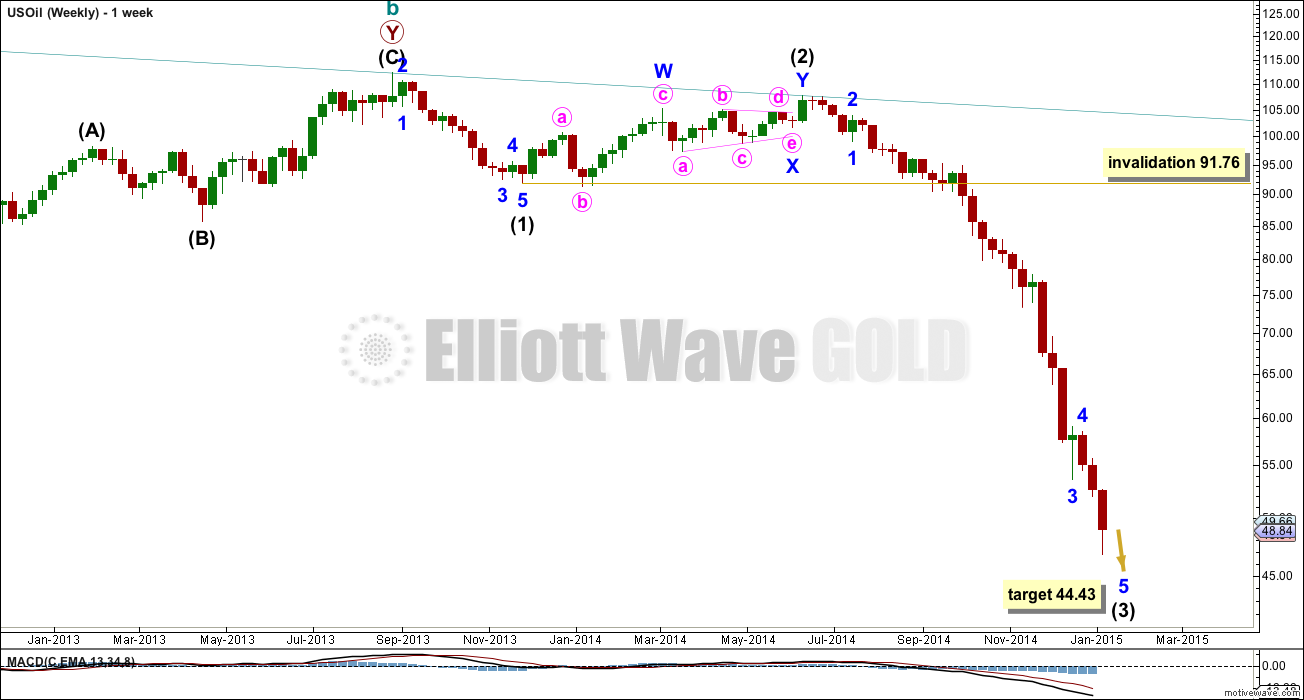
Intermediate wave (4) to come may not move back into intermediate wave (1) price territory above 91.76.
Intermediate wave (3) is not finished, but it is getting very close.
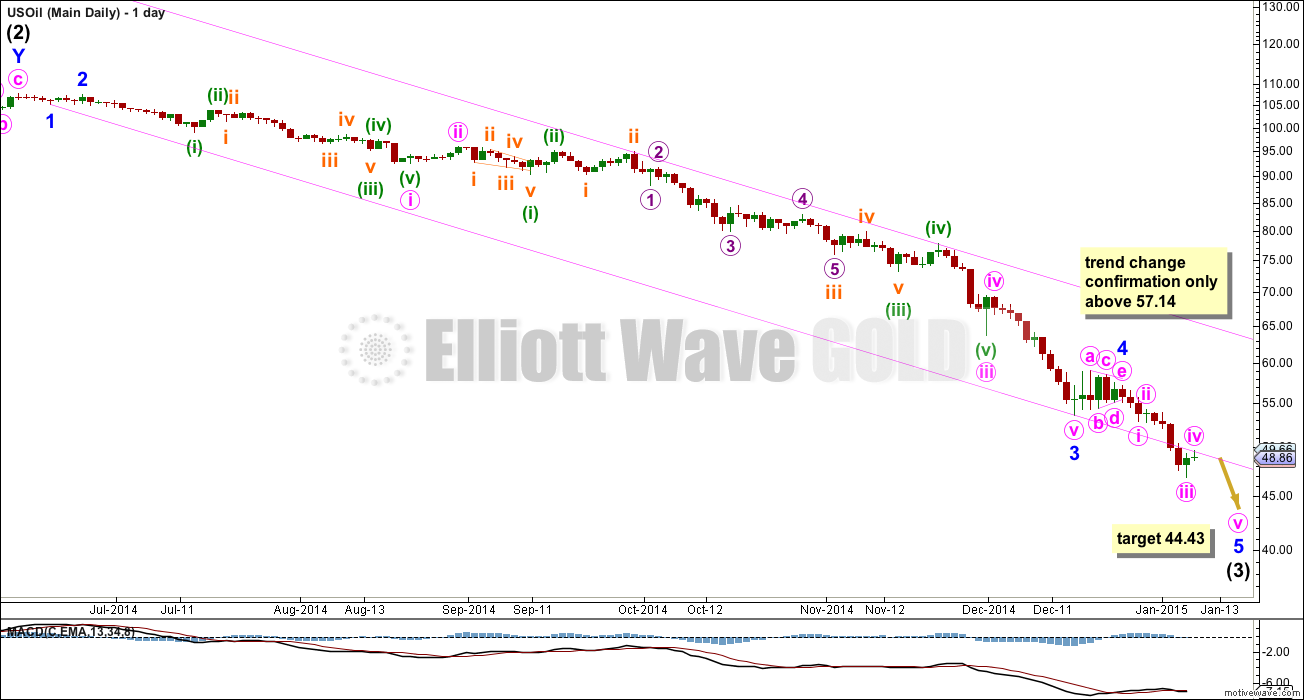
Within intermediate wave (3) a recent triangle for minor wave 4 indicates that the final fifth wave may be unfolding.
At 44.43 minor wave 5 would reach 0.236 the length of minor wave 3. Because minor waves 1 and 3 do not exhibit a Fibonacci ratio to each other I would expect minor wave 5 to exhibit a ratio, the only question is which one of several it will be. This is what is making target calculation so difficult.
Only a new high above 57.14 would indicate that intermediate wave (3) is over. This point is the start of minor wave 5. A new high beyond its start may not be a second wave correction within minor wave 5, and so at that point minor wave 5 would have to be over.
The channel drawn here is a best fit, and now may not be useful to show when downwards movement is over. The price point provided should be more useful.
Hi guys. My best guess is that Intermediate 3 has bottomed at 44.20 (as Lara predicted correctly). We are now most likely in a long drawn out Intermediate 4. It appears that Intermediate 4 is unfolding as an expanded flat. Wave A = 44.20 to 51.27. Wave B is incomplete. It still has more to drop this coming week, probably to as low as 42.90. I judge the light sweet crude market is turning bearish because (a) PSAR just turned bearish, and (b) both RSI and Stochastics are approaching oversold but not bottoming yet. Wave C should bring us back for a 2.618 retrace towards 60. This ties in with Lara’s report that 57.14 marks the confirmation for Wave 4.
Other options I am considering are that
(1) Friday’s low of 45.21 is a low point and WTI starts turning up from there, so the C-wave may be starting. However, that would leave us with a very shallow 4th wave with almost no alternation with Wave 2 (both being zig-zags). Moreover, market sentiment does not currently support this view.
(2) Intermediate 4 is a very quick movement, and is over at 51.27. This is probable as the ensuing wave structure tried hard to be bullish but lacked conviction. I judge the expanded flat as being the more likely scenario.
There are a few other possibilities but I reckon it is not worthwhile to pursue them as it is not that lucrative to trade 4th and 5th waves due to the poor risk-reward ratio. I am sure Lara would update at the appropriate time when the movement becomes clearer.
It seems that the minute wave 2 is about to be completed. The question remains open which wave count of the 3 possible counts is correct.
In my opinion the most likely is that the minute wave 2 is triangle. That would imply that it is really wave b of the larger triangle. The reason is that triangles seldom occure as waves 2. It is much more likely to see them as waves 4 or b.
Anyway, the next leg up should be at least 7$ in lenght. If it is not triangle, than it could be 11.3$
Please note I am using crude light futures.
Lara can you state your opinion?
Hi Lara great call for wave 3 to end around 44.43. Oil made low at 44.20.
Once wave 4 ends can we request an update in oil.
Thanks in advance.
Not interested in trading the corrective wave 4.
Is it begining of the major correction? Wave 4? Now buying on lows?
Future ahead not so good.
Wave 4 is very advanced and it is now easier to see the structure. It is again triangle (I am looking at Cl.f).