
Downwards movement was expected.
Summary: The short term target is 1,198 – 1,193, and should be met within the next 24 hours. While this fifth wave is underway corrections should find resistance at the lower edge of the pink base channel, and at the upper edge of the Elliott channel on the hourly chart. The trend remains down.
Click on charts to enlarge.
Main Daily Wave Count
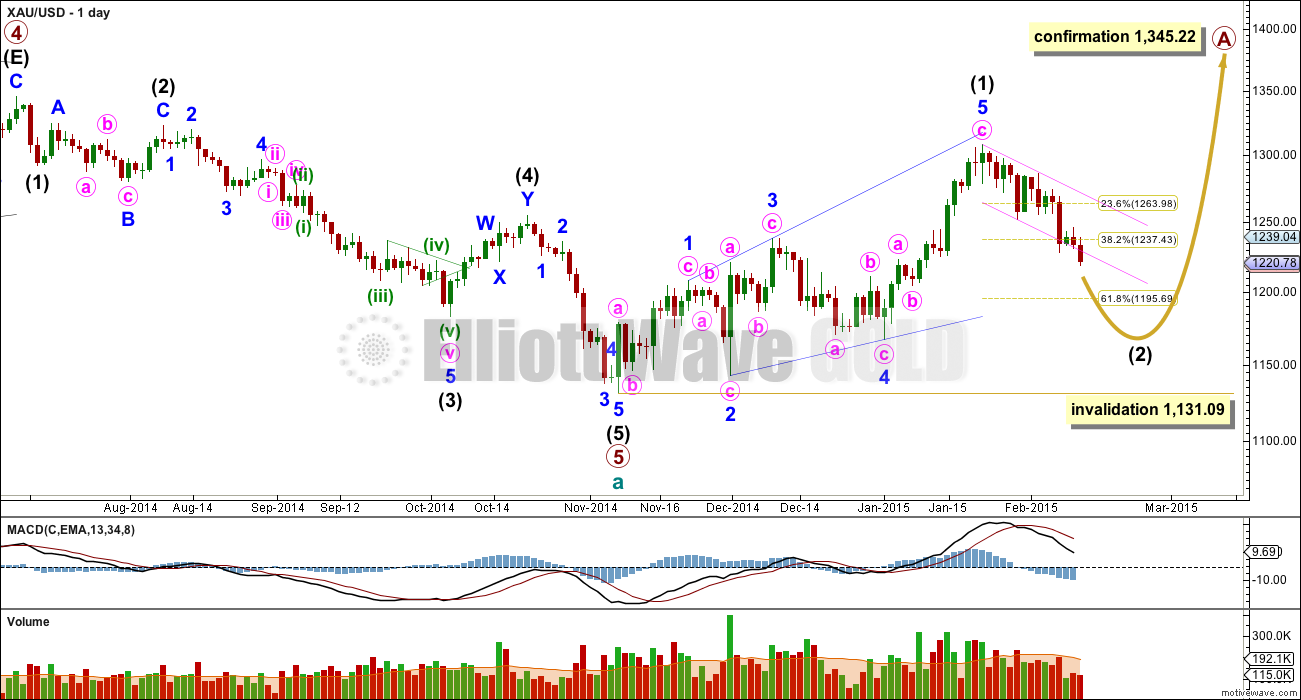
At this stage I judge this main wave count to have an even probability with the alternate below. I will let the structure of downwards movement, and momentum, tell us which wave count is correct over the next few weeks. At this stage they both expect more downwards movement so there is no divergence in the expected direction.
This wave count sees a five wave impulse down for cycle wave a complete, and primary wave 5 within it a completed five wave impulse. The new upwards trend at cycle degree should last one to several years and must begin on the daily chart with a clear five up.
The first five up may be a complete leading expanding diagonal. Within leading diagonals the second and fourth waves must subdivide as zigzags. The first, third and fifth waves are most commonly zigzags but they may also be impulses. This wave count sees minor waves 1, 3 and 5 as zigzags.
Leading diagonals are almost always followed by deep second wave corrections, sometimes deeper than the 0.618 Fibonacci ratio. This wave count expects a big deep correction downwards, and it should subdivide as a clear three on the daily chart (the alternate below expects a five down).
My biggest problem with this wave count, and the reason I will retain the alternate, is the structure of intermediate wave (2) within primary wave 5. This is a rare running flat but the subdivisions don’t fit well. Minor wave C should be a five wave structure, but it looks like a clear three on the daily chart. If you’re going to label a running flat then it’s vital the subdivisions fit perfectly and this one does not. This problem is very significant and this is why I judge the two wave counts to be about even in probability.
Intermediate wave (5) looks like a zigzag rather than an impulse, and has a corrective wave count. This is also a problem I have with this wave count.
Intermediate wave (2) is most likely to subdivide as a zigzag, which subdivides 5-3-5 at minor degree. When this 5-3-5 is complete then how high the following movement goes will tell us which wave count is correct.
Intermediate wave (2) of this new cycle degree trend may not move beyond the start of intermediate wave (1) below 1,131.09.
From January 23rd onwards, since the expected trend change, volume is highest on down days. This supports the idea that we may have seen a trend change and the trend is now down. Volume for Silver is even clearer, with a big spike on the down day there for 29th January.
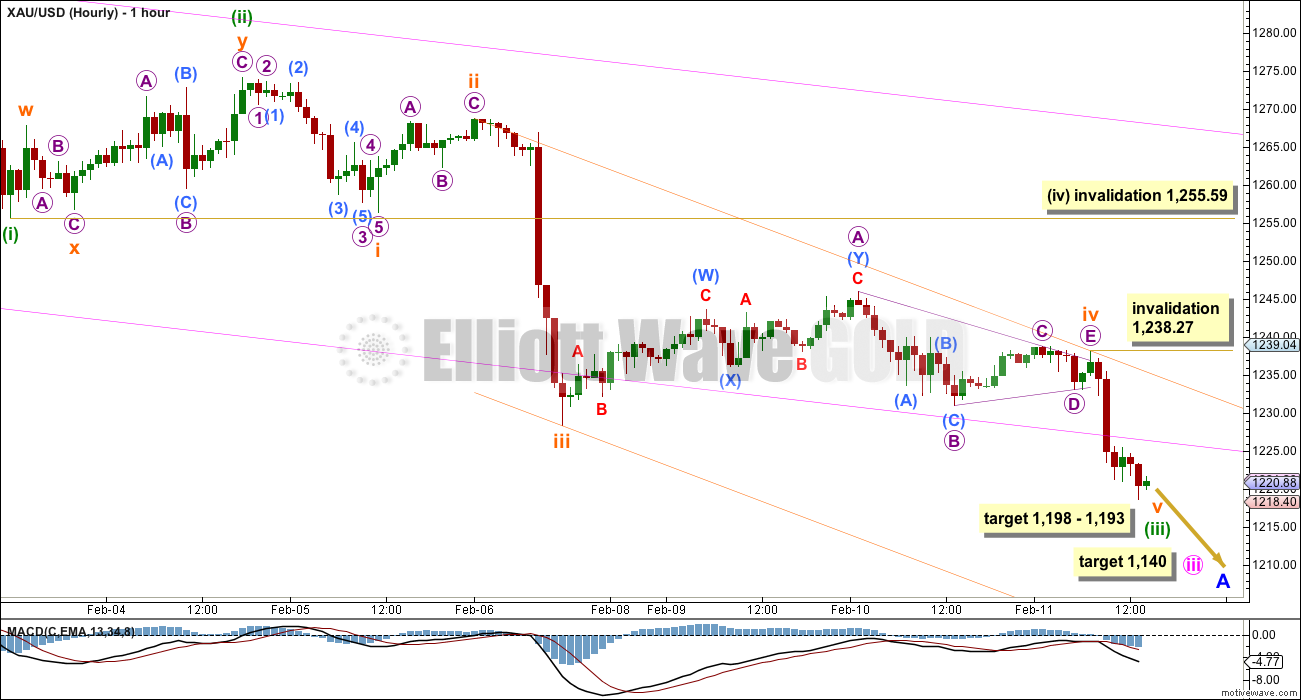
Sideways movement turned out to be a regular contracting triangle for subminuette wave iv. There is now perfect alternation between the deep zigzag of subminuette wave ii and the shallow triangle of subminuette wave iv. Triangles are normally more time consuming structures than zigzags, so the wave count now has a more typical look.
At 1,198 subminuette wave v would reach equality in length with subminuette wave iii. At 1,193 minuette wave (iii) would reach 2.618 the length of minuette wave (i). This gives a $5 target zone for this fifth wave to end.
If this target is wrong it may be too low. Sometimes fifth waves following triangles are more brief and weak than otherwise expected. At this stage it looks like subminuette wave v is moving towards its middle, and looks like an incomplete five wave structure. When it is done it must be a clear five on the hourly chart.
Now that price has managed to break through support at the lower edge of the pink base channel it should remain below this trend line. Along the way down upwards corrections may find resistance at this lower pink trend line.
Draw a channel about minuette wave (iii) using Elliott’s second technique: draw the first trend line from the ends of subminuette waves ii to iv, then place a parallel copy on the end of subminuette wave iii. Along the way down upwards corrections should find resistance at the upper edge of this channel. Subminuette wave v may end about the lower edge of this channel.
When this channel is subsequently breached by upwards movement that shall provide trend channel confirmation that minuette wave (iii) is over and minuette wave (iv) is underway.
While subminuette wave v unfolds no second wave correction may move beyond its start above 1,238.27.
When subminuette wave v is complete then the following correction for minuette wave (iv) may not move back into minuette wave (i) price territory above 1,255.59. Because minuette wave (ii) shows on the daily chart I would expect minuette wave (iv) to also show on the daily chart. It may last one to four days, depending on what structure it takes.
The mid term target for minute wave iii is now only at 1,140. This target may be one to two weeks away.
Alternate Daily Wave Count
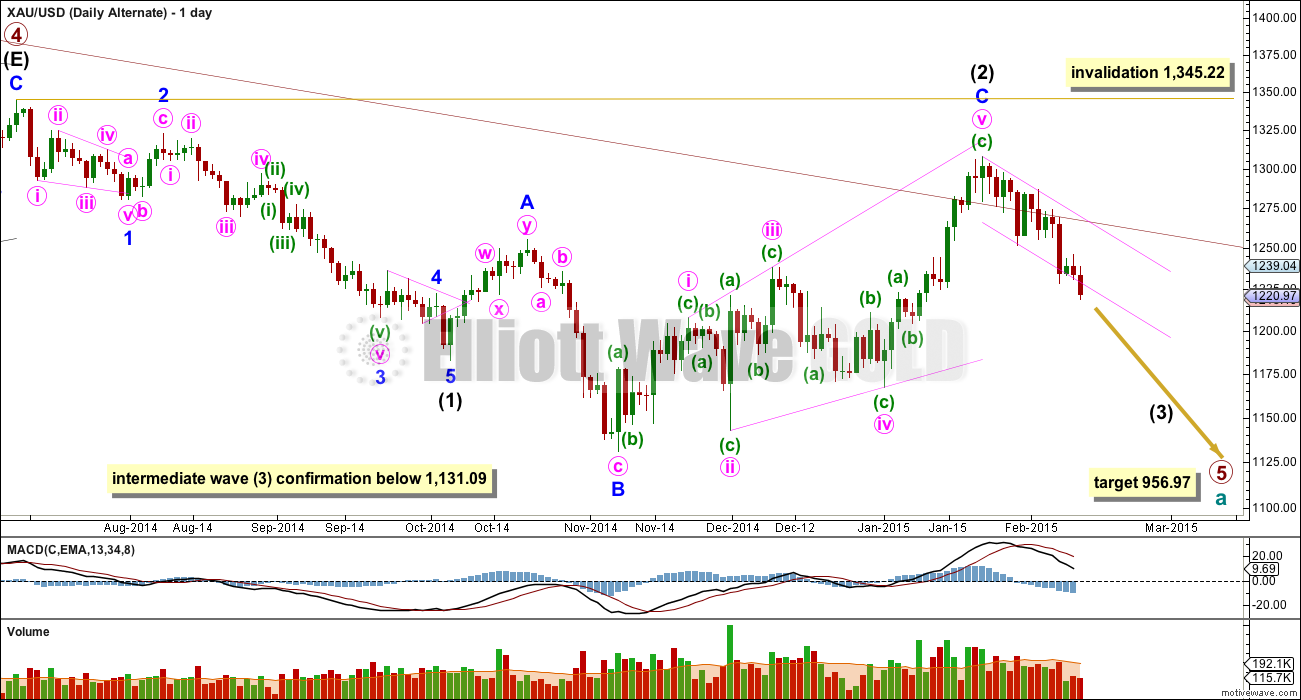
The maroon channel about cycle wave a from the weekly chart is now breached by a few daily candlesticks, and is now also breached on the weekly chart by one weekly candlestick. If cycle wave a is incomplete this channel should not be breached. For this reason and this reason only this wave count, despite having the best fit in terms of subdivisions, only has an even probability with the main wave count. It will prove itself if we see a clear five down with increasing momentum on the daily chart.
Draw the maroon trend line on a weekly chart on a semi-log scale, and copy it over to a daily chart also on a semi-log scale (see this analysis for a weekly chart).
Within primary wave 5 intermediate wave (1) fits perfectly as an impulse. There is perfect alternation within intermediate wave (1): minor wave 2 is a deep zigzag lasting a Fibonacci five days and minor wave 4 is a shallow triangle lasting a Fibonacci eight days, 1.618 the duration of minor wave 2. Minor wave 3 is 9.65 longer than 1.618 the length of minor wave 1, and minor wave 5 is just 0.51 short of 0.618 the length of minor wave 1.
Intermediate wave (2) is an expanded flat correction. Minor wave C is a complete expanding ending diagonal. Expanded flats are very common structures.
This wave count has more common structures than the main wave count, and it has a better fit.
For this alternate wave count the diagonal is an ending diagonal for minor wave C. Within an ending diagonal all the sub waves must subdivide as zigzags. The fourth wave should overlap first wave price territory. The rule for the end of a fourth wave of a diagonal is it may not move beyond the end of the second wave.
Although Gold almost always adheres perfectly to trend channels, almost always is not the same as always. This wave count is still possible. The trend channel breach is a strong warning that this wave count may be wrong and we need to heed that warning with caution at this stage.
A new low below 1,131.09 would confirm that a third wave down is underway.
At 956.97 primary wave 5 would reach equality in length with primary wave 1.
Intermediate wave (2) may not move beyond the start of intermediate wave (1) above 1,345.22. If this invalidation point is passed this wave count would be fully invalidated.
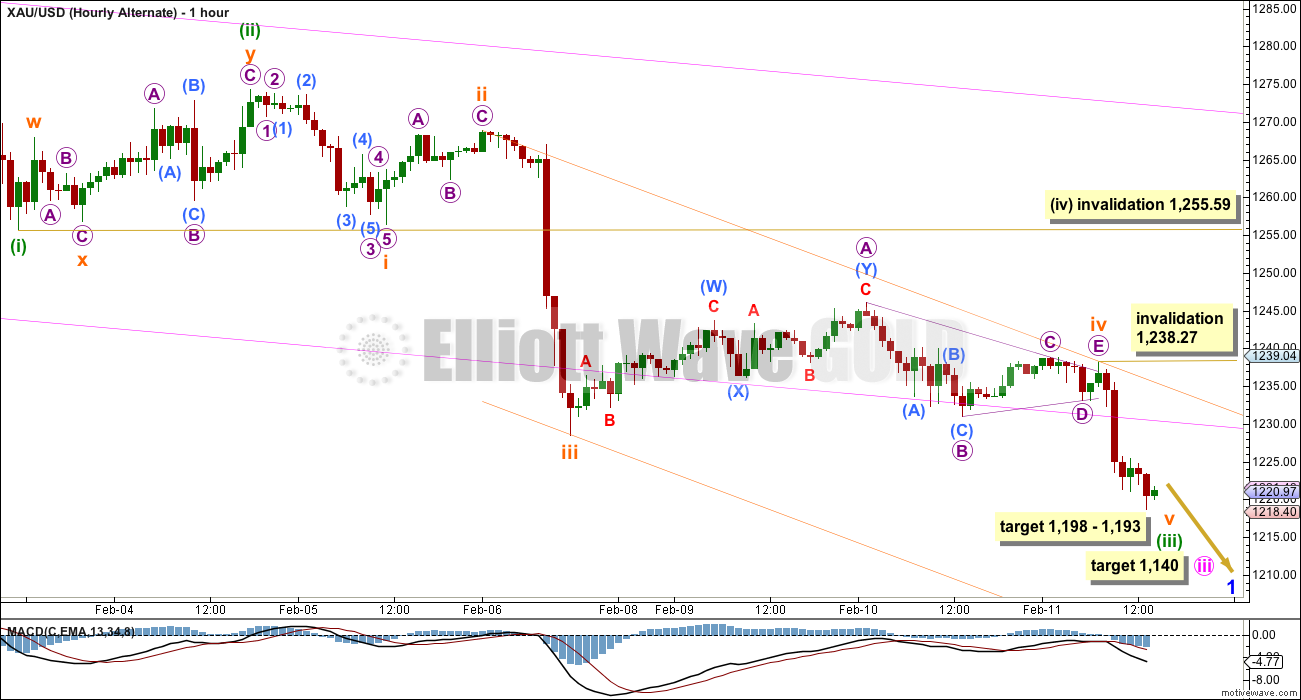
The short term structure, targets and invalidation points are still the same for both wave counts at this stage. They probably won’t diverge for a few weeks.
This analysis is published about 02:52 p.m. EST.
There’s no way I’m going to do that.
I just… don’t.
Feb 12th report posted
Lara , if you are still interested in this “S&P/TSX Global Gold Index” it is TSE:TTGD on google finance with historical data . I could possibly email the data to you in your format if too difficult to download . If you really want it .
Lara mentioned she needs it on Yahoo Finance. I checked it yesterday and it looked like the volume was too low.
Volume shows as being higher than GDX …
I don’t think the source matters .
Elliott Wave Gold Mod Jaf • a day ago
…
I get my data for gdx from “yahoo finance”. I looked up $sptgd and can’t find it there. If yahoo finance have this data and you could provide the symbol they’re using I’ll take a look and do an EW analysis on it for you. If it is as I suspect easier to analyse (greater volume would do that) then I can produce charts about once a week for you….
Yes I read that already yesterday . That doesn’t say it must be from yahoo finance .
You are right good luck.
S&P/TSX Global Gold Index (TSE:TTGD) is an index and as such has no volume, it’s tracking and trade-able ETF is XGD.TO with volume of 807 thousand per day. NYSE Arca Gold Miners Index (XX:GDM) is an index and as such has no volume, it’s tracking and trade-able ETF is GDX with a volume of 58 million per day
An index is comprised of components with volume and this is the volume that is reported .
Alex, I ask because i want to learn, not to debate a point, you probably have knowledge I lack.
Where is index volume (composite volume of underlying stocks) reported? Would you point me to site where NYSE Arca Gold Miners Index and S&P/TSX Global Gold Index volumes are reported ?
Motive Wave software takes Google data .
Hi Alex, yes, please do email me a .csv file. If the data is formatted correctly for Motive Wave then it should be easy to import.
I mentioned Yahoo Finance because their data is nicely formatted, it’s quick and easy for me to import into MW. Its also quick and easy for me to find and do myself.
But I can import data from any source in either .csv format, or MetaStock file format.
Are we now in the 5th wave of subminuette v of minuette (v) and on target for 1,998 – 1,193 range or might be too low target?
So, everyone, is this thing finally moving TOWARD our short-term target??
it does look so
Whew!
Gold starting decline 9:52 am $2 in 1 minute
Hi guys. Piotr asked a legitimate question 2 times and everyone seems to digress towards the longer time frame. Piotr is addressing today’s trade which Lara said would most likely drop towards 1198/1192 areas. One possibility that fits this is that sub-minuette wave 4 ended at 1238 as given by Lara. Wave 5 is a double zig zag with micro w ending at the low of 1217 yesterday just after the market closed, followed by micro x at 1233 which is the spike up. Currently we are in a 5-wave decline towards 1198. When trading commences, we will see if this immediate term scenario is correct. Happy and prosperous trading to all.
I don’t have a clear picture of what you are saying but this “Wave 5 is a double zig zag” is not possible since wave 5s have to be impulses .
Hi Alex77. I would have thought that Wave 5 is an impulse. I think you may be right. In this instance, then micro 1 is at 1217, micro 2 is at the spike. We are now into micro 3 but momentum has not increased yet. If it does, the 5-wave impulse is correct. In both instances, ZZ or impulse, the end point is still around Lara’s target.
Thanks a lot Tham. i believe you meant wave micro 2 of wave subminuette 5 saying it is WXY. Please confirm if what i depicted is what you meant.
Hi Piotr. What I meant is that Wave 5 is a 5-3-5 double zig zag. W is over at the point you labelled submicro 1 (just before your W). Wave X is where your Y is.
interesting. This would mean that gold is in ending diagonal. Hope Lara will sort it out.
I think I did. But I’m not so sure you’ll like it.
Heh, sure i would rather appreciate further move down. But it was too suspicous and I closed positions anyway. your newest analysis came supportive. Thanks.
Fifth waves must subdivide as five wave structures.
There are only two five wave structures possible; impulses or ending diagonals.
Wave 5 cannot subdivide as a double zigzag.
Gold only hit high of 1,233.02 at 3:30 am it didn’t exceed invalidation point you mentioned?
I like to think that gold may still drop below today’s low of 1,220.10 at 10:18 am, which I am hoping was wave 5 of subminuette wave 3 of minuette wave 5 still heading down during market hours today to 1,199 – 1,193 target range or Lara mentioned that may be too low.
What are odds that 5th subminuette wave is already over?
lara, i think it’s important that you do not allow the peanut gallery to influence your analysis. please stick to the theory and try to ingore the hopes and dreams of the punters
Gold’s monthly chart is just about show the breakdown to lower lows. Price needs to breakout of triangle and below the neckline extension from 2008 -2009 HnS.
Lara wrote about which count is correct. It may get decided not based on 1130 price only but: ” When this 5-3-5 is complete then how high the following movement goes will tell us which wave count is correct.”
Was this spike last part of the 2nd micro wave? 0,764 fibo tested, trend line tested.
That’s Main Target which has started from 1131 low… Make a high at 1236..then retraced 0.618 to 1167 than moved slightly higher than1.27 at 1307…….. Now it should move minimum 2.1618 at 1143… and maximum at 3.618 to 1180
Within this main chart on daily i am expecting this… it can correct to 1250 region and it will be confirmed there. The lower target on both charts is same at 1145
Waseem
Short term Lara is seeing move down to about 1198 before moving back up.
Are you seeing short term target at about 1220 before moving back up? Are you seeing short term low of 1220 is already here and now move is up towards 1250?
I was expecting a bounce from 1215…. and still expect a bounce. if it breaks 1215 then from 1200-1204.. but I am expecting it from 1215
Thanks. Very interesting. Lara’s target about 1198 but said that target could be to low. Your primary target is 1215, secondary target 1200.
Two sets of targets, very close, by two different people using two different methods.
Thanks
Lara,
Help please, could you clarify what may be a discrepancy on long term down confirmation points between gold and GDX.
If gold drops to 1,198 – 1,193 Thursday then GDX may cross below 20.42 the confirmation point for the main wave count the last 3 GDX analysis that would probability wise have GDX heading for long term down target of 14.13.
However, Gold would have to cross below 1,131.09 to confirm the daily alternate wave count with gold long term down towards final gold bottom of 956.97.
We have about a $65 difference, 1196 – 1131, between GDX and gold long term down wave counts.
Lara I know you have mentioned that gold follows EW analysis almost to the letter, yet GDX doesn’t follow EW analysis as closely, an important reason is the big difference in volume between gold and GDX.
Lara could your next Gold or GDX analysis please clarify this $65 difference and/or GDX confirmation point so we are clearer on how to trade the miners if GDX confirms long term down this week. I hope I have presented this properly for you. Thank you for your help.
Well said Richard. Lara maybe also discuss the fib 50% retracement of Gold from its high and the target for this movement, if applicable. If the fib retracement at 50% is 961.85, would this increase the probability for the alternate wave count? GDX wave count also supports the alternate for Gold if we have confirmation of a trend change below $20.42. Thanks.
Firstly, 50% is actually not a Fibonacci ratio. Fibonacci ratios are ratios which are derived from dividing one Fibonacci number in the Fibonacci sequence by it’s successor or predecessor a set number of places after or before. Importantly, Fibonacci ratios are what is converged upon as you move up the Fibonacci sequence. So even though you get .5 from 1 divided by 2, this is not the ratio which is converged upon as you move up the sequence. That would be 0.618.
A small issue, but mathematical accuracy is important I think.
The target is not a retracement from the all time high, the target 956.97 is for primary 5 to = primary 1. A Fibonacci retracement for the whole move would be for the end of the super cycle correction, of which this downwards wave for cycle wave a is only wave a of a bigger a-b-c.
Does that make sense? I know it’s a bit complicated!
If in doubt. Gold is the King and the Leader and GDX follows along although not at the same speed or exact second or percentage. Overall in the same direction.
If the GDX alternate wave count is invalidated by GDX moving below 20.42 then I would have added confidence in the Gold alternate wave count which sees Gold still in primary wave 5 down.
But no, it wouldn’t be enough to fully confirm the alternate for Gold.
Please let me know if GDX does break 20.42 and I’ll update my charts and publish for you.
Quick question for the Gold bug group members. If Gold peeked at 1923.70 a few years ago and the fib retracement should be 50% from its high to its low before the next bull market run in Gold, shouldn’t Gold retrace back down to 961.85 before Primary Wave 5 is over? If so, wouldn’t this indicate the alternate wave count would have a higher probability? Thoughts? Thanks in advance for any feedback.
No no no. You retrace only in proportion to the last move, not the whole way since zero. See my other post in here today for an example.
Lara is expecting this wave 2 much deeper below 1195 to 1140. AND then expecting gold to go in wave 3 up per main wave count.
If u say below 1197 uptrend is in jeopardy???
Even one takes fib from 1131 to 1308, .786 fib comes to 1168. At 1140 gold will be in down trend if it gets to the Lara’s target?????
Before you sell the GDX, DUST or JDST we aware that the GDX is about to confirm a downward trend to new lows of $14 if we see an invalidation breach at $20.42, which might happen within the next 24 hours. If so, the EW would confirm the GDX will be going to $14, with would confirm the alternate for the Gold wave count provided by Lara that she states has even probability. Gold would then likely go down to the 956 target. Just wanted to point this out to all members on this site. I believe that Gold is is going down to the 956 target. Good luck to all of you….
Hi , what is the significance of 20.42 ? Perhaps this is something I missed in a previous discussion or Lara’s analysis ? Thanks .
ok , i see it mentioned in Lara’s previous GDX report .
Thanks Jak. I stay pretty nimble on JDST so I likely won’t be out long, and may even just buy some JNUG hedge for a few days when this wave ends. Thanks for the GDX reminder.
You brought up an important and timely point, thank you. I am asking Lara for her clarity on this ASAP.
Since the 2015 high on January 22nd at 1,307.71 gold closed down 61.8% today and Lara forecast is to drop to 76.4% area Thursday.
http://www.kitco.com/ind/Wagner/images/k3.jpg
True, and still…although she gives time projections – at times, that should be considered experimental; as I know that has been tried (time) to be applied to fib ratios as well (incl. alternations) with respect to wave time etc… time and time again….. and it has always remained “fluid.” Time is a different animal (not saying the time target is not 100% ((and I personally too hope not); but just saying as a general statement regarding time…that time is the force we all have no control over) correct).
Yes, time is difficult to estimate. I do not expect Lara’s time estimate to be exact (it’s an estimate) but her experience provides a much better time projection than I can develop.
Same here.
Thanks for the chart. I’m still holding my JDST from last week. I will likely sell out my position as this wave ends and wait for re-entry for the ride to 1240. I did dip a toe in long oil also.
MTLSD, I believe you meant “wait for the re-entry for the ride down to 1,140” instead of 1,240.
I will be selling DUST when gold its 1198 – 1193 zone as then minuette wave (iv) moves up for 1 to 4 days. However I won’t hold anything over a long weekend with Monday a NYSE holiday.
No, I meant up to 1240, for minutte wave (iv), but maybe it won’t get that high. I guess I meant to say – wait for re-entry until after the wave (iv) up…thanks for pointing that out.
The proper fib is .786, being the square root of .618
The .786 retracement of 1167 – 1308 would be $1197.
An old trading heuristic is that currencies (incl. gold) often retrace up to 78.6%. Another old trading heuristic is that 78.6% is the max retracement to retain confidence in the prior trend (which was up). So closings below $1197 would jeopardize the uptrend at the higher degree/timeframe.
I know that 0.786 is used by many traders, but it’s not accurate to call it a Fibonacci ratio. Its the square root of a Fibonacci ratio.
A small point, but mathematical accuracy is one of those things that really gets me. I like it.
This is actually why I leave 0.786 off my Fibonacci retracements.
Need info on gold’s future’s options.
Is it worth it to trade them?
What level of spread do these options offer?
Lara, thanks for your comments on timelines for various waves as they help provide context and structure to the wave picture.
Yes, respect to Lara. Difficult enough to get direction right, never mind the timing. Example, gold consolidated in the 1230’s for 3 full days testing our patience around a TL pivot I showed/chart, before finally relenting lower today. And tho a medium-term turn window arrives next week (changes to up), one cannot say exactly when. So watch the trendlines and pivot pts on different timeframes for cues.
GDXJ HnS update. Second Neckline is about to break. May be tomorrow??