
Downwards movement was expected, but price has moved mostly sideways. If Thursday’s session completes as a green candlestick this would be significant.
Summary: The third wave may be over and the following fourth wave for minuette wave (iv) looks like it has begun. I expect choppy overlapping sideways movement for another one to three days while it unfolds. Gold has entered a small consolidation phase, and the breakout when it is done should be downwards.
Click on charts to enlarge.
Main Daily Wave Count
At this stage I judge this main wave count to have an even probability with the alternate below. I will let the structure of downwards movement, and momentum, tell us which wave count is correct over the next few weeks. At this stage they both expect more downwards movement so there is no divergence in the expected direction.
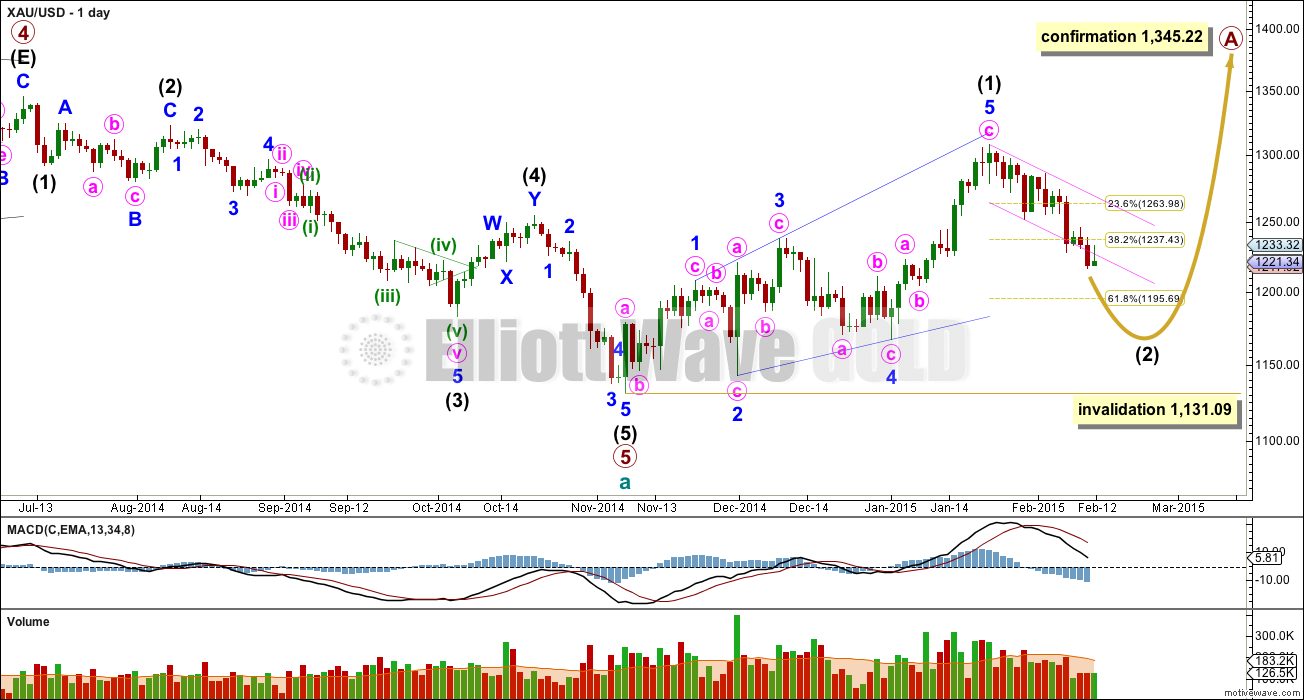
This wave count sees a five wave impulse down for cycle wave a complete, and primary wave 5 within it a completed five wave impulse. The new upwards trend at cycle degree should last one to several years and must begin on the daily chart with a clear five up.
The first five up may be a complete leading expanding diagonal. Within leading diagonals the second and fourth waves must subdivide as zigzags. The first, third and fifth waves are most commonly zigzags but they may also be impulses. This wave count sees minor waves 1, 3 and 5 as zigzags.
Leading diagonals are almost always followed by deep second wave corrections, sometimes deeper than the 0.618 Fibonacci ratio. This wave count expects a big deep correction downwards, and it should subdivide as a clear three on the daily chart (the alternate below expects a five down).
My biggest problem with this wave count, and the reason I will retain the alternate, is the structure of intermediate wave (2) within primary wave 5. This is a rare running flat but the subdivisions don’t fit well. Minor wave C should be a five wave structure, but it looks like a clear three on the daily chart. If you’re going to label a running flat then it’s vital the subdivisions fit perfectly and this one does not. This problem is very significant and this is why I judge the two wave counts to be about even in probability.
Intermediate wave (5) looks like a zigzag rather than an impulse, and has a corrective wave count. This is also a problem I have with this wave count.
Intermediate wave (2) is most likely to subdivide as a zigzag, which subdivides 5-3-5 at minor degree. When this 5-3-5 is complete then how high the following movement goes will tell us which wave count is correct.
Intermediate wave (2) of this new cycle degree trend may not move beyond the start of intermediate wave (1) below 1,131.09.
From January 23rd onwards, since the expected trend change, volume is highest on down days. This supports the idea that we may have seen a trend change and the trend is now down. Volume for Silver is even clearer, with a big spike on the down day there for 29th January.
I am concerned that at the daily chart it looks like this fourth wave correction should be labelled minute wave iv, one degree higher than I have it labelled here. I will take a closer look at this possibility and I may move the degree of labelling of this correction up one degree tomorrow if the subdivisions fit.
Sideways movement since the low at 1,217 looks very corrective, and is subdividing as a series of three wave structures on the five minute chart. Because this is showing up so far on the daily chart as a green candlestick I do not think this is micro wave 2 within subminuette wave v. I think subminuette wave v was over at the low as labelled and subdivided into an ending contracting diagonal. The target for yesterday’s analysis was too low.
Quite often following fourth wave triangles the fifth wave is more brief and weak than otherwise expected. I think this is what has happened here.
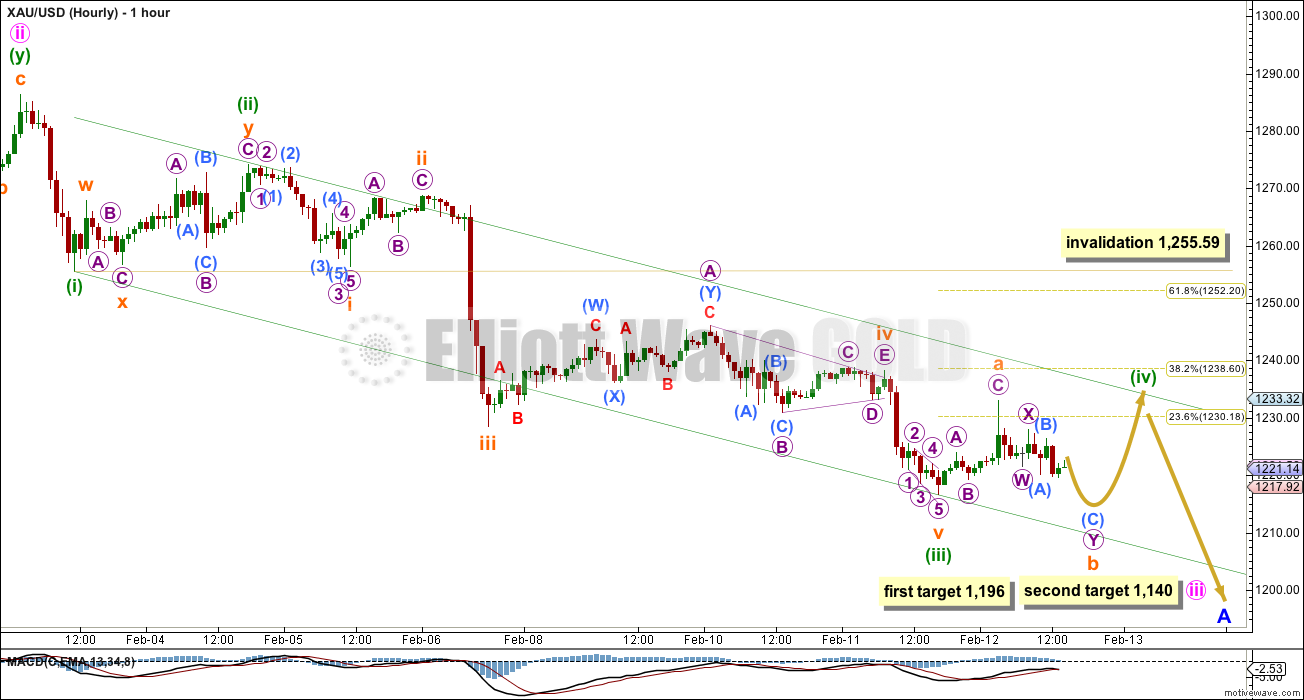
Redraw the channel about this downwards movement using Elliott’s first technique: draw the first trend line from the lows labelled minuette waves (i) to (iii) then place a parallel copy on the high labelled minuette wave (ii). The upper edge of this channel may provide resistance to minuette wave (iv) and it may end here. Fourth waves don’t always end within these channels, but they often do.
Minuette wave (ii) was a deep 60% double zigzag. I would expect minuette wave (iv) to be a shallow sideways type of correction. It would be most likely to end about the 0.382 Fibonacci ratio at 1,238.60 which indicates it may overshoot the upper edge of the channel.
Minuette wave (iv) is most likely to be a flat, combination or triangle. These structures may include a new low below 1,216.57 as in an expanded flat, running triangle or combination including either of these. There is no lower invalidation point at this stage for this reason.
I would expect MACD to get close to the zero line and hover about this while minuette wave (iv) unfolds.
Minuette wave (ii) looks like it lasted two days on the daily chart. I would expect minuette wave (iv) to last at least two days in total, and if it is a more time consuming structure like a triangle or combination it may last up to about four days in total.
Minuette wave (iv) may not move into minuette wave (i) price territory above 1,255.59.
When I know where minuette wave (iv) has ended then I will add to the target calculation for minute wave iii at a second wave degree. At that stage the two targets for minute wave iii may again be reduced to one, or they may both widen to small target zones.
At 1,196 minute wave iii would reach 1.618 the length of minute wave i. At 1,140 minute wave iii would reach 2.618 the length of minute wave i. These targets are still at least a week away, maybe longer.
Alternate Daily Wave Count
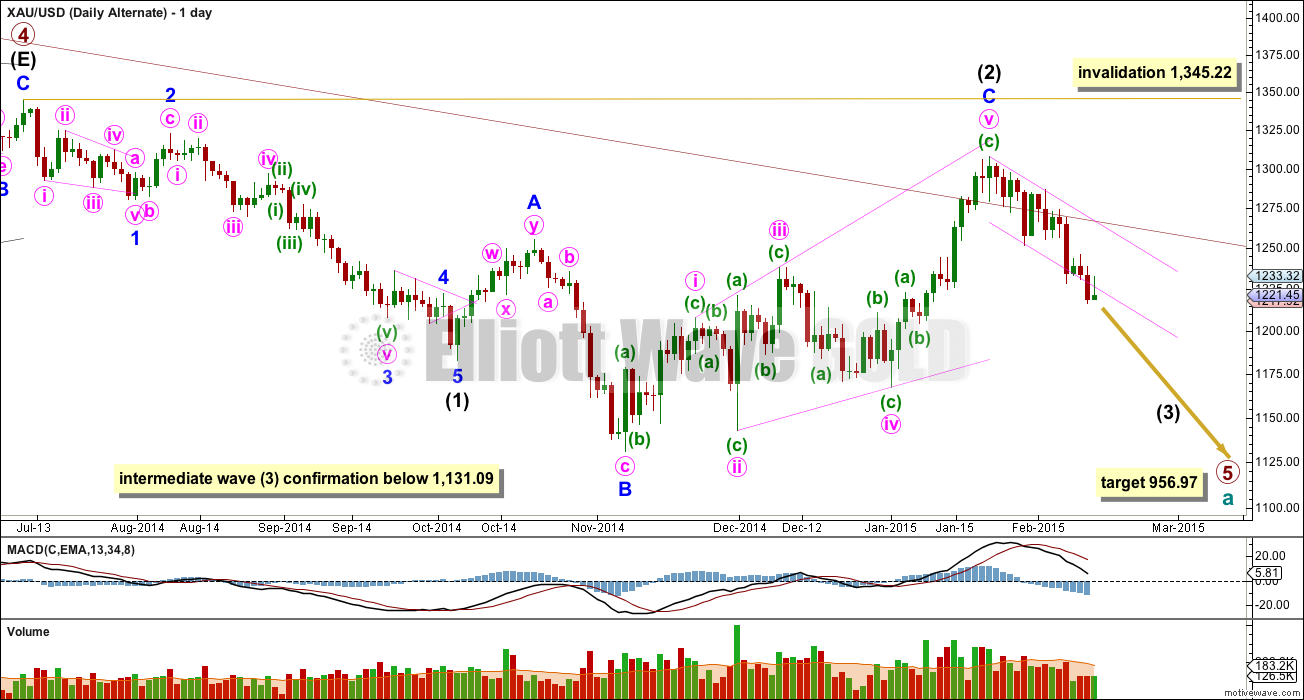
The maroon channel about cycle wave a from the weekly chart is now breached by a few daily candlesticks, and is now also breached on the weekly chart by one weekly candlestick. If cycle wave a is incomplete this channel should not be breached. For this reason and this reason only this wave count, despite having the best fit in terms of subdivisions, only has an even probability with the main wave count. It will prove itself if we see a clear five down with increasing momentum on the daily chart.
Draw the maroon trend line on a weekly chart on a semi-log scale, and copy it over to a daily chart also on a semi-log scale (see this analysis for a weekly chart).
Within primary wave 5 intermediate wave (1) fits perfectly as an impulse. There is perfect alternation within intermediate wave (1): minor wave 2 is a deep zigzag lasting a Fibonacci five days and minor wave 4 is a shallow triangle lasting a Fibonacci eight days, 1.618 the duration of minor wave 2. Minor wave 3 is 9.65 longer than 1.618 the length of minor wave 1, and minor wave 5 is just 0.51 short of 0.618 the length of minor wave 1.
Intermediate wave (2) is an expanded flat correction. Minor wave C is a complete expanding ending diagonal. Expanded flats are very common structures.
This wave count has more common structures than the main wave count, and it has a better fit.
For this alternate wave count the diagonal is an ending diagonal for minor wave C. Within an ending diagonal all the sub waves must subdivide as zigzags. The fourth wave should overlap first wave price territory. The rule for the end of a fourth wave of a diagonal is it may not move beyond the end of the second wave.
Although Gold almost always adheres perfectly to trend channels, almost always is not the same as always. This wave count is still possible. The trend channel breach is a strong warning that this wave count may be wrong and we need to heed that warning with caution at this stage.
A new low below 1,131.09 would confirm that a third wave down is underway.
At 956.97 primary wave 5 would reach equality in length with primary wave 1.
Intermediate wave (2) may not move beyond the start of intermediate wave (1) above 1,345.22. If this invalidation point is passed this wave count would be fully invalidated.
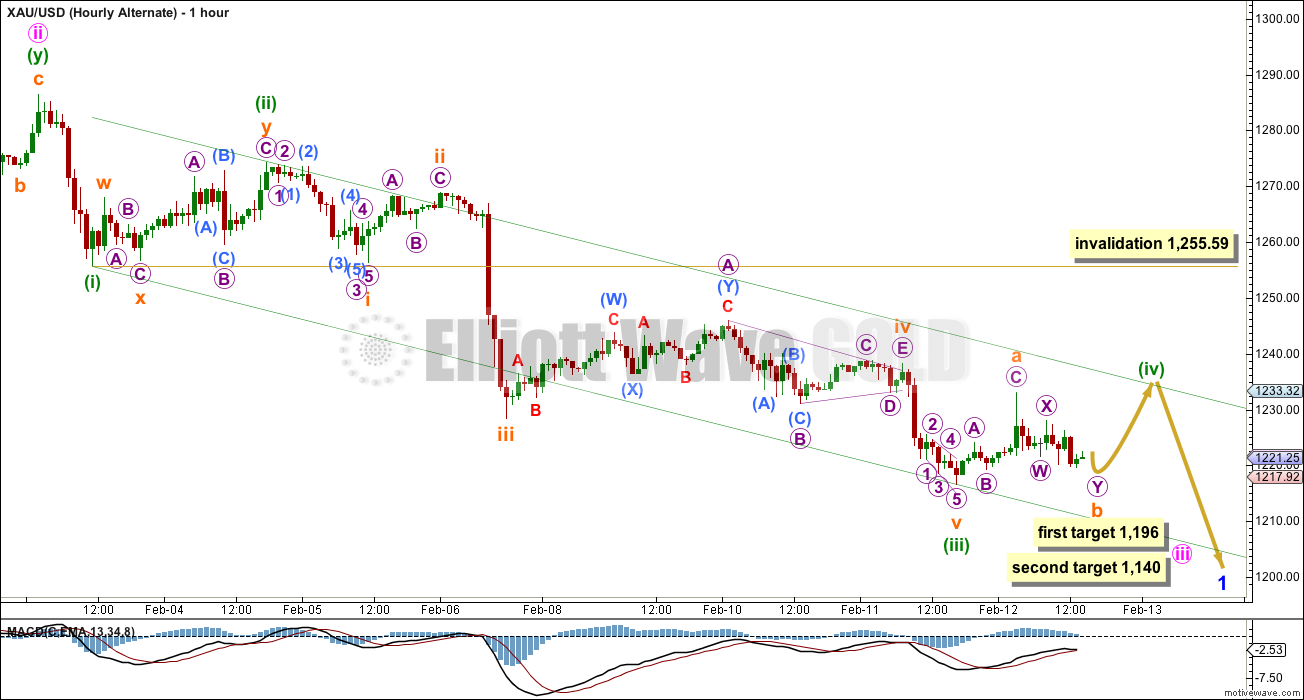
The short term structure, targets and invalidation points are still the same for both wave counts at this stage. They probably won’t diverge for a few weeks.
This analysis is published about 02:51 p.m. EST.
Just because my automated email alerts appear to be delayed, members please note I’ve just published Friday’s analysis. Have a great weekend everyone!
Have a nice one.
Considering holding DUST over the weekend as gold will either:
– fall to 1200 over Monday – Mines open well down
– rise to 1238 and begin decent – as DUST won’t trade on Monday I wont get the decay.
Any counter thoughts?
I still have a sizeable position in JDST. It’s already down so much I’m just going to hang on to mine over the weekend. Lara’s main count is still bearish.
IMHO – Next week should be gut wrenching for some, and “wahh wahh” for others it seems…which side I fall on is spinning my mind right now…I wish I knew. FOMC minutes 2pm Wed , followed by some Canadian gold miners reporting earnings that same day (and the next). Should be a super rollercoaster with US out of the game Monday when the Greek negotiate their credit card interest rate. I don’t really care about Greece at this juncture of their (EU) mess, and think it has absolutely no significance (like the “swiss gold vote”). Yet maybe Greece gives us a boring, subtle, 4th wave that ends Monday? I say boring 4th cause all the volatility will be off Monday. Actually, almost nothing I just wrote applies quantitatively to EW, but the emotional aspect of the market is what powers the waves right?
JUST A VIEW: Hi. Gold price has eloquently managed to prevent 100dma (1216) from being taken out this week and currently appears to be finding support at 1225/21-19…. Subject to a break above 1234-35, 1237-38 now appears to be the inflection point which if taken out would likely open up
upside risk 1270+…. At 1228xx gold price is below 50dma (bearish?) and we will just have to wait and see how this closes today. Have a great weekend all!
Lara, with silvers strong performance and golds resilience, is it time to introduce a low probability alternative where intermediate 2 ended at 1216 and 3 is underway?
It looks very corrective, though.
The count was just pushed back a degree to suit. I’m just curious to see what the wave count would look like if gold was to continue moving up from here. I said low probability, that’s all.
One should always bear in mind there are alternatives… and Murphy’s Law 🙂
I agree…
The price point to consider that idea is 1,251.97. Only if price breaks above this will I publish that idea. I don’t want to give it undue weight prior to that.
Thank you Lara, that’s good to know. Your answer above gave this very low probability.
I guess it’s possible. But it would have such an amazingly low probability, its not actually something I want to publish.
It would see intermediate wave (2) too brief and shallow.
Volume on up days is still low. If today was the first day of intermediate wave (3) I’d expect an increase in volume. That’s not happening.
Thanks Lara, I’m glad to hear that. Have a good long weekend.
Looks like wave iv is not over until its over.
Lara wrote above: “Minuette wave (iv) is most likely to be a flat, combination or triangle.
These structures may include a new low below 1,216.57 as in an expanded
flat, running triangle or combination including either of these.”
One more low below 1216.
And a choppy side way for four days.
Agreed think minute iv is over as a double 3 and now heading to $1198
Don’t you think it should reach 0,382 fibo first? It might need another wave up to be finished. Then the whole wave IV would be 3-3-5.
It looks like double zig-zag and it will end very soon.
I am no longer looking at 1238, the trend line seems to have held.
A strong move down would confirm start of the 5 wave?
correct.
It is very tricky. I started to build position above 1230. Will see. Still can go to 1238, but better to be earlier and then add above trend line if it moves there. Most important thing is money mngmt.
I think the triangle might be still in action. It is possible we are now at E and line is slightly overshoot.
Piotr, could you please explain, what is invalidated?
The triangle I posted below. That was one of the concept how this correction could have evolved. Since the upper band is breached, the formation is invalidated. So I stick to my second scenario.
Going back a couple days invalidation of 1238.27 for subminutte v to complete minuette (iii) was not taken out….(again I’m a total novice here), is minute (iii) done and over 100%?
1238 does not invalidate anything since wave 5 subminuette is definitely over. We are now in minuette 4 and the bottom of minuette 1 invalidates this count. This is 1255.59
Possible since it no longer looks like triangle
Yes, recent movement is 5-wave. I expect further movement toward 1238 (0,382 fibo). Looks like this will not last very long.
Held DUST over night so open will be uncomfortable. Any views on whether to hold for 5 wave or sell on open?
Spot gold rose to 1231 then dipped to 1223, and just now rallied back to 1231. Possibilities are that the first 1231 represents the end of minuette 4 and mniuette 5 has been underway, OR the three waves represent subminuette C of minuette 4. Either way, I would expect the downtrend to resume. I too have a position in DUST, and I will be selling at the end of today (as Monday is a holiday, and it is dicey to hold for one day in case minuette 5 is over ob Monday).
DUST has not been hit as hard as I expected. Would like to see 1238 hit and then a strong move down this afternoon.
My idea
another possibility to consider
clearly looks like a triangle forming….just a matter if it’s minuette iv or minute iv. I want to think it’s minute iv, but I think Lara will tell us the subdivisions don’t fit.
Hah, same timing.
thinking it’s targeting $1198 or 61.8% retrace
Chapstick – do you expect a move to 1198 via 1233-38?
I do now since it no longer is a triangle – looks like a double 3 now
The 0.382 Fibonacci ratio of minute wave iii with the new count is 1,243.27. I’ll expect it to get up there over the next two days maybe, or be more shallow.
You’re exactly right. I’m moving it up one degree.
Which means I would now expect it to last at least another two days. It’s very likely to be a bit longer than minute wave ii which lasted three days.
It could still be pretty much anything.
Analysis will be a wee bit later today, closer to NY close time.
Lara, have you considered ending diagonal and that gold is only in wave micro 2 in it?
I guess that could fit. It looks too big though, and micro wave 2 would be showing on the daily chart. So no, I’ll not consider that seriously.
That’s the thing about EW. You can make all kinds of things fit, but you have to keep an eye on the “right look”. Gold almost always has a textbook perfect look to it, so I put a lot of weight on that.
Thanks. Yeah it would be too big then, for this wave.
Lara, one more question. Can you do quick inter-day update on Friday for your members to clarify the recent movement – is/was it Minuette IV or Minute IV. It would be much appreciated. Markets in U.S. are closed this Monday. Thanks for considering.
I’m doing the analysis now, it will be published before markets close.
I’m moving the degree of labelling of this correction up one degree, I expect it’s actually minute wave iv (pink). I expect it to continue for another two days most likely and it may end about 1,243.27. I’ll have a nice channel for you to use.
Hi Lara,
Do you have a way to post an intermediate type of view for the XAU/USD chart. What I mean is the “daily” chart shows all the way back covering two Primary cycles and yet the current intermediate cycle shows no minor, minute or minuette degrees (but the prior Primary waves show theirs). Then when we go to the hourly chart it cuts off the first wave, or waves, because of space and we can not get a full view of the current Intermediate cycle. Does your charting software have a 2-hr or 4-hr setting? Is there a way to do your work on the regular charts and just pull one of these others up to view? NOT trying to make your job harder, lol, just ours easier. 🙂
Fair point. When I update silver I’ll put those labels in and maybe zoom in also.
uuuuu that’s exciting! can hardly wait for today’s analysis too. can’t imagine responding to all these questions at the same time. Must be an EW genius :):)
Does anyone believe that the v wave is complete?- wishful thinking on my behalf… holding DUST…
which v wave are you referring to?
fourth wave correction up. We just touched 1230.
If only Lara could post a bit more often…I wish I could count..but best guess is we are in a 4th of a C wave so a bit of consolidation then a bit higher to 1234ish
That would mean I live by my computer. Although that would make many people happy, it’s not going to happen.
Surfing ocean waves excellent warmup for charting gold waves. Too much computer blocks The Force.
Lara, I am happy that you are seriously entertaining the idea that gold could actually be in a 4th wave at minute degree. For several days now, I have thought that the proportions at the daily level look perfect when viewed this way. Minute wave ii is 61% (very close to .618) of minute i and minute wave iii looks like a crystal clear 5 down. The first and fifth waves of minute wave iii are also almost identical in length (assuming the start of the fifth wave was at 1245.97). If we are in minute wave iv, it can be expected to end at 1243 (.382) or 1233 (.236). Then we might see minute wave v go down to the 1170s/1180s – if it is equal in length to minute i – or perhaps only down to 1196 as you suggest. If what I am saying here is correct, then minor wave 1 could be over in about 5-10 trading days. Thereafter, gold could correct fiercely to the .618 ratio of the entire move down from 1307. If we take minor waves 2 or 4 of intermediate wave 1 as an example, this kind of a move could occur in a matter of days. Just don’t want your subscribers to be caught off guard. Again, IMO minor wave 1 of intermediate 3 could end in February.
Nicely explained. That is exactly what the wave count will be today.
Thanks for the vote of confidence.
Looks like this 4th wave may end tonight!
wouldn’t that be nice! Had wanted to close my $Dust position anticipating that Minuette iii ending might have actually been Minute III ending, but alas got hung up and now of course Lara is saying/suggesting Minute III ended. Darn it. Thank God for one last downward push coming. Hope the a.m. Dust bunnies don’t slaughter me. 🙂
Going back a couple days invalidation of 1238.27 for subminutte v for completing minuette (iii) was not taken out….(again I’m a total novice here), is minute (iii) done and over 100%?
I don’t think so.
There has been considerable debate over the gold/GDX relationship.
My intent is not re-start the debate but share information what I have been watching for trading in DUST/NUGT/JDST/JNUG.
These etf’s move tick by tick with the ratio of miners to gold price.
If ratio goes up short etf goes down and long etf goes up.
During trading hour If you watch this ratio on intraday period on a split screen half on the ratio and half for any etf JDST you will notice the etf will move with the ratio.
Means valuation of miners in relation to gold price is fluctuating. Gold price may remain flat but etf will change significantly.
I am using GDXJ/gld. Gold in intraday is not available from my chart service.
One can even time the trade using this ratio in intraday period..
Hi Lara…thanks for the excellent analysis…
Can you direct me to a website which provides “guidelines” for RELATIVE TIME DURATION between waves..(either in GOLD or in EW in general).?
******For example you have previously hinted that W2 should/can/may or should not be shorter than W4 ( I was not clear which) Are there common FIBO time relationships between waves such as W1 vs W3 vs W5….or W2 vs W4?…or W2 vs W1…etc…
******Also W1 and W2 sometimes repeat at smaller fractal levels at the beginning of impulse moves before W3 takes off. Is there a guideline that says each lesser fractal level must/should be shorter in time than the previous one?
*****Finally is there some predictive or repetitive aspect to the shape of waves from lower to higher fractal levels? For example if W4 is a triangle at the minuette level, is there a probability that the triangle pattern will repeat at the W4 minute level?
Thanx a bunch..
No, I can’t direct you to such a resource because as far as I know it doesn’t exist.
I’m halfway though writing my own EW book… but I’m also studying for CMT so it’s taking a while.
Gold very often exhibits Fibonacci time relationships in terms of the number of days, weeks or months that it’s waves last. Use the Fibonacci number sequence for this.
The relationship between a second and fourth wave is more to do with structure; zigzags are more brief than triangles and combinations. Second waves are often zigzags so that means a fourth wave may take longer as a triangle or combination.
At the beginning of third waves yes, you often (very often!) have a series of first and second waves. Each second wave correction usually is more brief than its predecessor, but not always.
There is actually no guideline that tells you how long a wave should last. You have to keep in mind the “right look” and that really is determined mostly by proportion between waves in terms of duration. So I guess that could be considered a guideline. Getting the “right look” is mostly from experience, so many factors are involved. Its hard to define for you, but I’m trying as I write my book.
Coming soon to a website near you!
Just sold my DUST even though Gold didn’t hit the target 1,199 – 1,193. Today’s update has gold already in minuette wave (iv) which may still drop to 1,217 perhaps tonight? Then gold may move up in two to four days to perhaps 1,230 or 1,238, which may be clarified another day.
Monday is NYSE holiday for when considering holding any 3X ETF over a long weekend, while gold goes around the world twice before you can trade any NYSE ETF.
Good thinking and limit the risk.
Lara wrote I would expect minuette wave (iv) to last at least two days in total
That will be Monday NY closed. Tuesday wave V may be in force??????
Very difficult to time the trade with waves.
papudi
Lara has a range of 2 to 4 days for wave (iv).
“I would expect minuette wave (iv) to last at least two days in total, and if it is a more time consuming structure like a triangle or combination it may last up to about four days in total.”
I’ll decide Tuesday morning where Gold is before I buy. Yes it is difficult to trade the waves as still volatile and need a 3X bear, which is not the normal ETF to hold. So I try to take profits daily and buy cheap that day or the next.
Novice question regarding ETFs –
In October 14 GDX = $20.63 and DUST = $30.
Today GDX = $21.19 and DUST = $13.64
How does this work – my brain is struggling here.
DUST just like any other 3 x etf has price decay everyday due to daily performance of underlining etf in this case GDX.
These are not to be held buy and hold. These need to be traded.
visit this site:
http://www.direxioninvestments.com/etfs?gclid=CPz15Jih3cMCFfRj7Aod6hMAXg
Richard/ Papudi – can I bother you to explain how the decay takes place?
I have held DUST since the 21st January and I have been in cycles of profit and loss even though Gold price has fallen $70 since I bought.
I made 15% is the first few days and continued to hold as I (wrongly) expected profits to multiple as miners were sold off.
Guidance appreciated.
For instance, If the miners goes down 10%
from 30.OO to 27.00 Dust goes down 30%
from 20 to 14. When miners goes back up
12% to 30.24. DUST will go up 36%
to 19.04. You have lost .96 cent in
dust when the miners has gained .24 cents
Mortagefree, one point to keep in mind, dust, nugt, gdx are based on mining stocks not gold. Price of mining stocks can vary dramatically from the price of gold. For example if one mining company has an explosion in a mine their stock price can drop immediately but that accident may have no impact on worldwide price of gold
Because GDX DUST, NUGT contains holding in 38 mining companies, when one goes up another comes down. It is very diversified.
http://www.vaneck.com/funds/GDX.aspx
Yes, and diversified basket of miners more volatile than gold.
Price decay (slipage) is due to the nature of 3 times etf leveraged. These etf’s are designed to perform three times daily the underline etf.
Example If GDX goes up 1% one day the leveraged etf will go up 3% and vice a versa.
Every day you add up plus and minuses the slippage is there.
Jan 2014 GDX was at 22 and Dust was at 42. Today GDX is at 21 and Dust at 13.
Loss of 42-13=29.
Take profit during up and down cycle.
mortgagefree
I try to take profits daily when they appear as they soon disappear. Then start again by buying at the next low as huge swings. Also momentum makes a big difference so sell at a peak after a good rally even an hour or longer like a day. If I sawy 15% I would take it and wait for another good low. The ETF doesn’t stay at a peak it goes opposite directions every day or two and then profit becomes a loss. 3X ETF’s rebalance themselves daily and the fees may add up to 15% a year.
Hi mortgagefree. Maybe a detailed example can help with visualising the time decay factor of leveraged ETFs.
Suppose that at a given point in time GDX trades at 30, and NUGT (3x leveraged) trades at 50.
At the close of the trading day, GDX price dropped to 27.
NUGT price will be 50 – 3*(50/30)*(30-27) = 35.
This is fine because GDX dropped by 10% and NUGT dropped 30%, exactly as expected. And that is what it should be.
The fun comes on the next day.
Now, suppose that GDX rallied back to 30 (from 27).
NUGT price becomes 35 + 3*(35/27)*(30-27) = 46.67.
It is observed that GDX recaptured the original price, but not so NUGT (46.67 as compared to the original 50). This is slippage!
Consider one more scenario. If, instead of the whipsaw, price continued to drop on the next day. Say GDX dropped to 24 (from 27).
When rebalanced from Day 1, NUGT price becomes
35 – 3*(35/27)*(27-24) = 23.33.
GDX has dropped in total from 30 to 24, a 20% loss.
NUGT dropped 53.34%, not the expected 60%.
In conclusion, in a whipsawing market, the slippage will accumulate losses dramatically. However, in trending markets, the leveraged ETFs lose less / gain less than expected. So, if you expect a profit, you will get less!
Hope this helps. Have a nice day.
Decay (slippage) would not make that much difference as maybe 1 maybe 2 percent a month. Could be other factors like whether there was strong or weak momentum on the ETF’s and GDX not comparing the same price.
U have given a great data. On Oct 14 knowing that PM sector will correct up in wave 2, u could have bot DUST long term PUT option at 30.. And would not worry about every day fluctuation. and would have nice profit in PUT Option.??????
I have NUGT PUT JUN 2015.
No guarantee gold will be up by June 2015.
Just be careful with options and 3x ETFs. They often reverse split and that can sometimes leave you with an odd strike that may turn out to be illiquid. Look at the 52 week range for NUGT, a reverse split could occur if we get a big move down. If it’s too good to be true it probably is. (something to consider)