
Downwards movement was expected, with a short term upwards correction to end just above 1,210.44 before the downwards trend resumes.
Summary: The main wave count expects downwards momentum to begin to increase now, and the target remains at 1,124. A new low below 1,190.40 is required for confidence in this idea at this stage. Alternatively, a larger minor degree correction may begin upwards from here. This would be confirmed with a new high above 1,211.96. While price remains below 1,211.96 and above 1,190.40 the situation will be unclear; we need price to break out of this range to clarify what direction should be expected for the short to mid term.
Click on charts to enlarge.
Main Daily Wave Count
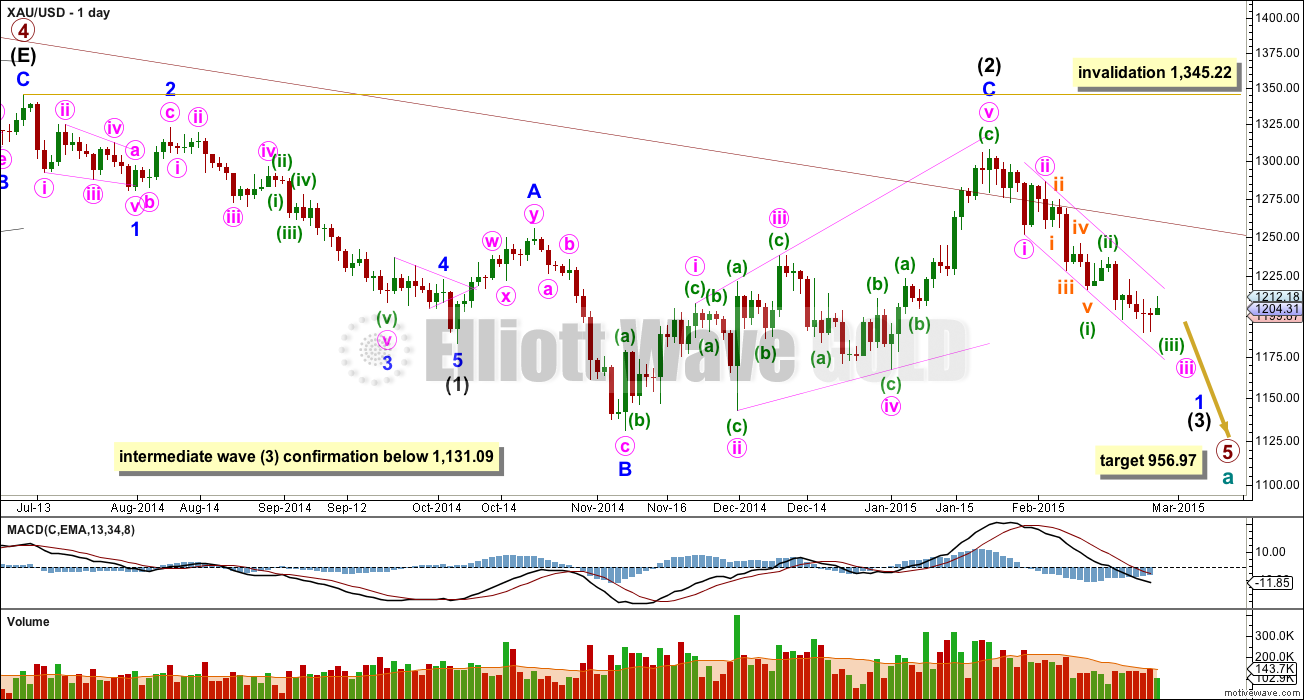
This main wave count sees Gold as still within a primary degree downwards trend, and within primary wave 5 intermediate wave (3) is in its early stages. At 956.97 primary wave 5 would reach equality in length with primary wave 1. For Silver and GDX this idea, that the primary trend is down, is the only remaining wave count. This main wave count has a higher probability than the alternate below.
The maroon channel about cycle wave a from the weekly chart is now breached by a few daily candlesticks and one weekly candlestick. If cycle wave a is incomplete this channel should not be breached. The breach of this channel is a warning this wave count may be wrong, and so I will still retain the alternate.
Draw the maroon trend line on a weekly chart on a semi-log scale, and copy it over to a daily chart also on a semi-log scale (see this analysis for a weekly chart).
Within primary wave 5 intermediate wave (1) fits perfectly as an impulse. There is perfect alternation within intermediate wave (1): minor wave 2 is a deep zigzag lasting a Fibonacci five days and minor wave 4 is a shallow triangle lasting a Fibonacci eight days, 1.618 the duration of minor wave 2. Minor wave 3 is 9.65 longer than 1.618 the length of minor wave 1, and minor wave 5 is just 0.51 short of 0.618 the length of minor wave 1.
Intermediate wave (2) is an expanded flat correction. Minor wave C is a complete expanding ending diagonal. Within an ending diagonal all the sub waves must subdivide as zigzags. The fourth wave should overlap first wave price territory. Expanded flats are very common structures and ending diagonals are more common than leading diagonals.
This wave count has more common structures than the alternate wave count, and it has a better fit.
A new low below 1,131.09 would confirm that a third wave down is underway.
Intermediate wave (2) may not move beyond the start of intermediate wave (1) above 1,345.22. If this invalidation point is passed this wave count would be fully invalidated.
Draw a channel about minor wave 1: draw the first trend line from the end of minute wave i to the end of minuette wave (iii), then place a parallel copy on the end of minute wave ii. Copy this over to the hourly chart.
From January 23rd onwards, since the expected trend change, volume is highest on down days. This supports the idea that we may have seen a trend change and the trend is now down. Volume for Silver is even clearer, with a big spike on the down day there for 29th January.
I am very concerned today that a green candlestick may complete for Wednesday’s session.
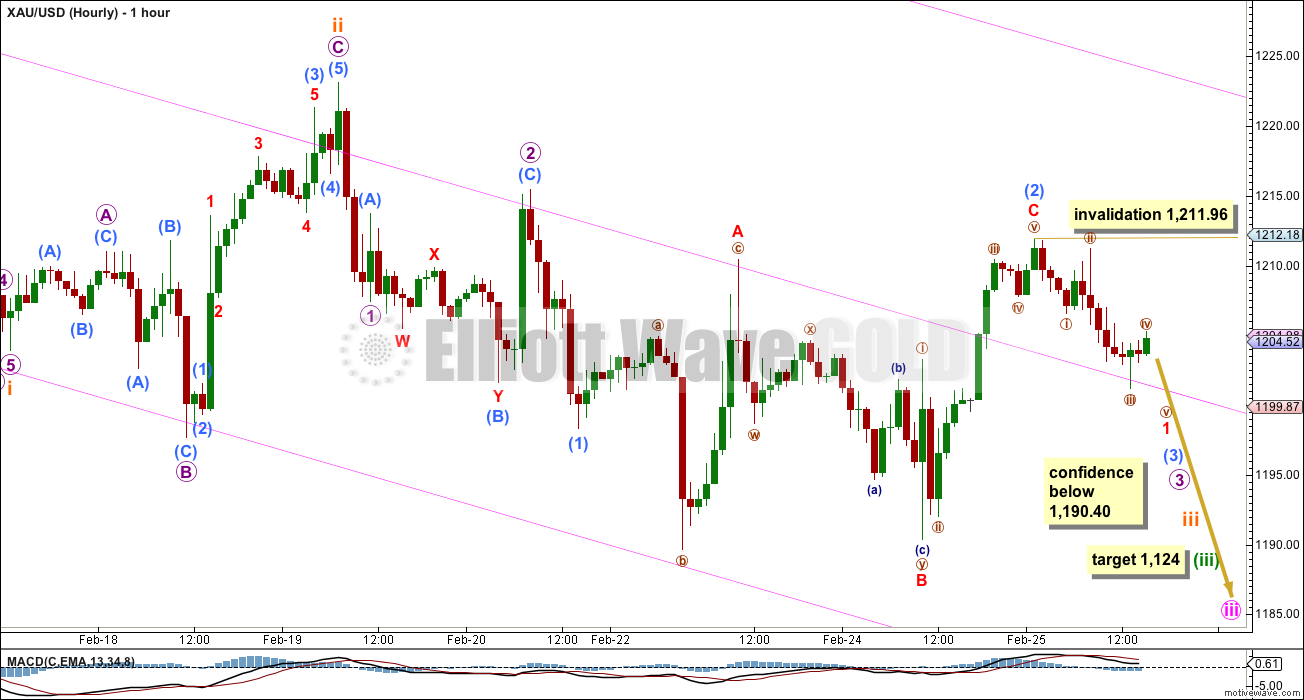
Within minute wave iii minuette waves (i) and (ii) are complete. At 1,124 minuette wave (iii) would reach 1.618 the length of minuette wave (i).
Minuette wave (i) lasted 6 days. If minuette wave (iii) completes in a Fibonacci 13 days it may end in another six sessions.
Minuette wave (ii) shows up on the daily chart, and it lasts three days. For the wave count to have the right look at the daily chart level minuette wave (iv) should also show up on the daily chart. The next interruption to the downwards trend should come at the end of minuette wave (iii).
This wave count is expecting downwards momentum to increase as the middle of a third wave unfolds. However, today it is reduced in probability and requires confirmation for that idea to remain viable. Submicro wave (2) lasted 52 hours, much longer than micro wave 2 and even subminuette wave ii two degrees higher. It is beginning to show up on the daily chart with a green candlestick for Wednesday’s session. If Wednesday closes as a green candlestick this idea will further substantially reduce in probability because such a low degree wave should not last that long.
If minute wave iii is extending and getting ready to move through the middle strongest part then this idea now requires confidence below 1,190.40.
The alternate idea below also works for this wave count. It is possible that minor wave 1 is over and minor wave 2 upwards has just begun. A new high above 1,211.96 would confirm this idea. If that happens then I would expect choppy overlapping movement for about three weeks for a deep second wave correction, most likely to reach up to the 0.618 Fibonacci ratio at 1,263.
Alternate Daily Wave Count
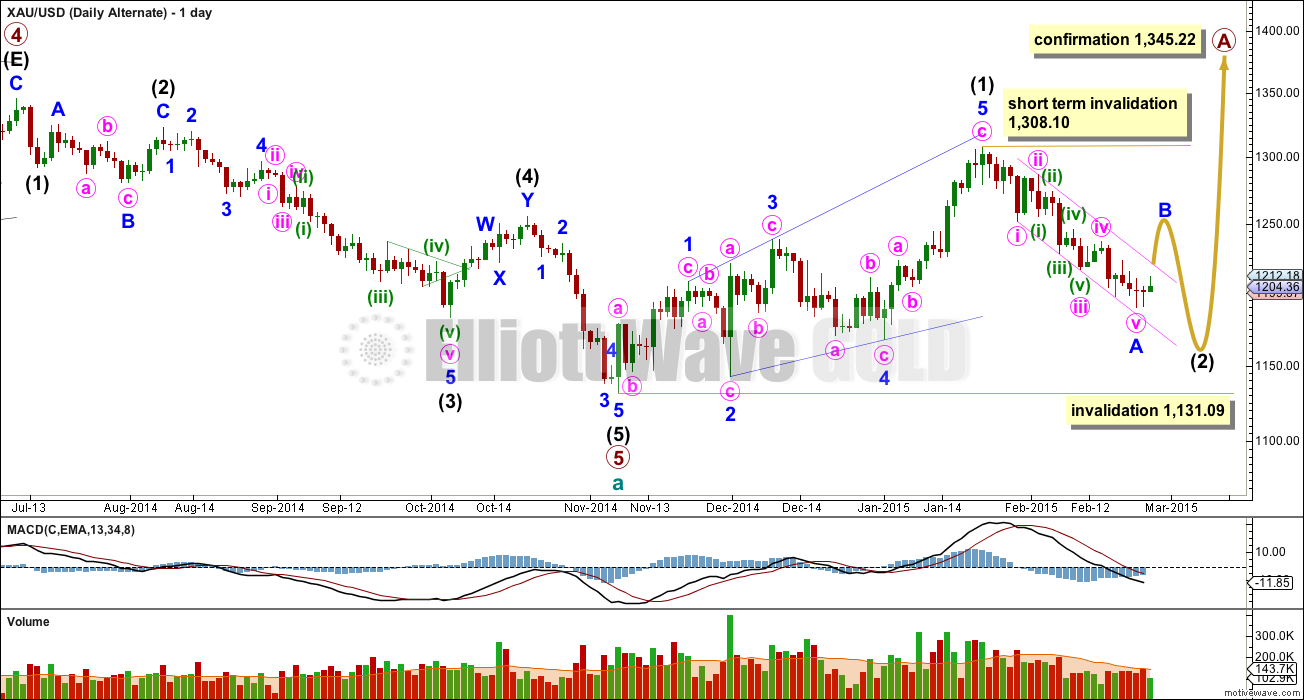
At this stage I judge this alternate wave count to have a lower probability. The structure of downwards movement, and momentum, will determine which wave count is correct over the next few weeks. At this stage they both expect more downwards movement so there is no divergence in the expected direction.
This wave count sees a five wave impulse down for cycle wave a complete, and primary wave 5 within it a completed five wave impulse. The new upwards trend at cycle degree should last one to several years and must begin on the daily chart with a clear five up.
The first five up may be a complete leading expanding diagonal. Within leading diagonals the second and fourth waves must subdivide as zigzags. The first, third and fifth waves are most commonly zigzags but they may also be impulses. This wave count sees minor waves 1, 3 and 5 as zigzags.
Leading diagonals are almost always followed by deep second wave corrections, sometimes deeper than the 0.618 Fibonacci ratio. This wave count expects a big deep correction downwards, and it should subdivide as a clear three on the daily chart.
My biggest problem with this wave count is the structure of intermediate wave (2) within primary wave 5. This is a rare running flat but the subdivisions don’t fit well. Minor wave C should be a five wave structure, but it looks like a clear three on the daily chart. If you’re going to label a running flat then it’s vital the subdivisions fit perfectly and this one does not. This problem is very significant.
Within intermediate wave (5) minor wave 3 looks like a three on the daily chart, where it should be a five. This movement may also be labelled with minor wave 3 ending higher and minor wave 5 looking like a three. Either way, one of the actionary waves within this downwards movement will look like a three and not a five which does not have the “right look” at the daily chart level.
Intermediate wave (2) is most likely to subdivide as a zigzag, which subdivides 5-3-5 at minor degree. When this 5-3-5 is complete then how high the following movement goes will tell us which wave count is correct.
Intermediate wave (2) of this new cycle degree trend may not move beyond the start of intermediate wave (1) below 1,131.09.
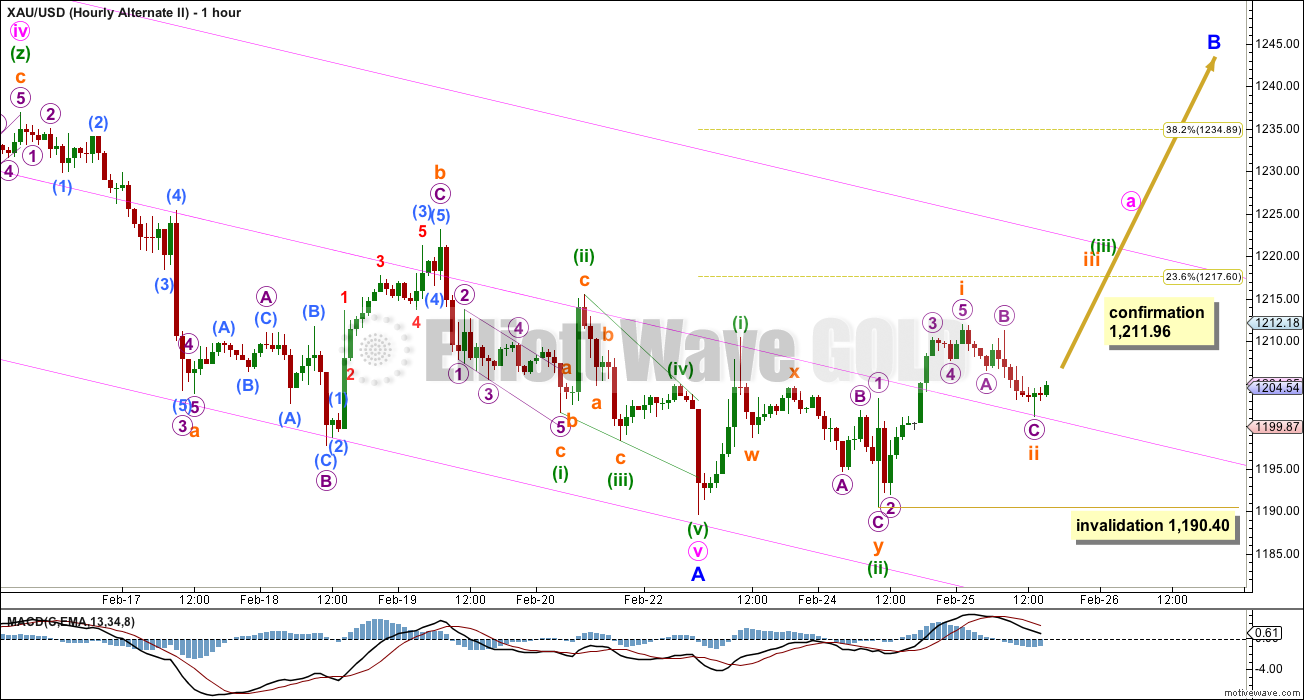
It is possible to see minor wave A as a completed five wave structure. Within it minute wave v subdivides okay as an ending contracting diagonal, with minuette wave (i) within it very long.
Within the ending diagonal all the sub waves subdivide as zigzags and the fourth wave overlaps first wave price territory, as it must for a diagonal. Minuette waves (ii) and (iv) are both 0.39 corrections of the prior wave down, less than the common length for a second and fourth wave of a diagonal of between 0.66 to 0.81. This slightly reduces the probability of this idea.
Within the zigzag of minuette wave (i) subminuette wave c is seen as an ending contracting diagonal. The wave lengths fit, they are all smaller than the prior wave in the same direction, but the trend lines do not work and they don’t look like they’re contracting. This piece of the wave count looks wrong, further reducing the probability of this idea.
This idea would be my sole wave count for both the main and alternate if it is confirmed with a new high above 1,211.96. Minor wave A would be seen as complete as would minor wave 1 for the main wave count.
For both the main and alternate wave counts minor wave B or minor wave 2 should be a clear three wave structure on the daily chart, it should last about three weeks, and it is most likely to end about the 0.382 or 0.618 Fibonacci ratio of minor wave A or 1 at 1,235 or 1,263.
This analysis is published about 04:08 p.m. EST.
With 1206 holding and 1203 below that, expect gold price to rally through 1213-14, 1218-19 before consider shorting! Consider liquidating shorts; gold price appears to be bouncing off its pivot 1210-11….. Here, consider @Waseem Mehar vies below! Good luck!
I’m not having technical difficulties am I? Haven’t seen today’s report, nor any comments for over 3 hours. Anyone?
I think Lara mentioned she was going to be out today, so post will probably be late
Gold made new low 1206.65 vs 1206.78. has any thing change here??
If it’s only going to 1205 before moving up again I not sure why the miners are so bearish? Maybe they think it’s going lower…
Let me help you Scott. It’s called ‘Murphy’s Law’ and it works like this:
I sell a short position – Stocks fall
I buy a long position – Stock fall
We’ve all had that feeling!!
Sometimes It feels like they’re watching every move you make…
Why say miners are bearish, GDX is up for the day?
JDST/ DUST seem to have become bearish…
Lara’s comment:
If you did not scroll down you missed Lara’s comment below:
“I may not be able to do that today, I have to be out this morning. Tham
is spot on. I think its probably another first and second wave, and the
second wave correction probably ended at 1,206. I can see a pretty clear
three down to that low. So I would expect it to move higher and
increase momentum.”
Unless it makes a new low . Then it will be 5 down . I am sticking to my analysis . Down . Minute IV .
Miners seem to agree with you…
For my sanity I hope Alex you are wrong… I have been smashed today by DUST.
I know exaclty what you mean. Sold out of JDST earlier.
I bet you regret this now…
No no, of course not 🙂 … and you?
I sold, and have bought jnug at 28.14 – please do not ask me why…
Just now? I’m seriously considering it too (just a small one), hehe!
Be careful – its dangerous out here…
maybe…but so far it seems that GDX has very low volume today
I’m looking at DUST/JDST…fast movers
Yesterday, following the miners proved to be the right way to go!
Even if gold only goes back down to 1205 they could jump quite a bit as we’ve already seen..if it does..
Thanks Alex77
Ok to stick with your analysis.
However, Lara didn’t warn about any 5 down or a new low or minute IV.
Daily alternate chart shows minute IV (circle) ended 8 days ago and gold is now in Minor B heading up in a three wave structure as Lara mentions in the video.
An hour ago, Lara commented below,
“Tham is spot on. I think its probably another first and second wave, and the second wave correction probably ended at 1,206. I can see a pretty clear three down to that low.So I would expect it to move higher and increase momentum.”
An hour ago Lara commented, “I have a green candlestick from FXCM data for 25th and now also 26th. That’s pretty bullish short term.”
What is ur point ? That Lara is never wrong ? Just a few days ago you said “trust Lara” and Lara was wrong then . So you know … do I really have to say more ?
Fair to say that the past few days have been difficult to follow EW. I still believe we may go lower today, but sold out to remain consistent.
Yes you could say more Scott.
What is the lower target you may be thinking of and any time frame so I might buy before close or should I wait for Friday morning?
I know someone who invests in gold a lot and is warning of a pending drop in gold overnight due to strong US dollar, weak crude and bearish Ichimoku indicator for gold.
Prosperous trading to you, thanks for sharing.
I’m not sure. I’m just going to exit DUST today. Be nice if there’s a run up at the end…
And I should add that Lara is not “Wrong” . Just EW is fluid and changing and you have to add your own analysis and ta . Even Lara would tell you this .
Hi @disqus_Fh3vUMwPy5:disqus Yes I am holding shorts; initiated shorts at 128x downwards to 124x and again initiated shorts from 122x and holding. Don’t see any signs of gold price bottoming just yet…..With 1191-90 holding, upside risk 1219-20 was taken out today which probably now opens up 1305 subject to gold price is able to rise back up again through 1216-20, 124x etc. Have no interest in Buy, shall switch when consider appropriate; prefer to follow Lara wave counts!
Appreciate that Syed – I too am short and looking for an exit, holding DUST. It moves quickly!
Positioning for a Junior Miners ETF Rebound Feb 25th, 2015
http://finance.yahoo.com/news/positioning-junior-miners-etf-rebound-190041898.html
Regarding the alternate hourly count with movement to 1220 did minuette wave (iii) end and then this downwards movement to 1206 was minuette wave (iv)? Wondering if that makes any sense because in that case minuette wave (iv) would have gone into territory of minuette wave (i).
That can’t be for the reason that you stated. Gold may be completing a 2nd wave of a 3rd wave up. I believe movement should be up from here in the short term.
That makes sense to me. Appears 2nd wave bottomed already at 10 am at .618 so gold may move up.
I say we are going back down . Minute iii ended on Feb 17 . We are now in Minute IV running triangle or some other side-ways corrective structure . Minute IV .
or a possibly a flat
for a flat we need an expanded 3-3-5 for Minute IV and after this mornings fall I don’t see that happening . we won’t exceed this mornings high and upper channel in Lara’s chart will not be breached .
Alex77
Lara has drawn a line from wave c 2 to wave x 4 in alt daily chart. Gold appears to have breached above 1220 and now backdown below.
Does this count failure of any wave?
Alex77
Lara said:”If that happens then I would expect choppy overlapping movement for
about three weeks for a deep second wave correction, most likely to
reach up to the 0.618 Fibonacci ratio at 1,263.”
You may be right choppy wave correction. Back down towards near 1190.
Same.,.
Minute 3 is 1.618 of min 1. (I have feb 18 as pink 3 low) with rare running flat for pink 4 stopping at trend line.
Gold dropped to 1206.95 at 10:01 am, retrace target of $1,207 by Waseem and Tham has been hit. I calculated .618 at 1,207.58, Verify it yourself.
I sold my DUST and bought some GDX just now at 10:04 am.
May wait for Lara’s analysis before another transaction.
Hourly Alternate II is now main hourly wave count for both daily counts.
High low so far today as of 10:15 am
DUST 13.86 – 13.45
GDX 21.15 – 20.94
JDST 9.04 – 8.63
NUGT 15.40 – 14.98
JNUG 29.90 – 28.72
Richard, does GDX and DUST price usually lag gold price move?
Yes there is some lag. The longer gold stays at current 10:55 time and 1208/1209 area the lower DUST will go and GDX go up very gradually and then stall as they adjust more and more to new price levels. Gold price pretty steady for 30+ minutes and DUST dropped .16 and GDX went up .09 since 10:10 gold price was 3 cents lower.
Waseem, does your work also estimate timelines ( how many days or weeks) to meet 1230-1235 target ?
Last paragraph of analysis.
For both the main and alternate wave counts minor wave B or minor wave 2 should be a clear three wave structure on the daily chart, it should last about three weeks, and it is most likely to end about the 0.382 or 0.618 Fibonacci ratio of minor wave A or 1 at 1,235 or 1,263.
not goin to happen
Lara’s estimate is fair. However, keep in mind that – and I am not sure if this is relevant here or not – minor 2 and minor 4 of intermediate wave 1 (primary 5) were shorter than that. Minor 2 could be a swift correction because it is occuring within a 3rd wave.
And I might add that just because it is swift doesn’t mean that it will be short. I am expecting 1263+. Thereafter gold may plummet 200-250.
Need to see if gold price can drop through 1209-08 would open up 1199-98 with 5dma (1205-04) possibly stalling…. It is my sentiment that with the 20dma dropping so too the 100dma would maintain bearish / downside pressure on gold price…. Lets see what transpires!
Syed – seen you are quite prolific on gold in other forums. Are you holding a short position here?
it just went through your target of 1208. if gold closes below 1190 today I’m seriously gonna have a cow.
Kitco 24 hour chart gold has following to 1205 or lower for the day. Red line is yesterday and blue is day before.
http://www.kitco.com/charts/popup/au24hr3day.html
If gold closes below 9ema @ 1211 then gold is still in wave down. All it was is a pop and dump. That my wave?????
This is not in line with Lara’s assessment.
Not true must go below 1190.40 or get new wave count from Lara.
For those holding DUST interested in your plans – exiting or holding? I am holding from 14.83 and imagine that we will not see this level for a while. Any advice appreciated.
I dumped half position too early near open of pre-market. Are you all looking to get out of shorts around 1207 and then go long, or just go to cash for now?
I am looking to get out and appreciate where the market is going. There are many contrasting views in the market at the moment and I am unsure which one to follow.
That is a good indication that gold is at a short term turning point. That manifests itself in charts as several long wicks and smaller bodies on candlesticks. Essentially there is a tug-o-war between bulls and bears.
While I am ultimately bearish on gold until it reaches the 950-1000 level, I do realize that it needs to correct at some point. It has moved down almost $120 within a month without any serious breaks.
Most important question now seems to be probable correction down. How low will it go? Any EW wave counters want to make a prediction?
Waseem Mehar has been very accurate, possible Waseem might describe what he sees?
1207 probably..
Waseem, any harmonic pattern formed recently?
Even from Dec lows, or recent high like gartley 222 & variations etc?
I posted below……. Head n Shoulder in daily chart is forming and 2nd shoulder should be completed at 1230-1235…
that seems likely now.. i posted that chart on 2oth of Feb..
after completion of 2nd shoulder it should move downwards…
The post below indicates a target of 1168 – is that now redundant?
when i posted that chart.. i post a second chart alongwith that……. with that it can either go to 1188 or 1167……
Thanks, I respect your work.
Lara’s upside target is possible 1235 which aligns with your 1230-1235
You are welcome
I am novice in Forex, just started 1 year ago. 🙂
break below 1207 open up 1200 and below that 1192-1194.. But the way the daily candle is developing it will be another inverted hammer… which will take gold higher same as in yesterdays daily candle.
CMEX open. Let see what big boyz will do. As of last COT there were 356000 commercial shorts. Still Pretty high.
Goldd when up like this level between 6:30Am and 7:30 AM it tends to drop fairly and again when 8:15 Comex opens Boyz in NY takes it down by 11AM.
80% of the time that is the scenerio even in bull trend from 2003 onward.
Lets see if it repeats today and honors that.
Thanks for that observation!
Alister
Gold is right on schedule as it always has done.
Yes, well done – exactly what has happened so far. Thanks for sharing.
Found this chart of annual gold price % gain/loss in different currencies interesting. While gold may fluctuate quite a bit, seems that over time, the gain/loss reverts to a mean price % gain in a fairly tight range for most currencies.
Chart pulled from this post if interested:
http://www.gold-eagle.com/article/12-reasons-why-ritholtz-and-many-experts-are-mistaken-gold
Gold just hit a high of 1,216.15 at 3:48 am. I got to go to sleep.
Anyone have any idea how low gold may descend by the 9:30 am EST open? I’m looking for an escape plan to sell DUST and buy GDX at the open or later duringThursday, please?
My best guess is that we have just completed micro 1 at 1216.15. Let’s hope that micro 2 drops by 0.618 Fibonacci to 1207, and slowly at that so that we can cut losses at the US open, Good luck to all.
Tham – Awesome!!! Now I can go to sleep and pray gold and DUST and GDX are positioned the best way possible to sell and buy for this direction change today.
Lara please weave your EW magic before the close Thursday for us to all make profits Friday for a great weekend, thanks. Prosperous trading.
I may not be able to do that today, I have to be out this morning. Tham is spot on. I think its probably another first and second wave, and the second wave correction probably ended at 1,206. I can see a pretty clear three down to that low. So I would expect it to move higher and increase momentum.
its up from here for a few days
disqus_0QgvJ5gTSZ • 15 hours ago
UP AND AWAY FROM HERE, GAP AND GO IN THE AM in wave 1 of C of 2
•
I am glad I sold half of my DUST in the after-market Wednesday as the main hourly wave count has been invalidated at 1:20 am Thursday, when gold exceeded 1,211.96 and hit 1,212.35. Now the Alternate hourly wave count automatically becomes the main hourly wave count even if if drops below 1211.96 and remains the main hourly unless gold dropped below 1,190.40.
good 4 u!!! my dust is toast, lol
Yes, that was 1 minute later at 1:21 am 1,213.21 the high so far.
Yeah, toast is the word! My JDST too.
Meaning you sold it or still have it?
Richard, unfortunately I still have it.
I sold half my DUST after hours because bought some cheap Wednesday then with this gold direction confusion I felt I had too much exposure and luckily sold DUST at 14.17, 3 cents more than it closed at and talked my way out of the after hours broker $85 charge and only paid $10 fee.
all too funny you guys. We just need a little jam and we’ll be happy. then we’ll go buy and sell some more.
Let’s hope that your jam could jam the brakes on the rise, giving us a chance to sell off some DUST for a minor loss.
Well, we can say that DUST has bitten the dust.
Hi Lara,
Please clarify this statement beginning a paragraph that’s between your “Alternate Daily Count” and the “Hourly Main ” count: “The alternate idea below also works for this wave count.” Thanks.
eg: you mean
‘the alternate (daily) idea below also works for this (hourly) wave count.’ ?
Yes now the Hourly Alternate II wave, is the sole hourly wave count for both the main daily and alternate daily by it’s confirmation above 1,211.96. Minor wave A would be seen as complete as would minor wave 1 for the main wave count.
For both the main and alternate wave counts minor wave B or minor wave 2 should be a clear three wave structure on the daily chart, it should last about three weeks, and it is most likely to end about the 0.382 or 0.618 Fibonacci ratio of minor wave A or 1 at 1,235 or 1,263.
wow. thanks for that clarity Richard. Think my brain’s ready for TO (time out).
Really wish Lara had a way to post differently, maybe text side-by-side to specific charts for current movement, And leave the old analysis text alone-separate. All this text is a lot to scroll thru for an “at a glance reference”
So back to this charty thing….the a-b-c that’s here, do you think the upcoming or subsequent minute b wave to where we are (in Minor B or Minor 2) will descend below today’s price point in this minute a wave?? Can you tell I’m planning my exit? 🙁 (Thnk i have to take a loss)
dsprospering you’re welcome. I understand much of what Lara says. However I find a lot of EW counts and retrace points confusing so I can’t tell you how low gold will drop by the open or after open today.
Maybe watch the part of the video that discuss the hourly alternate chart.
I wish I knew as I have some DUST to sell and then buy GDX and timing both can be a guessing game other than at the open which may not be the best timing. Some nights aren’t safe to hold anything as gold changes directions too often.
yeah, i bought DUST when i shouldn’t. Saw daily MACD divergence and ready for cross over + GLD ready for upward move — all contradicting the FX analysis. That was my clue to wait. Once again, TO time
By the way, what time zone are U — where u located?
Midnight owl in EST.
Would be good when Lara complete her program and can also provide technical analysis together with EW.
u really r midnite owl. I used to live EST, now in PST. i’m ready to call it a nite. Good luck w/ tomorrow.
Now it is 4:00 am and go to sleep and wake up at 8:30 am and take lots of superfoods and green tea and health food and meditate.
lol. sounds about right
that’s why I do a summary
sorry Lara. was having conversation last p.m. with Richard. Wasn’t trying to offend you.
Spot gold rose above 1213 just now. The main count is invalidated or subject to change.
agreed. looking at hourly alternate
There is still one possibility for the main count. Micro wave 2 stands at 1215.47. If price doesn’t go higher than that, then Lara’s sub-minuette 2 may have been too early. The high from here (provided it is lower than 1215.47) can be sub-minuette 2 and the downtrend can continue. The next few hours will tell.
Subminuette ii or Submicro ii ?…if you are saying subminuette what is it forming exactly ?
You are right. It is sub-micro 2.
Spot gold has risen higher than 1215.47. The main wave count is definitely voided.
Well I definitely am not going to base my whole decision off of this 1211.96 level now . I don’t like the alternate wave count at all . There must be more to this yet .
The
Way It Looks For Now: With 1192-91 holding, Gold price is bearish, down
trending, but riding a Buy signal and looking to rally with the possibility to
take out 1212-13 for 1217-20 subject to take out 100dma (1215-16); a break
above 1219-20 would likely indicate for further upside to follow…. An impulse
move / breakout with thrust is expecting…. At this stage it is very difficult
to say which way Gold price impulse move is likely to head; an upturn in MacdMA
indicates a rally… My bias remains for the downside…. I am short and
holding looking for gold price to successively break below 1208- 05-03-02-1196-95
and hopefully take out 1190!…. Whichever way the breakout with impulse
occurs, will likely then be the way forward….
I posted this chart on 20th……with a target of 1237 at that time..
today lara also gave target of 1235 if it invalidates the main wave, which has happened now…
Now daily Resistance is at 1232..
1235 is 0.382 retracement from 1307 to 1190
and 1263 is 0.618 retracement from 1307 to 1190
but If the pattern in this chart is correct is should go to 1232-1235 now.. and then move downwards from there.
Since gold has climbed up to 1209 it appears wave iii is still not in force. In one day trend becomes unclear.
Two price levels to watch 1211 and 1190??
Lara, I take it that the direction at this point is unclear for GDX and silver?
“For Silver and GDX this idea, that the primary trend is down, is the only remaining wave count.”
Yes. I’m looking at silver and I’m not sure of the wave count at the moment for that market. Overall the trend is down for all three, but in the short term I’m not clear on what silver is doing.
Lara in gold day chart the pink channel bottom rail if you extend it, gold has dropped below this channel for fourth day in a row and today again backtested the channel.
This pink channel is drawn connecting wave ii C and wave iv C.
Beside gold put in series of inverted hammer and doji (reversal candles). If a tall green candle develops covering the range of all candles that will be very bullish for gold. That pattern is called frying pan in Steve Nison book. Then again Nison states that declining top of series of reversal candle tails is bearish.
Also Gold price stayed below powerful 9ema. Once price drops below 9ema it acts as resistance.
One more day?????
Papudi, are you saying gold has 1 more day to decide up or down?
One more day to set the trend. Gold may in 24 may breach Lara’s 1211 or stay within the trading range tomorrow.????
Due to the uncertainty in today’s post, I sold some of my JDST, and added a little more UWTI. The vix had a nice reversal today.
Minute 2 up for GDX may be starting along with minor 2 for gold
stockcharts updated today’s gold close to + $2.90 +.24% for a green candlestick. This substantially reduces the chance of gold dropping with increasing momentum as per the beginning of today’s video.
http://stockcharts.com/h-sc/ui?s=%24gold
If you use pmbull,com, their ‘day’ candle closes in 32 minutes.
Lara uses the 4:00 pm EST close. The markets usually use the 4:00 pm gold close.
pmbull goes 24 hours a day.
Lara in the video you mention that if gold closes up with a green candlestick that chance of gold dropping with increasing momentum reduces substantially. Gold closed up with a black candlestick US Gold + $.70 .06%.
http://stockcharts.com/h-sc/ui?s=%24gold
I have a green candlestick from FXCM data for 25th and now also 26th. That’s pretty bullish short term.
That ending diagonal for the alternate is pretty ugly . What about if Gold made a new low yesterday . Is there a better count in that case or is it worse ?
Lara , what about if minuette i ends where you show the first subminuette a and minuette ii ends where you show subminuette b . Can you make that work from there on ? Assuming Gold made new low yesterday .
Please advise , thanks .
Oh I guess minuette ii has to be a zigzag or can it be any three ; I forget ? Anyway let us know if something else works with the new low in Gold scenario . Probably not , but just checking .
I think the market answered your question before I did. The alternate is correct, despite it’s problems.