
More upwards movement was allowed for and has remained below the invalidation point and trend line on the Elliott wave hourly chart.
Summary: I expect a third wave down is underway. The short term target for the end of the middle of the third wave is at 1,224 and this may be met in about two or three days time. The mid term target for the third wave to end is either 1,196 or 1,140 which may be met in about one and a half to two weeks time. There is an alternate possibility that a second wave correction could continue sideways before the middle of the third wave begins.
Click on charts to enlarge.
Main Daily Wave Count
At this stage I judge this main wave count to have an even probability with the alternate below. I will let the structure of downwards movement, and momentum, tell us which wave count is correct over the next few weeks. At this stage they both expect more downwards movement so there is no divergence in the expected direction.
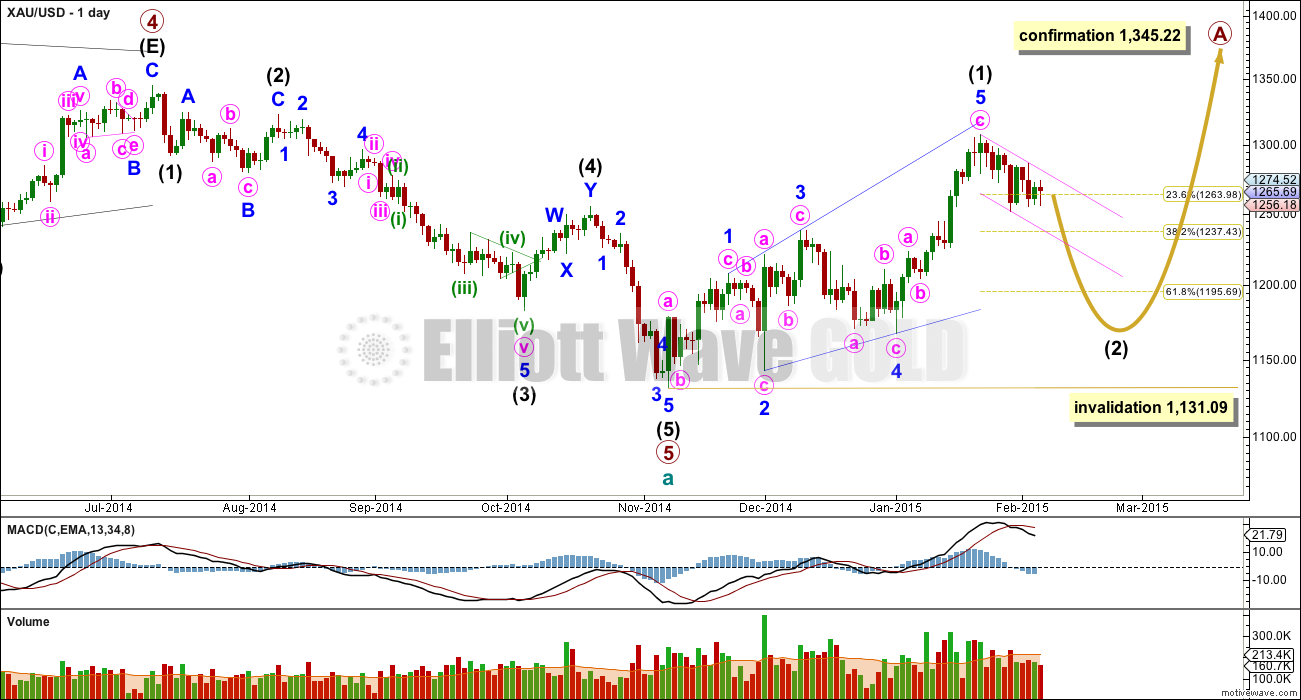
This wave count sees a five wave impulse down for cycle wave a complete, and primary wave 5 within it a completed five wave impulse. The new upwards trend at cycle degree should last one to several years and must begin on the daily chart with a clear five up.
The first five up may be a complete leading expanding diagonal. Within leading diagonals the second and fourth waves must subdivide as zigzags. The first, third and fifth waves are most commonly zigzags but they may also be impulses. This wave count sees minor waves 1, 3 and 5 as zigzags.
Leading diagonals are almost always followed by deep second wave corrections, sometimes deeper than the 0.618 Fibonacci ratio. This wave count expects a big deep correction downwards, and it should subdivide as a clear three on the daily chart (the alternate below expects a five down).
My biggest problem with this wave count, and the reason I will retain the alternate, is the structure of intermediate wave (2) within primary wave 5. This is a rare running flat but the subdivisions don’t fit well. Minor wave C should be a five wave structure, but it looks like a clear three on the daily chart. If you’re going to label a running flat then it’s vital the subdivisions fit perfectly and this one does not. This problem is very significant and this is why I judge the two wave counts to be about even in probability.
Intermediate wave (5) looks like a zigzag rather than an impulse, and has a corrective wave count. This is also a problem I have with this wave count.
Intermediate wave (2) is most likely to subdivide as a zigzag, which subdivides 5-3-5. When this 5-3-5 is complete then how high the following movement goes will tell us which wave count is correct.
Intermediate wave (2) of this new cycle degree trend may not move beyond the start of intermediate wave (1) below 1,131.09.
From January 23rd onwards, since the expected trend change, volume is highest on down days. This supports the idea that we may have seen a trend change and the trend is now down. Volume for Silver is even clearer, with a big spike on the down day there for 29th January.
First Hourly Chart
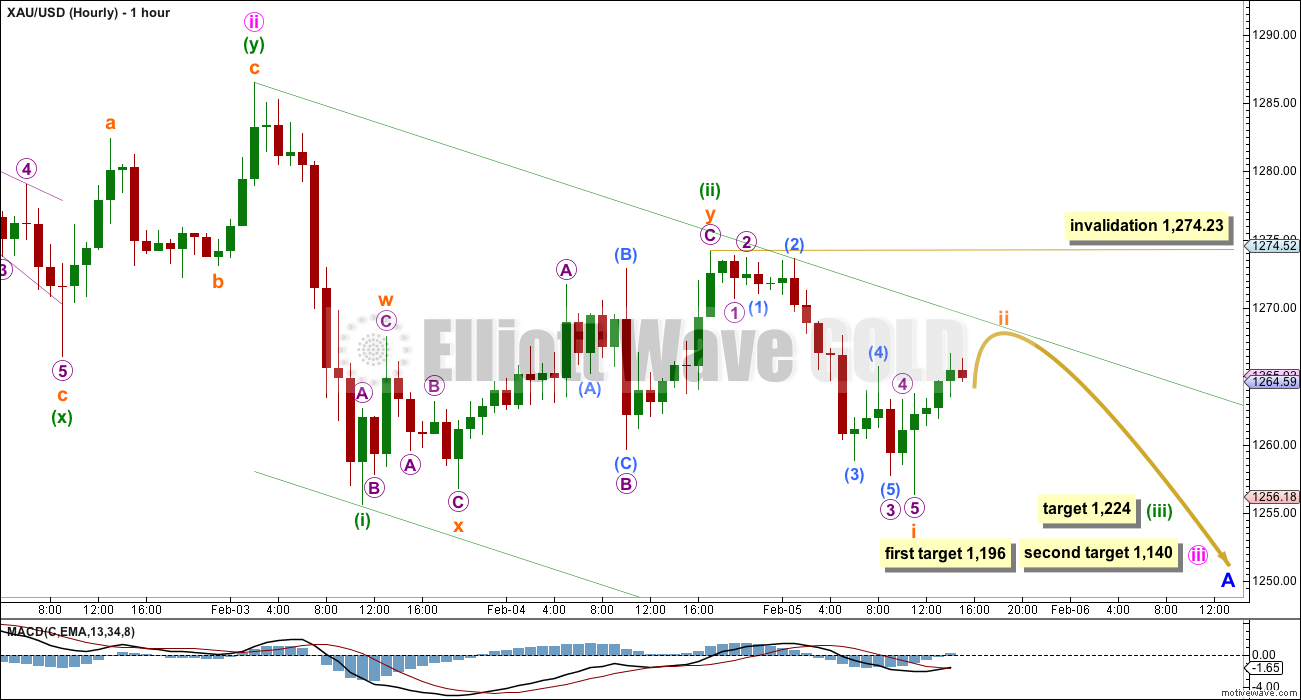
Minuette wave (ii) shows on the daily chart as two candlesticks, one of them green. I would expect the upcoming minuette wave (iv) to also show on the daily chart and to last at least two days.
At 1,224 minuette wave (iii) would reach 1.618 the length of minuette wave (i).
So far the first five down within minuette wave (iii) may be complete: subminuette wave i subdivides perfectly as a five wave impulse. The following correction for subminuette wave ii may not move beyond the start of subminuette wave i above 1,274.23.
I have adjusted the base channel to be a best fit. Subminuette wave ii should find resistance at the upper edge of this green trend channel. Subminuette wave ii should look like a clear three wave movement on the hourly chart. It is unlikely to show on the daily chart as a green candlestick and it should be over quickly.
If subminuette wave ii breaks above resistance at the upper green trend line then the alternate idea below may be correct. Any movement above 1,274.23 would invalidate this first hourly wave count and confirm the alternate below.
Second Hourly Chart
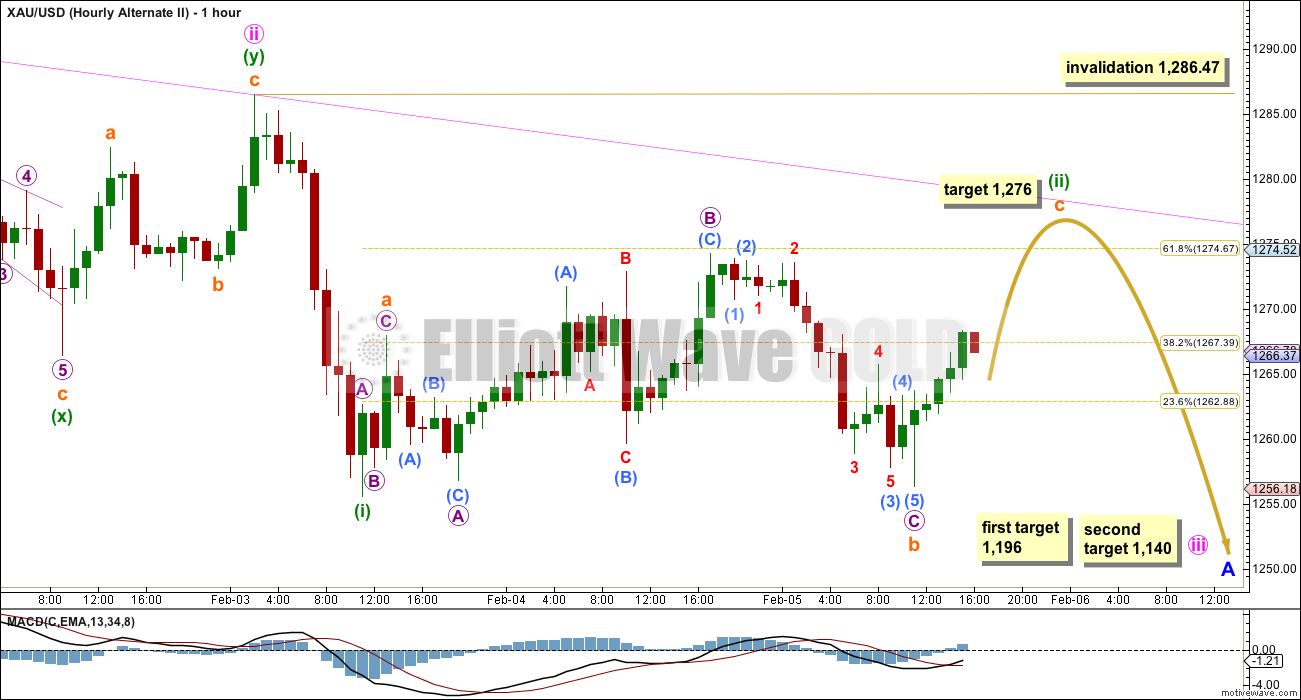
Thursday’s session produced a slight new high and a red candlestick. I am concerned that volume is lower though and a new low was not made. For this reason I am considering this alternate idea.
It is possible that minuette wave (ii) is incomplete and may make a slight new high beyond the previous high of 1,274.23 for 5th February.
This wave count sees minuette wave (ii) as a longer lasting regular flat correction, moving mostly sideways. If this is correct then it may complete in three days total, even in duration with minute wave ii one degree higher. This is entirely possible and would still have the right look on the daily chart.
Subminuette wave b is a 94% correction of subminuette wave a. Subminuette wave a subdivides as a three wave structure, and this indicates a regular flat for minuette wave (ii).
Subminuette wave b is an expanded flat correction: micro waves A and B are both three wave structures and micro wave B is a 156% correction of micro wave A. Micro wave C is just 0.18 short of 1.618 the length of micro wave A.
Subminuette wave c has already moved above the end of subminuette wave a at 1,267.94 avoiding a truncation. Subminuette wave c must subdivide as a five wave structure. At 1,276 subminuette wave c would reach 1.618 the length of subminuette wave a.
Minuette wave (ii) should find resistance at the upper edge of a base channel drawn about minute waves i and ii. It should not breach this base channel.
When minuette wave (ii) is complete then the following downwards movement should show a strong increase in downwards momentum, and it should have the power to break below support at the lower edge of the pink base channel.
Alternate Daily Wave Count
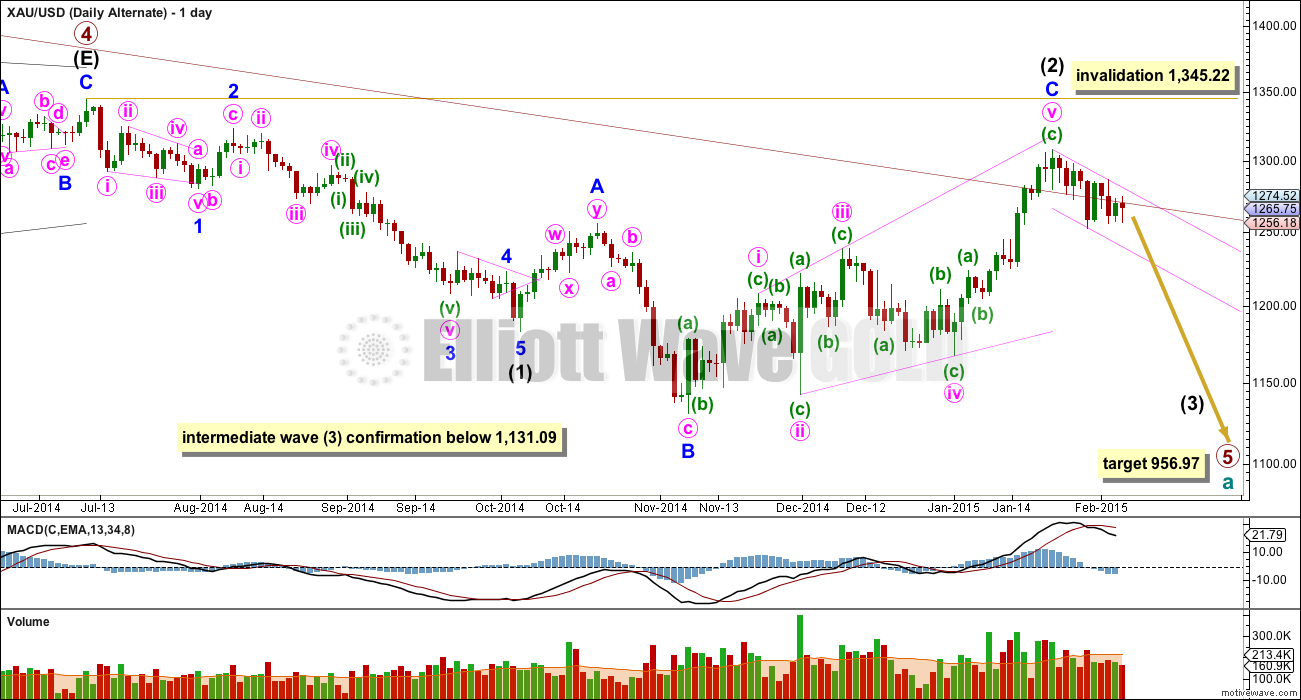
The maroon channel about cycle wave a from the weekly chart is now breached by a few daily candlesticks, and is now also breached on the weekly chart by one weekly candlestick. If cycle wave a is incomplete this channel should not be breached. For this reason this wave count, despite having the best fit in terms of subdivisions, only has an even probability with the main wave count. It will prove itself if we see a clear five down with increasing momentum on the daily chart.
Draw the maroon trend line on a weekly chart on a semi-log scale, and copy it over to a daily chart also on a semi-log scale (see this analysis for a weekly chart).
Within primary wave 5 intermediate wave (1) fits perfectly as an impulse. There is perfect alternation within intermediate wave (1): minor wave 2 is a deep zigzag lasting a Fibonacci five days and minor wave 4 is a shallow triangle lasting a Fibonacci eight days, 1.618 the duration of minor wave 2. Minor wave 3 is 9.65 longer than 1.618 the length of minor wave 1, and minor wave 5 is just 0.51 short of 0.618 the length of minor wave 1.
Intermediate wave (2) is now a complete expanded flat correction. Minor wave C is a complete expanding ending diagonal. Expanded flats are very common structures.
This wave count has more common structures than the main wave count, and it has a better fit.
Within an ending diagonal all the sub waves must subdivide as zigzags. The fourth wave should overlap first wave price territory. The rule for the end of a fourth wave of a diagonal is it may not move beyond the end of the second wave.
Although Gold almost always adheres perfectly to trend channels, almost always is not the same as always. This wave count is still possible. The trend channel breach is a strong warning that this wave count may be wrong and we need to heed that warning with caution at this stage.
A new low below 1,131.09 would confirm that a third wave down is underway.
When the first 5-3-5 down is complete on the daily chart this wave count would see it as minor 1-2-3 and the main wave count would see it as minor A-B-C. The following upwards movement will tell us which wave count is correct. If it moves back into price territory of the first 5 down (minor wave A on the main wave count and minor wave 1 for this alternate) then it can’t be a fourth wave correction so the main wave count would be correct. If it remains below the price territory of the first five down then it would be a fourth wave correction and this alternate would be correct. This divergence will not begin for a few weeks.
At 956.97 primary wave 5 would reach equality in length with primary wave 1.
Intermediate wave (2) may not move beyond the start of intermediate wave (1) above 1,345.22. If this invalidation point is passed this wave count would be fully invalidated.
The short term structure, targets and invalidation points are still the same for both wave counts at this stage. They probably won’t diverge for a few weeks. In order to keep the number of charts down to only those necessary I will not publish separate hourly charts for this alternate daily wave count today. It would be exactly the same as the two hourly charts for the main wave count.
This analysis is published about 04:40 p.m. EST.
I was waiting for this call.
Few days ago I posted EW expert commenting on some other EWvers unability to make calls???? remember!!!
ON FEB 4 this expert posted his EW call for gold. I just grinned in musing.!!!
This should be be musing to you all also:
His call: “RE: Gold I’m with the short term bulls, and i think we head to the big blue blox.. sweet spot is the smaller blue box 1315-1330 but we could
quite easily make a double top at 1308 or even a bigger DT at 1345..”LOL
Yes I agree there are lot of EWvavers but none like LARA!!!!!!
Thanks Lara.
A lot of us just pay for advice… We don’t need all of this excess rah, rah all the time. It’s gets to be very irritating…
papudi I appreciate your feedback on other EW analysts.
Here Gary Wagner EW expert for Kitco just forecasted this morning before the US Jobs report that as long as gold stayed above 1,255 that gold would go up to 1,355.
The gold charts portion starts at 4:40 in the video.
http://thegoldforecast.com/video/golds-january-effect-where-it-goes-here-kitco-news
Did wave 4 of (iii) just end at 1,236.26 at 1:23 pm? I hope so then 5th wave may start down?
Appears 1233/28 is holding to take out 1242 for 1247…
Are you are saying 1228 was bottom this run today that we wont drop below 1228 that all 5 waves are complete now for minuette wave (iii)?
I think we still have a 5th wave down to go to Lara’s 1224 target soon today?
No not suggesting 1228 is the bottom of this run…. looks like some sort of upside correction with 1228 holding…. expect gold price to come back down and break below 1228-25….
May be the low for today, but Monday should see a new low quickly.
Just guessing here, but would say that wave 4 of iii could continue for another 12 hours or so (into early Mon EST) to be similar in duration to ii. That could take gold back into the 1240s (0.382), before dropping back down again. But I’ll let Lara address that, since iii might not even be over.
This is exactly as I would put it Matt.
Richard and Matt
Lara wrote above: I would expect the upcoming minuette wave (iv) to also show on the daily chart and to last at least two days.”
Lets wait for Lara report this evening.
I don’t think minuette wave (iii) is over yet.
I think subminuette wave iii may have just ended. Subminuette wave ii lasted 14 hours and does not show on the daily chart, so I would not expect subminuette wave iv to show on the daily chart either.
Only the fourth waves one and two degrees higher; minuette wave (iv) and later minute wave iv, should show up on the daily chart.
So short term sideways, invalidation point 1,256.37.
This is great call no one had this call with such a conviction.
Actually one analyst at EWI did make a similar call, expecting gold to approach the 1220 level.
Lara, ( posted also on GDX page)
Assuming that your GDX Daily count is correct, how will minor wave 3 fit within primary A’s target zone ($14.13)?
If I project blue 3 to equal “only” 100% of blue 1 that brings us down to around $12 and if I project blue 3 at a typical 161.8% of 1 the answer brings us close to zero and it’s sub-level after that.
Even it this turns out to be a tight ending diagonal, blue 3 has to edge below $16.45 and thats only a couple of dollars away from your target… The ending diagonal would have to have a very tight count…
Thats a really good point. That target may actually be too low.
At this stage I can only calculate that target at intermediate degree.
I haven’t updated my GDX charts, has it made a new low below 20.42 to invalidate the alternate?
If it has then I’ll be calculating a target for minor wave 3 now that the situation is clearer. Which means I’ll have to play with that target for intermediate wave (5).
Here is gdx hourly chart
Lara, GDX has not made a new low below 20.42 so or a new high above 23.22 so still valid.
Is selling the shorts and buying the longs the way to go now?
I don’t like going against the trend, i just sold half of my shorts and will wait for 4 to arrive to go back in full.
Lara is like Einstein. She is the Queen of the Elliott Waves.
Are we in wave 5 of wave (iii) yet. Once we reach target then,
“I would expect the upcoming minuette wave (iv) to also show on the daily chart and to last at least two days.”
For me that would be something I would not want to be in with DUST/JDST. Then get back in for the minuette wave (v) down to iii circle, 1,196 or 1,140
Lara would clarify.
No, I think we are only in subminuette iv (orange) of minuette (iii) (green)
Look like we are in wave 4 now, what do you guys think?
yahoo has 1228.40 as the low, pretty close to 1224 target, or can we get down closer to the target today? We will see.
That’s what I am wondering – has 4 begun from 1228.60 low for possible 1242-1256 or is gold price just taking a small pause to head back down for 1222…. I think back down subject to break below 1225
if i got lara right wave 4 cant move into wave 1 price territory.
that means 1252 would be invalidation
1,256.37; the low of subminuette wave i (orange)
Well done team! This is great stuff…. All that is needed now is a break below 1233… Woo Hoo what fun…. 🙂
Still doesn’t feel like a wave iii…..
Just kidding. This is kind of fun to watch.
My entry today 🙂 breakout above 200 ticks
Richard
More info on indicator TSI trading
http://thetsitrader.blogspot.com/p/6-buysell-techniques-using-true.html
Hi.
Lara’s awesome.. I have not seen anyone better than lara.
I have posted this chart before.. XABCD bearish gartley in 4h.
Target will be 1221 according to this
Waseem–Interesting chart,, what is the source?
Harmonic pattern i made this chart
Waseem –Congratulations, on your skill. What is “harmonic pattern” is it a market tool to be learned like EW? Would you point me to a website for more information?
http://harmonictrader.com/price_patterns.htm
harmonictrader.com/price_patterns.htm
Search Harmonic trading patterns on google.
i tried to post the website but that was not allowed
Waseem–Thanks.
Well , this is amazing I have to say . Could not have predicted it myself unfortunately . Still learning to trust these counts . Assuming we close like this of course . Pretty strong sell-off so far though .
Use the invalidation points; they show you how much you risk trusting my analysis. If the invalidation point is too far away from price then the risk is too high. If the invalidation point is close by then the risk is lower.
Chapstick
You were right on money for wave ii completion and beginning of wave iii.
“If Lara’s wave count is correct, the jobs report tomorrow AM should initiate the move down to $1225ish no matter how you slice it.
So this is beginning of 3rd wave. Impressing
Any advise on miners?? Market is up Do any one think miners are going to follow GM???
This could be a recipe for disaster for the miners. Earnings season is 1-2 weeks away for them. Recall what happened in late October.
Only challenge I have for this is miners costs have almost halved with Oil prices. Miners profits could surprise a few.
Cost going down as well as margin dropping fast with gold going down. They hedge positions.
Lara – Great gold dropped in 5 min below 1255.
Freefall – where does it stop???
And there she goes just as predicted below….jobs # to fuel downside fire
At 6:16AM EST gold is just below the green trend line on main hour chart. The fun will start at 6:45AM to 7:15AM.
Great Lara gold is holding the trend line .
Gold has strong seasonality. Gold makes lower highs during Jan to Jun season til bottoms in summer. Last year the seasonal high came in March and rest is in the record.
This year EW has indicated high came in Jan 1308. Feb is always doldrum month drifting low. Next high Apr to May and then summer low.
So gold has entered season of lower highs and lower lows.
Hi , how are you all , pls i new member , any body advice me either to sell or hold ( today )
Looks like there is no reliable correlation between GDX and the S&P.
Chart courtesy of Ron Henry on Stocktwits.
Rambus post on the Miners
http://www.safehaven.com/article/36602/wednesday-reportthe-chartology-of-the-hui-past-present-and-future
He is flat. Just sold 3xetf miners and DSLV.
Good to know. You must be a member?
Yes. He is good hard working just like Lara. Spits out many charts all day long every day.
I am glad I found EWG. Lara’s work compliments charts.
Gold is difficult to nail down during this transformation. Gold goes down about $35 in 11 days and GDX only goes down at close .42 to $22.58 and is close to $23.22 the point above which GDX is strongly favoured to be moving up in GDX alternate wave count to $27.78. What may be a very important US non-farm payrolls report for January due out at 8:30 am may be the straw that broke the camels back and takes down gold today or prolongs the suspense a few more days or even uplifts gold and the miners. Trying to catch a golden falling knife is not for the weak at heart.
GDX has shown relative strength vs. Gold. If Gold moves down as expected, GDX should also move down at least some. If the relative strength continues, the bullish scenario will likely play out for both GDX and Gold once the correction is over.
This should add value here. It is known that 9ema acts as support/resistance.
Gold daily line chart is trading below 9ema and now is resistance.
Lara’s target 1223 is the BO from NL of HnS. Gold is expected to visit this soon.
papudi, Your chart is quite impressive. Full of information. Even looks like gold has been walking the fence lately.
JUST A VIEW: With upside risk 1285/95, not expecting to see gold price get past 1272-73 with the high probably already in at 1268.10…. It’s probably never too late to initiate shorts for a break below 1259 and it would be nice to see a low below 1252.10 low for 1248 and lower….
If Lara’s wave count is correct, the jobs report tomorrow AM should initiate the move down to $1225ish no matter how you slice it.
On my computer there is no sound.
Speaker is not muted and volume is high.
Need help?
Restart? That usually works.
Thank You Lara. I agree with all potential move.
February 5th published about 04:40 p.m. EST.
richard you do realize that if people are reading your comment, they know the update is published. Please quit clogging up the blog with no value comments like this one. It would be much appreciated to everyone.
I was reading the comments and noticed the new analysis was out and I hadn’t seen the email yet. The email is often delayed. Yesterday the email went out 35 minutes after the analysis was out. That time could make a difference to those doing after hour trades. If you have too many comments you may chose to disconnect the automatic transfer of comments. I don’t have mine set up.
Anyways you’re welcome.
As a new member I see value in Richard’s posts generally and specifically the value in confirming the publication time.
mortgagefree
I do try to help myself and others to make profits in these complex, challenging times. Thank you for your kind comment.