
It looks like the third wave is finally over at 43.58, just $0.85 below the final target calculated at 44.43.
Summary: I expect choppy overlapping movement for about 28 to 34 weeks in total (another 26 to 32 weeks following the date of this analysis) for a sideways fourth wave correction at intermediate degree. The target for it to end is 53.61 to 59.03. It may include a new low below 43.58. US Oil has entered a consolidation phase.
Click charts to enlarge.
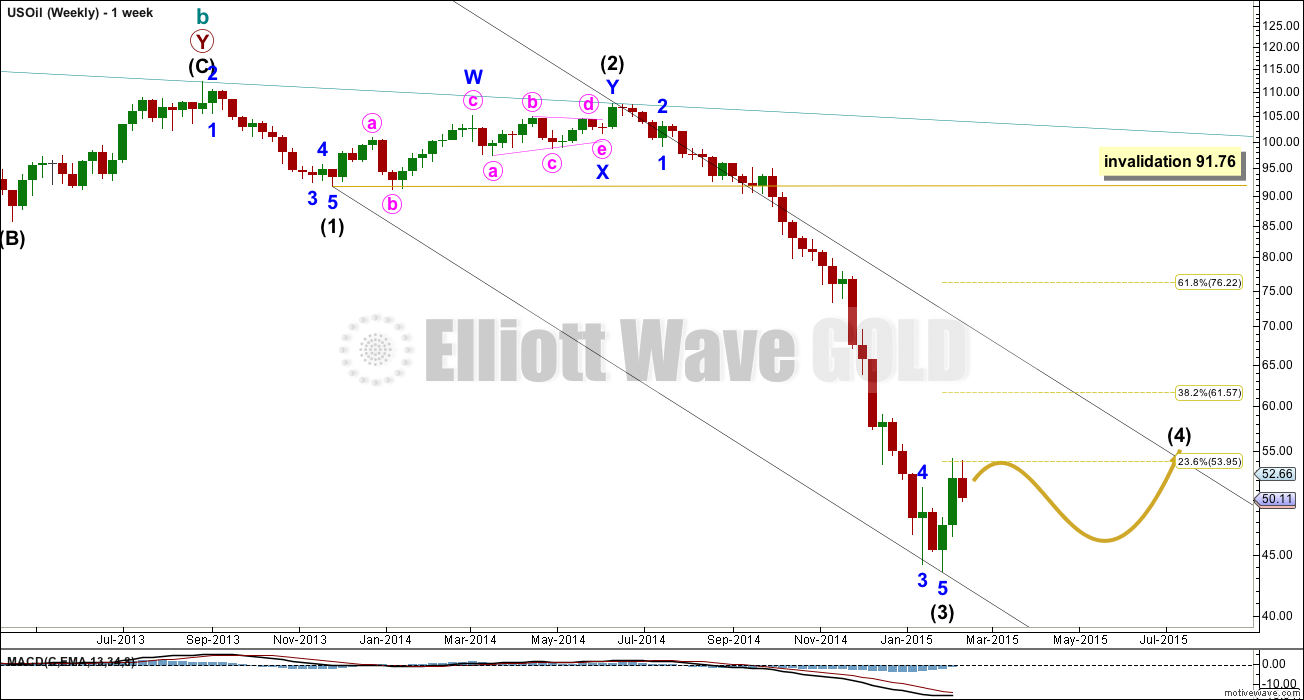
Intermediate wave (4) may not move back into intermediate wave (1) price territory above 91.76.
Draw a channel about this downwards movement using Elliott’s first technique: draw the first trend line from the ends of intermediate waves (1) to (3), then place a parallel copy on the high of intermediate wave (2). I would expect intermediate wave (4) to find resistance at the upper edge of the channel, and it may end there.
Intermediate wave (2) was a deep 78% double combination. Given the guideline of alternation I would expect intermediate wave (4) to be more shallow. It may be a zigzag, flat or triangle most likely. If it is an expanded flat or running triangle it may include a new low below its start at 43.58.
Intermediate wave (4) would be most likely to end at either the 0.236 or 0.382 Fibonacci ratios of intermediate wave (3).
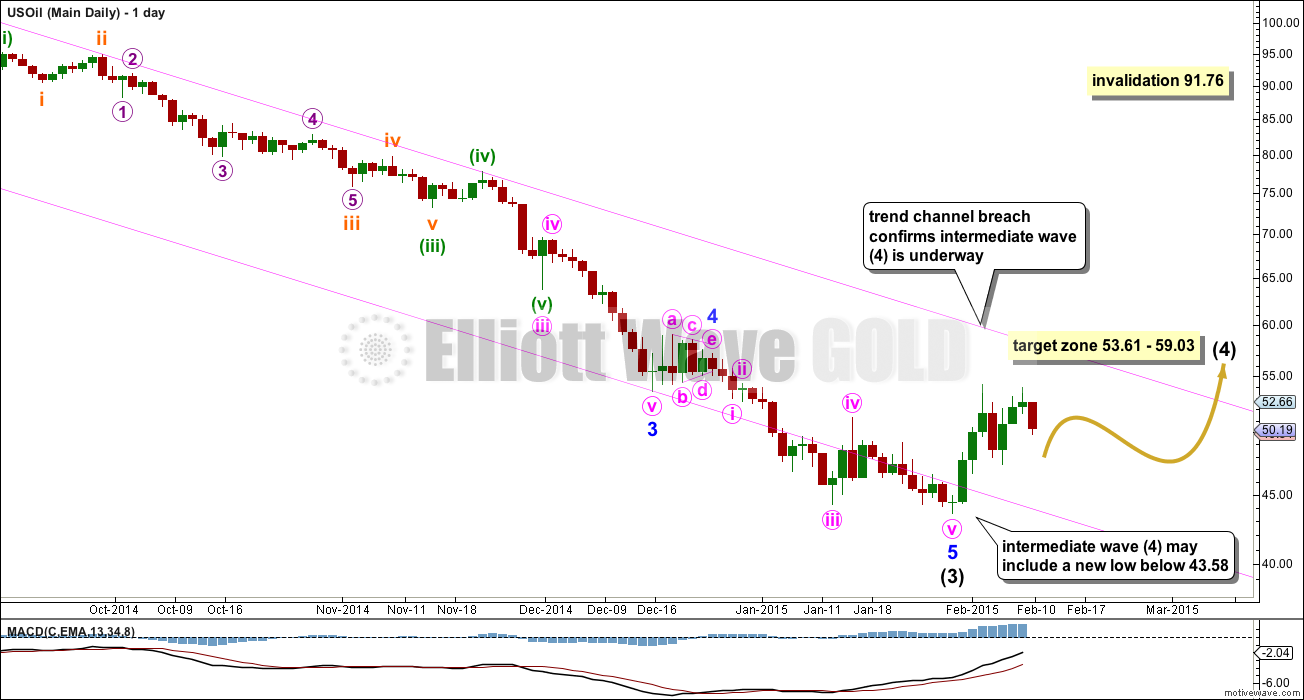
Intermediate wave (4) may end within the price territory of the fourth wave of one lesser degree. Minor wave 4 price territory is from 53.61 to 59.03. This indicates a very shallow correction for intermediate wave (4) may be more likely, reaching only to the 0.236 Fibonacci ratio about 53.95.
The pink channel is drawn about intermediate wave (3) as a best fit. When this channel is breached that would provide further confidence in this wave count.
I expect intermediate wave (4) to last about the same duration as intermediate wave (2) which was 28 weeks. It may be a little longer, lasting a Fibonacci 34 weeks.
Minute wave i is over and minute wave ii is underway, beginning two days and $6 earlier than expected.
Laura, with the recent new lows would it alter your wave count?
Hi Lara
Does Oil not lend it self to EW? Just wonder why it gets so little attention compared to GDX etc? Personally I’d subscribe to an Oil service if you had one.
Lara just declared that wave (3) is complete. Oil has entered wave iv invalidation 91.07.
Oil’s HnS has the same look like gold’s HnS previously posted before rocketed to 1307.
All momentum indicators show bullish divergences with the price.
To play long side UWTI, UCO can be used. Feb 15.
As these intermediate waves are so big do you think there is any chance they could actually by primary waves?
Good point. I should probably move everything up one degree.
how that will affect numbering in the chart?