
Downwards movement continues, although yesterday’s hourly Elliott wave count expected some upwards movement first which did not happen.
Summary: The trend remains down. Two more small fourth wave corrections should complete, and the current one may end about 1,176. I expect another red candlestick for Wednesday’s session. Overall, downwards movement should continue with a decrease in momentum, although we should still look out for a possible strong fifth wave typical of commodities. The target for minor wave 3 remains the same at 1,055.
Click on charts to enlarge.
Main Daily Wave Count
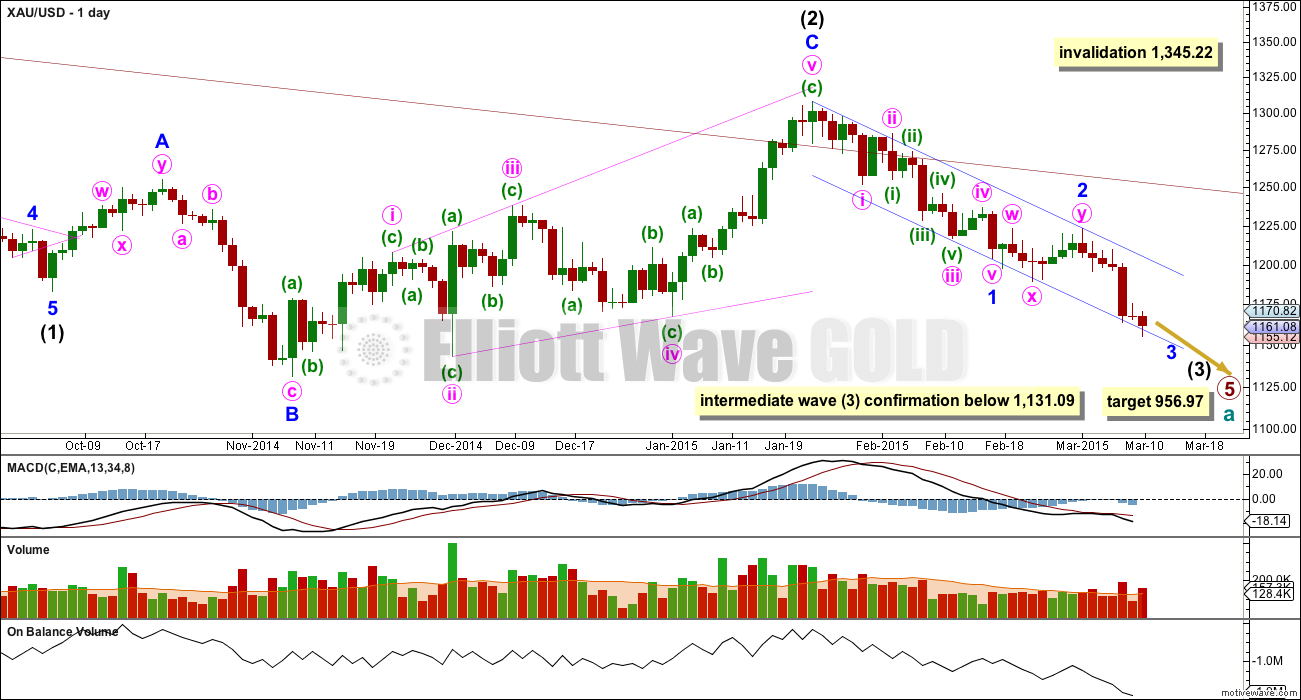
This main wave count sees Gold as still within a primary degree downwards trend, and within primary wave 5 intermediate wave (3) has begun. At 956.97 primary wave 5 would reach equality in length with primary wave 1. For Silver and GDX this idea, that the primary trend is down, is the only remaining wave count. This main wave count has a higher probability than the alternate below.
Within cycle wave a primary wave 1 lasted a Fibonacci 3 weeks, primary wave 2 lasted 53 weeks (two short of a Fibonacci 55), primary wave 3 lasted 37 weeks (three more than a Fibonacci 34), and primary wave 4 lasted 54 weeks (one short of a Fibonacci 55).
Primary wave 5 is now in its 35th week and the structure is incomplete. The next Fibonacci number in the sequence is 55 which would see primary wave 5 continue for a further 20 weeks, give or take up to three either side of this number. Although I am expecting primary wave 5 to be equal in length with primary wave 1 that does not mean it must also be equal in duration.
The maroon channel about cycle wave a from the weekly chart is now breached by a few daily candlesticks and one weekly candlestick. If cycle wave a is incomplete this channel should not be breached. The breach of this channel is a warning this wave count may be wrong, and so I will still retain the alternate.
Draw the maroon trend line on a weekly chart on a semi-log scale, and copy it over to a daily chart also on a semi-log scale (see this analysis for a weekly chart).
To see daily charts showing the whole of intermediate wave (1) from its start at 1,345.22, and an explanation of why this main wave count has a higher probability than the alternate, see the last analysis showing charts to that date here.
A new low below 1,131.09 would confirm that intermediate wave (3) down is underway.
Intermediate wave (2) may not move beyond the start of intermediate wave (1) above 1,345.22. If this invalidation point is passed this wave count would be fully invalidated.
Within intermediate wave (3) minor wave 1 is a completed impulse lasting 18 days. Minor wave 2 is a completed double flat correction which lasted 9 days, exactly half the duration of minor wave 1. Because this is a second wave correction within a third wave one degree higher I would expect it to be more shallow than normal.
Minor wave 3 may total either a Fibonacci 21 or 34 days, depending on how long the corrections within it take. So far it has lasted only 6 days.
Draw a base channel about minor waves 1 and 2. Minor wave 3 should have the power to break through support at the lower edge. Along the way down upwards corrections should find resistance at the upper edge. Copy this channel over to hourly charts. While the lower edge continues to provide support the alternate wave count should be considered as a possibility.
Since the top labelled intermediate wave (2) volume is still strongest on down days.
On Balance Volume continues to agree with the downward trend for price.
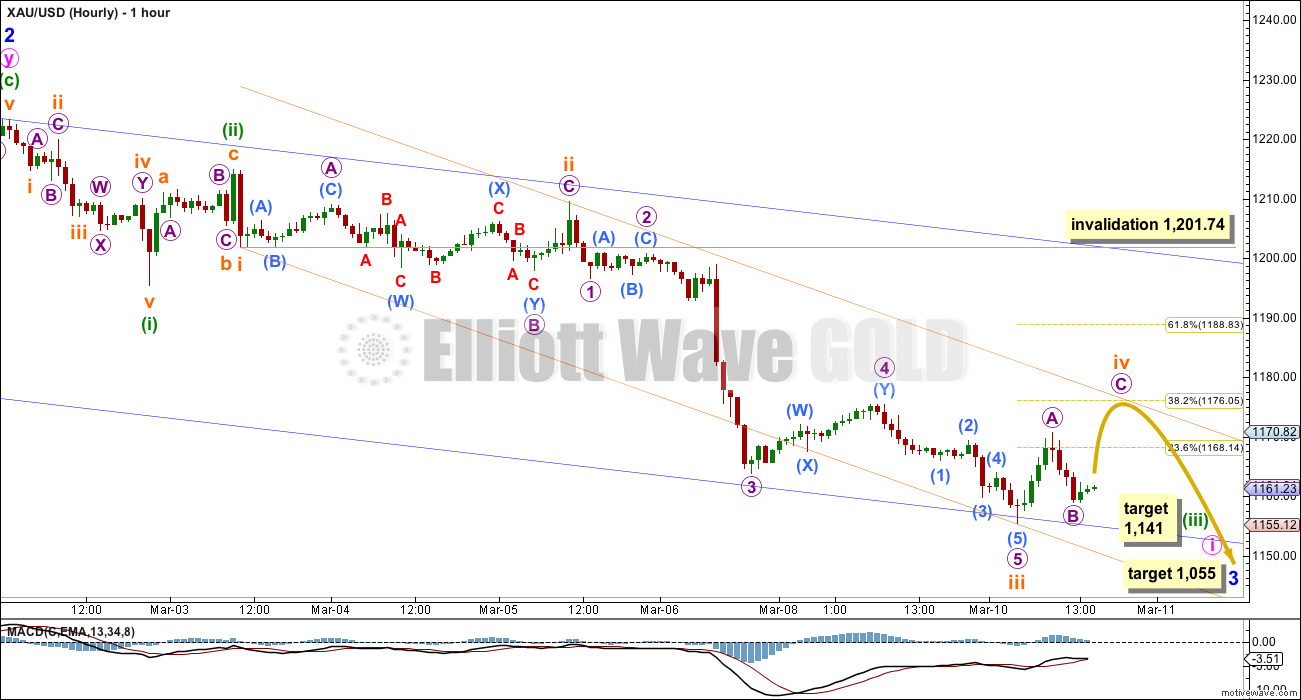
I am moving the end of subminuette wave iii lower because here the wave count has better proportions, avoids “squished up” fourth and fifth waves at the end, and has good fibonacci ratios.
Subminuette wave iii is 1.74 short of 4.236 the length of subminuette wave i.
Ratios within subminuette wave iii are: micro wave 3 is 3.15 longer than 2.618 the length of micro wave 1, and micro wave 5 is just 0.85 short of 1.618 the length of micro wave 1. Micro wave 5 subdivides nicely as a five wave impulse with submicro waves (1) and (3) very close to equal in length.
Subminuette wave ii was an expanded flat correction. Within it micro wave B was a 152% correction of micro wave A and micro wave C was just 0.27 short of 1.618 the length of micro wave A.
Given the guideline of alternation subminuette wave iv is most likely to be a zigzag or zigzag multiple. So far it looks like it may be unfolding as a zigzag. It is most likely to be shallow, ending about the 0.382 Fibonacci ratio at 1,176. If it is a zigzag then within it micro wave B may not move beyond the start of micro wave A at 1,155.35.
There were no green candlesticks or doji for subminuette wave ii on the daily chart. Subminuette wave iv is very likely to also not show on the daily chart so I expect another red candlestick for Wednesday’s session. If subminuette wave iv is a zigzag it could be over relatively quickly as zigzags tend to be more brief structures.
Draw a channel using Elliott’s first technique about minuette wave (iii): draw the first trend line from the lows labelled subminuette waves i to iii, then place a parallel copy on the high labelled subminuette wave ii. Subminuette wave iv may find resistance and may end touching the upper edge of this channel. Sometimes fourth waves overshoot these channels, but in this case I expect that is less likely as subminuette wave iv should be shallow so that it exhibits alternation with the deeper subminuette wave ii.
Subminuette wave v may end about the lower edge of this channel.
The channel looks perfect. Micro wave 3 overshoots it, which is very typical.
Subminuette wave iv may not move into subminuette wave i price territory above 1,201.74.
When subminuette wave iv is a completed three wave structure, and looks like a clear three on the hourly chart, then the downwards trend should resume. The next wave down should be subminuette wave v which would complete a five wave impulse for minuette wave (iii). It is also possible that this next wave down, a fifth wave, could possibly be swift and strong, as Gold exhibits swift strong fifth waves typical of commodities reasonably often.
At 1,141 minuette wave (iii) would reach 2.618 the length of minuette wave (i).
When I know exactly where subminuette wave iv has ended I can add to the target calculation for minuette wave (iii) at a second wave degree, and so at that stage the target may widen to a small zone or it may change.
Alternate Daily Wave Count
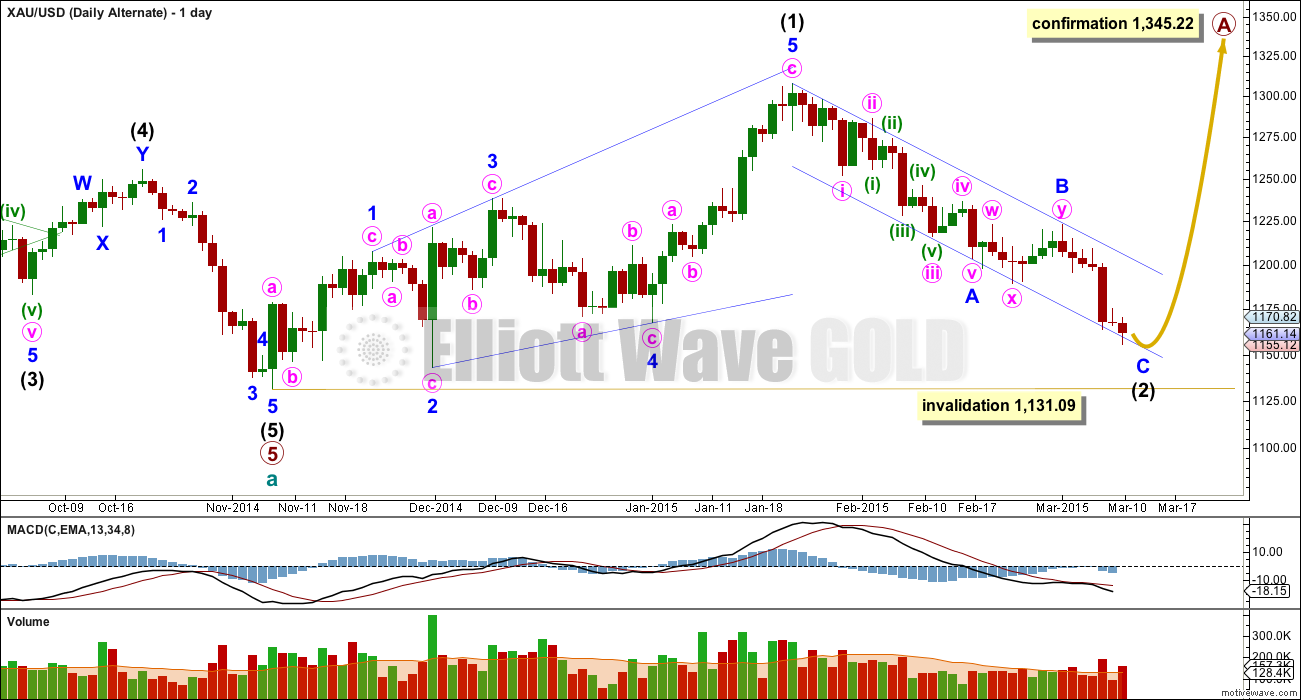
At this stage I judge this alternate wave count to have a lower probability. The structure of downwards movement, and momentum, will determine which wave count is correct over the next few weeks. At this stage they both expect more downwards movement so there is no divergence in the expected direction.
This wave count sees a five wave impulse down for cycle wave a complete, and primary wave 5 within it a completed five wave impulse. The new upwards trend at cycle degree should last one to several years and must begin on the daily chart with a clear five up.
The first five up may be a complete leading expanding diagonal. Within leading diagonals the second and fourth waves must subdivide as zigzags. The first, third and fifth waves are most commonly zigzags but they may also be impulses. This wave count sees minor waves 1, 3 and 5 as zigzags.
Leading diagonals are almost always followed by deep second wave corrections, sometimes deeper than the 0.618 Fibonacci ratio. Intermediate wave (2) is now deeper than the 0.618 Fibonacci ratio and the structure of minor wave C is close to completion.
For this alternate wave count minor wave C down must subdivide as a five wave structure. The hourly chart would see the subdivisions exactly the same as the main wave count above, so to keep the number of charts at a minimum I will publish only one. For this alternate at 1,159 minor wave C would reach 0.618 the length of minor wave A.
Minor wave C may come to a very slow end, with price hugging the lower blue trend line. An overshoot of the trend line for minor wave C is also possible, but less likely.
Intermediate wave (2) of this new cycle degree trend may not move beyond the start of intermediate wave (1) below 1,131.09.
This analysis is published about 03:42 p.m. EST.
I’m considering subminuette wave iv was a triangle, not a zigzag, and it’s over.
This downwards wave looks like subminuette wave v.
I’m so sorry everyone. I shouldn’t have assumed subminuette wave iv would be a zigzag, I should have remembered the possibility of a triangle, it still provides nice alternation with the expanded flat of subminuette wave ii.
I think micro wave B just fell short of 1,155.35. @ 1,153.83 What do you think
Above Lara wrote: “If it is a zigzag then within it micro wave B may not move beyond the start of micro wave A at 1,155.35.”
Gold price dip below at 1147.58. So WKL may be right it is not zigzag but another expanded flat. ???? HMMMM
Am I right WKL?
Relax, As our most gifted Guru has stated”The target for minor wave 3 remains the same at “1,055.http://www.marketvectorsindices.com/Indices/Hard-Asset/Market-Vectors-Global-Junior-Gold-Miners/
Following miners now is dangerous as they may just be quickly or slowly adjusting to changes in gold for example once gold stops moving up they follow fast but continue increasing for awhile (sometimes many hours) which gives a false signal of miners going up to those who want to follow miners.
Following miners up may work when markets have bottomed for awhile but not today or risk getting burnt.
Yes especially when you are going against a possible third wave in gold!
I think we will move to the alternative in the coming weeks and will be playing against trend for now.
You might be right, that is a possibility.
It is possible. My calculations show that price movement will not diverge until the supposed end of Minute 4. If price moves down from Minute 4 and breaks 1131.09 on the way down to 1055 (for completion of Minor 3 in the main count), then the alternate is invalidated. If, at the supposed end of Minute 4, price ignores that point and moves higher, then the alternate becomes an almost certainty.
I follow two excellent analysts – Lara and another. What Lara has highlighted as the alternative is what I am working to. It has paid close to £12k today.
Congrats that’s a nice day.
Does your guru see a turn ahead? My charts see a potential medium turn for later this week. I use gann, cyclical geometry & esp. trendlines, not EW so much. Most of gold’s move down this move is dollar-related; so watching the euro if it closes back up over 1.0547 should relieve dollar strength at least temporarily.
Hi J – I will be going long from the next move down. Targeting a price at 1143.
I ran a 1 month, 5 day, 1 day comparison of gold, silver and gdx. All are on the same path, miners got ahead to the downside so are due for either a pause or some small upside but to bet against the trend is risky.
Hard to see gold price past 1154-60-63 now… Or is there any likelihood of higher? Thanks
I believe so Syed, and clearly the miners do also. I am trying to buy into JNUG having sold at 15.4. Made a quick killing, but I believe the move now is upwards in line with the alternative.
JNUG – Moving upwards now, relative strong movement. Miners usually lead and believe we can expect a move north now.
WOW – JUST WOW…
Is anyone else looking to go long?
Miners have just moved strongly and I take this as a sign of expected direction of travel.
Lara Lara, where are you?
Lara from New Zeland Now time 4:00 She is sleeping
ouch. and I’m trying to wake her up! darn!
🙂
don’t worry, my computer won’t wake me up. i think subminuette wave iv is over as a triangle and subminuette wave v is almost complete. the target is 1,142
well ya know, we might have to fix that. You know… put a special song in that computer that goes off when the EWG community is trying to roust you. JUST KIDDING! :):)
thanks zakopiec!
Lara, after you’ve had your morning cofee do you think you could please update us with and intra-day?
Lara, is it possible for the alternative to be correct, for us to move to $1360 and then still move sub $1000 this year? I ask as this is being pitched by an analyst I also respect and follow closely. Could this happen?
yes, if cycle wave b is a flat correction, running triangle or combination.
the horrible thing about b waves is…. there are so many structural possibilities, over 13. and in the early stage it’s impossible to tell which one will unfold.
cycle degree b waves are so hard to get right, multiple alternates will be required when it arrives.
As ever Lara, honest and clear. Really appreciated.
that’s what i think… as it has not been able to break 1164.. so 1149 on hourly chart… and if that breaks 1130 next hourly support of trendline…
1143 on 4hour chart
As hourly support holds.. so it can move to 1258-1260 and then make a move to 1141-1143.. and then from there it can break upwards in falling wedge…
Wow, are we in wave 5?
Great question. Hope the wave counters will get to counting because I sure don’t know!
There are 2 possibilities.
(1) We had a very short subminuette 4 which ended at the point Lara labelled A at 1170.82. It was much shorter than she thought. We are now completing subwave 3 of micro 5 on the way down to 1141 precisely.
(2) We have a much longer subminuette 4, which deveoped into an expanded flat. We are now completing the B wave. The next wave will take us to 1176.
The magnitude of the next wave up could provide a clue. If we move higher than about 1154, it is option (1). If we move past 1154 and reach 1176 then it is option (2).
Smart opinion. I watch how price and wolumen action. Thx
TKL
Nice analysis. How about possibilty of minute wave (iii) completed at 1141 and wave iv just began.
Lara said duration can be longer for this correction
Hi papudi. That is also possible. It would depend on the strength of the move up. If we hit 1176 or higher, it might be correct.
Update.
We hit 1147.75 and reached up to 1154.20, Both scenarios are still valid. I am now watching the drop back. Simply put, if it drops below 1147.75, then option (2) is out and we are in micro 5 of subminuette 5. As of now, option (1), the expanded flat, cannot as yet be ruled out. I feel the rise to 1154.20 is too quick to be micro 4 of subminuette 5. Micro 4 ought to subdivide in three waves.
Any possiblity that 3 extended, does it break any EW rules?
It is possible. Only thing is whether there is still room between the extension and 1141 (provided that price value is sacrosanct). I have greater confidence in a straightforward 5-wave impulse down. It looks neater. Furthermore, 1147.75 is very close to 1.618 times micro 1 which is the normal value for wave 3.
On pumbull chart does not show 1141 low today???
It shows 1147.
1141 is the price value Lara gave for the end of minuette 3. We have yet to reach that. You are right that the lowest point today is 1147 so far.
Are people favouring the alternative here?
GDX Elliott Wave Technical Analysis – 11th March, 2015
by Lara · March 11th, 2015
http://elliottwavegold.com/
Apparently unless you got the email the only way you can get GDX update right now is to SIGN OUT and then you have instant access to GDX update.
TKL
“Why does JDST move 16% on a day that gold moves only a half-percent?”
The clue is the ratio of gdx to gold or GDXJ to gold.
In real time Watch the ratio and any miner index on a split screen in 5 minute intraday period you will notice miner prices move with the ratio.
While gold is study the ratio moves and the price of 3xetfs moves as well.
Ratio means the market place is willing to give valuation of miners in comparison to gold price.
Allied Nevada Gold files for bankruptcy. There will likely be a lot more before the bottom.
http://www.talkmarkets.com/content/us-markets/allied-nevada-gold-files-for-bankruptcy-protection?post=60547
That’s why GDXJ dropped so much yesterday. NAV is big part of the index. Today GDXJ may drop further till the index is readjusted.
Anybody with an hourly count?
No but Lara is expecting 1176 then quick down to 1141 or a small zone then back up to trend line maybe 1170 or a zone?
GDX Elliott Wave Technical Analysis – 11th March, 2015
Lara ·email was sent out at 4:49 am EST. However it doesn’t yet appear on Lara’s site, may be very soon. Remember that GDX charts are not accurate like Gold due to reduced volume and that Gold is in charge not GDX or it’s chart concerns.
Silver is probably a better proxy.
Silver and GDX are not accurate with EW charts due to not enough volume.
Gold follows EW by the book.
I do not get update e-mail.
Too close for comfort. Wondering and eagerly await if gold price can take out 1168/69 which would open up upside risk 1183/90 and would look for Lara’s target 1176 to go short…. Upside move / snap rally is expecting.
On a daily chart Lara is expecting another red candle. That means snap rally to 1176 and down tomorrow.
Hi papudi: The battle ground is here between 1165-69 if gold price can rise above this level which I expect it ought to….
Let’s hope the snap rally is not that snap so that there is time to enter the market when it opens (for larger gains). So far, the going seems to be favourable. The first subwave of micro c took about 9 hours. I am looking to trade JDST again. On Tuesday, it rose a beautiful 16% !
Why does JDST move 16% on a day that gold moves only a half-percent? I imagine it’s because they’re different assets. As gold moved little, I suspect that big JDST move had nothing to do with gold and everything to do with it being the 2nd worse day in months for US stocks, especially diversified mining stocks which lost 4-5% globally.
My point is, I don’t understand why intelligent people trade stocks based on a gold chart. It’s like using a yields chart to trade the dollar. Yes, there is good correlation, but they have differing trendlines, cycles, setups.
I dunno much as i’m just a girl :), but i think
Use gold charts to trade gold
Use dollar charts to trade dollar
Use index charts to trade a stock index.
Btw, the S&P500 VIX rose 11% yesterday, and VIX-based ETF’s rose 22-33%
On a different point, I found Interactive Brokers offers cheap trading in Asia, plus it offers many global markets and products. The downside is that the custodian is in US, which might be worse than for eTrade.
A pleasant surprise is that Interactive charges just 0.1% for currency conversion, which is a fraction of what banks charge.
Cheers.
J. you asked. “Why does JDST move 16% on a day that gold moves only a half-percent?” JDST dropped early in the day and then went up move than 11.76% intraday.
JDST closed up 11.76% and GDXJ down 4.01% x 3X= 12%
You asked, “I don’t understand why intelligent people trade stocks based on a gold chart.” Which stocks are you talking about is it mining stocks or something else?
Mining stocks have more beta coeffiecient movement than gold.
If you like more beta, you can leverage paper gold up to 50X which is like beta on steroids
Of course leverage works both for & against.
Where can you do this J?
Many brokers. Search on gold trading or currency trading. Just be careful, do due diligence and ask here for opinions first.
You can also trade oil and silver at those.
Hi Ms J. The consensus among many traders and analysts is 15.00 for VIX. Once VIX crosses that level, “fear” increases. Once it crosses 20.00, panic sets in. Computer algorithms will signal selling en masse. XIV and TVIX are the funds mainly used for trading VIX. They fluctuate tremendously compared to S&P. This is the scenario in which you are correct. XIV and TVIX should not be used as proxies for trading S&P.
I just mentioned VIX etf’s for fun cuz some ppl like wild erratic rides, lol. I think VIX is a synthetic index derived from the cost of puts or put options. Thus its price responds to the level of market fear or complacency. And QE tends to reduce volatility and the VIX price.
IMO vix isn’t tradeable. Look at a VIX chart, it’s nuts.
To follow-up on before, I found Interactive Brokers in Asia offers cheap trading, plus it offers many global markets and products. The downside is that asset custody is in US, which might be worse than for eTrade.
A pleasant surprise was that Interactive charges just 0.1% for currency conversion, which is a fraction of what the banks charge.
Just thought I’d mention it FYI.
Thanks J. for the information. Banks, E*Trade included, charge between 3 to 4% currency conversion charges. E*Trade has regional HQ in Hong Kong. There is a front office in the banking district in Singapore and they have been very cordial in their dealings. I once did consider Interactive Brokers but they do not have an office in Singapore. All trade is done electronically. Money deposit and withdrawal is through interbank transfer, so there are charges to contend with, other than having to go through a bank. They only have a US number to call to, and you know how difficult it is to get through to automated phone lines.
Thanks for that info. IB has office in HK too.
Any takers on nugt or jnug today for the fourth wave?
At last minute JNUG before closing. Lara gave early clue for a wave c to 1176.
Plus GDXJ having three black crow candles most of the time have a few days of bounce then she goes down from 9ema acting as resistance. Currently price has moved tooooo far from 9ema.
I would be cautious on NUGT and JNUG. They are the worst performers among the leveraged funds this year. They fall fast and are slow to rise. On the other hand, shorting the market via DUST, and better still JDST, is much more profitable. These were the best performing ETFs. To wit, JDST rose 16% for the duration of micro B of sub minuette iv while DUST managed less than 7. Let’s hope they repeat their performance on Wednesday for subminuette 5. That drop is larger than micro B’s.
I think you mean if you buy NUGT or JNUG you are investing 3X against the trend, however if they are moving up towards 1176 and you are confident of that then they should do the job well. If less confident than use GDX/GDXJ.
Hi Richard. You are absolutely correct. These miner funds should be traded WITH the trend. NUGT/JNUG perform well in uptrends, and DUST/JDST in downtrends. For countertrend rallies, they can be traded but caution need to be exercised.
When I replied to papudi, I assumed he knew that we are in a primary bear trend, and just wanted to remind him that going against the trend with leverage is hazardous. That people lose money is because of greed (2X or 3X leverage plus high beta coefficient). It is also due to ignorance, as Ms J. pointed out, that people trade these funds solely based on a gold chart.
If the alt daily count is playing out, I expect $1151 which is the .887 retrace to stop decline. I still favor it slightly because of trendline breach on the main wave count which is cut and dry. Lara’s concern for the running flat count on alt count is less concerning to me because it’s not cut and dry.
An excellent point.
When minute i for the main wave count and minor C for the alternate is a complete five wave structure, then how high the following movement goes will tell us which wave count is correct.
The price point to differentiate them is 1,223.33. A new high would invalidate the main and confirm the alternate.
But well before price gets to that point, if the upper blue trend line is breached the main wave count would substantially reduce in probability and the alternate would increase. Because a lower level second wave correction should not breach the base channel drawn about a first and second wave one or more degrees higher. This almost always works, but occasionally second waves don’t recognise base channels.
Could minor C for the alternate be over already? If so, I calculate it to be within 1.00 of .618 the length of minor A. The current hourly chart labels it as a completed 5 at subminuette degree and if that labeling were raised 2 degrees it would fit.
Lara
Amazing clarification, thanks for sharing. We will all be watching that closely. Any idea which day minute i may begin up? Is it next week?
I would take the opposing view that the channel breach is absolutely not cut and dried.
On my charts, using a semi-log scale the weekly bar incursions are still touching the channel.
Although semi-log is preferable on a long term chart, the channel drawn on a linear scale is clearly not breached. Where’s the rule that says a linear channel is definitely wrong?
The semi-log channel breach is the ONLY feature wrong with the main count. The alternate has several features that don’t look right.
There are only 3 rules in EW that could be called ‘science’. The rest is art.
We’ll find out soon enough.
Yes breach not good for main daily. However alternate daily has many problems, which Lara continues to feel is more and more less probable. She has been forecasting gold for many years so I put my money behind her forecast, although I do watch it all day long.