
The fourth wave ended not as a triangle, as expected, but as a double zigzag.
Summary: The final fifth wave down is underway. The target is at 1,136 and this may be met in one to three more days. The invalidation point is at 1,164.20. If the invalidation point is passed before the fifth wave is over then I would expect a deep second wave correction would have arrived to last either three or five days in total.
Click on charts to enlarge.
Main Daily Wave Count
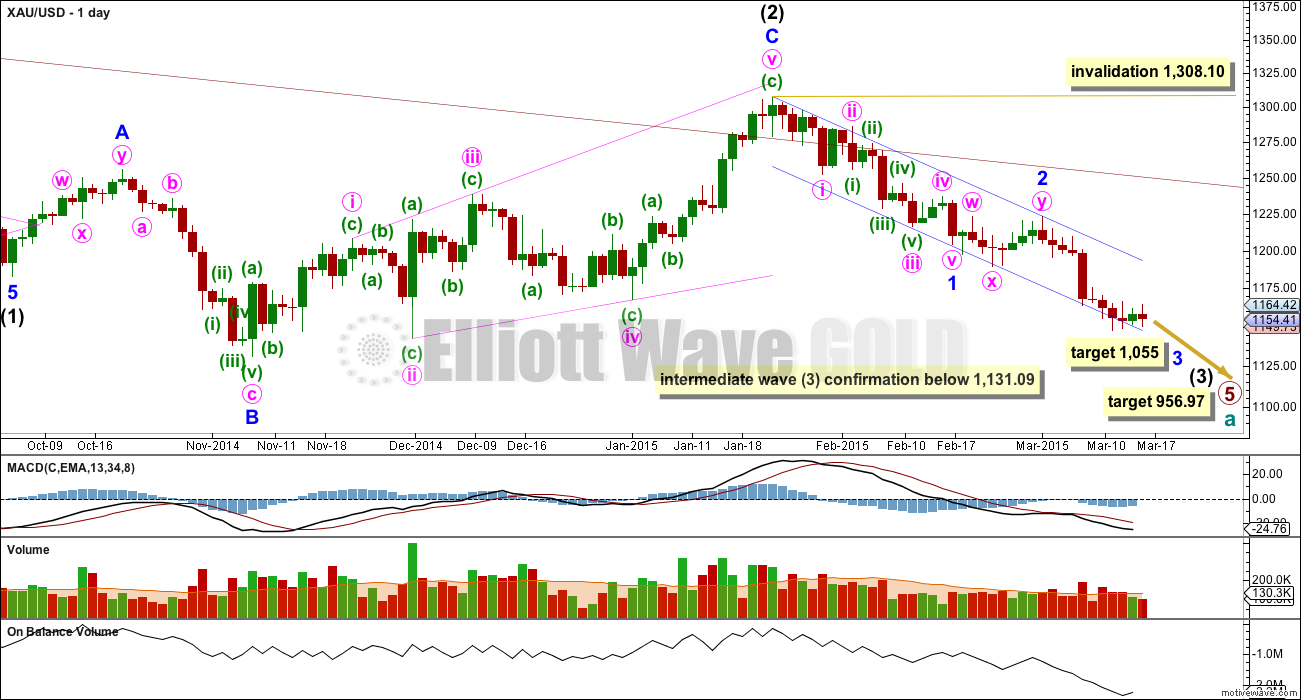
This main wave count sees Gold as still within a primary degree downwards trend, and within primary wave 5 intermediate wave (3) has begun. At 956.97 primary wave 5 would reach equality in length with primary wave 1. For Silver and GDX this idea, that the primary trend is down, is the only remaining wave count. This main wave count has a higher probability than the alternate below.
Within cycle wave a primary wave 1 lasted a Fibonacci 3 weeks, primary wave 2 lasted 53 weeks (two short of a Fibonacci 55), primary wave 3 lasted 37 weeks (three more than a Fibonacci 34), and primary wave 4 lasted 54 weeks (one short of a Fibonacci 55).
Primary wave 5 is now beginning its 36th week and the structure is incomplete. The next Fibonacci number in the sequence is 55 which would see primary wave 5 continue for a further 19 weeks, give or take up to three either side of this number. Although I am expecting primary wave 5 to be equal in length with primary wave 1 that does not mean it must also be equal in duration.
The maroon channel about cycle wave a from the weekly chart is now breached by a few daily candlesticks and one weekly candlestick. If cycle wave a is incomplete this channel should not be breached. The breach of this channel is a warning this wave count may be wrong, and so I will still retain the alternate.
Draw the maroon trend line on a weekly chart on a semi-log scale, and copy it over to a daily chart also on a semi-log scale (see this analysis for a weekly chart).
To see daily charts showing the whole of intermediate wave (1) from its start at 1,345.22, and an explanation of why this main wave count has a higher probability than the alternate, see the last analysis showing charts to that point here.
A new low below 1,131.09 would confirm that intermediate wave (3) down is underway.
Within intermediate wave (3) no second wave correction may move beyond its start above 1,308.10.
Within intermediate wave (3) minor wave 1 is a completed impulse lasting 18 days. Minor wave 2 is a completed double flat correction which lasted 9 days, exactly half the duration of minor wave 1. Because this is a second wave correction within a third wave one degree higher it is more shallow than normal due to the strong downwards pull of intermediate wave (3).
Minor wave 3 may total either a Fibonacci 21 or 34 days, depending on how long the corrections within it take. So far it has lasted only 10 days. At 1,055 minor wave 3 would reach 1.618 the length of minor wave 1.
Draw a base channel about minor waves 1 and 2. Minor wave 3 should have the power to break through support at the lower edge. Along the way down upwards corrections should find resistance at the upper edge. While the lower edge is not breached (so far it is only overshot and not clearly breached) the alternate wave count should be considered as a possibility.
Since the top labelled intermediate wave (2) volume is still strongest on down days.
On Balance Volume today has turned up, but with price also not making a new low OBV still agrees with the trend. There is no divergence at this stage.
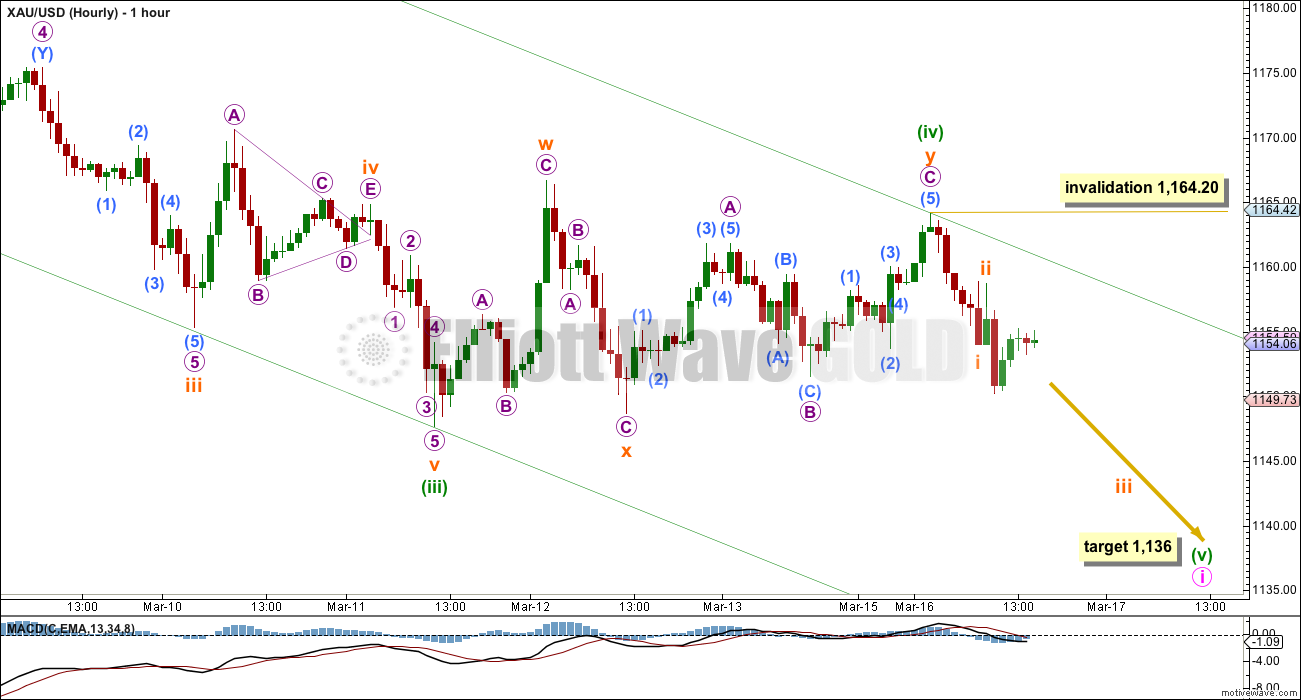
I had expected minuette wave (iv) to complete as a contracting triangle, but the triangle was invalidated when price moved above 1,161.83. Minuette wave (iv) subdivides only as a double zigzag, both upwards sloping corrective structures for subminuette waves w and y only subdivide as zigzags. This is an atypical looking double zigzag in that the second zigzag does not deepen the correction.
Minuette wave (ii) was a quick deep 0.70 single zigzag lasting 12 hours. Minuette wave (iv) is a more shallow 0.25 time consuming double zigzag lasting 62 hours. Because it is already so much longer in duration to minuette wave (ii) it is extremely likely to be over now. The final fifth wave of minuette wave (v) may be more time consuming than minuette wave (i) if minute wave i is to complete in a total Fibonacci 13 days. This would see minuette wave (v) as slow moving wave, lasting another three days.
At 1,136 minuette wave (v) would reach equality in length with minuette wave (i).
Minuette wave (v) may only subdivide as a five wave structure, either an impulse (more likely) or an ending diagonal (less likely). Within it subminuette wave ii may not move beyond the start of subminuette wave i above 1,164.20.
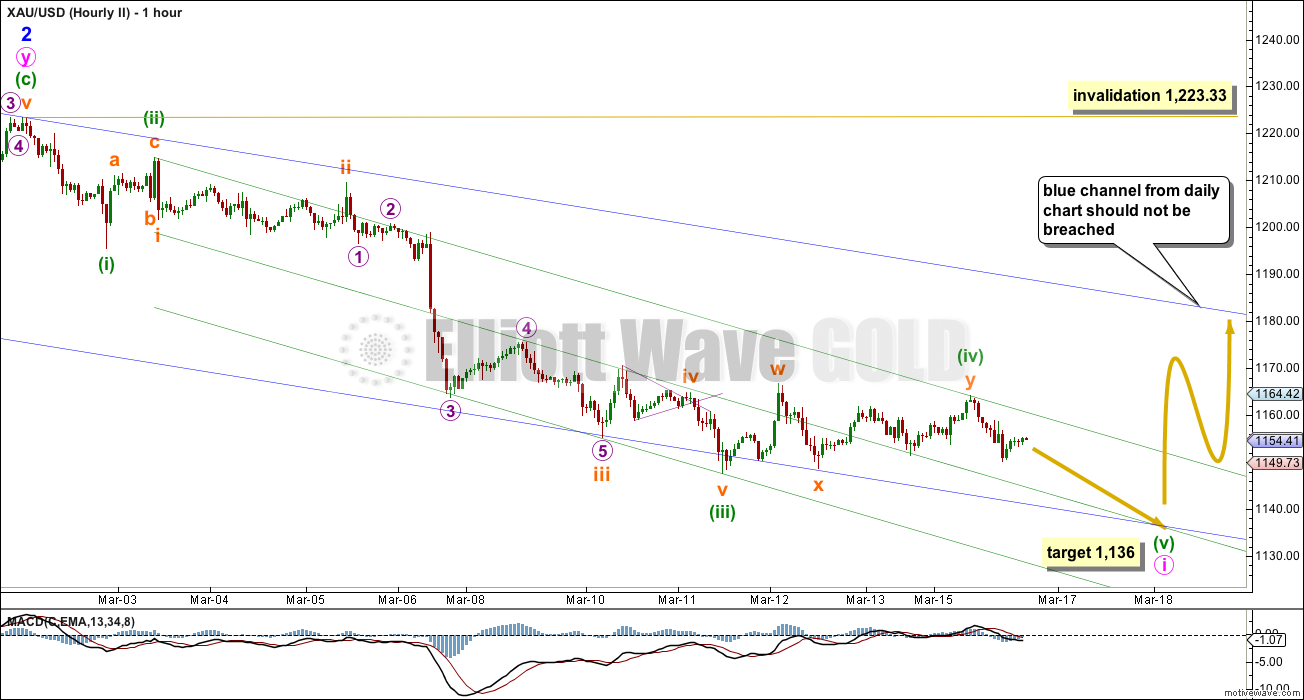
This hourly chart is exactly the same wave count as the first hourly chart, I am zooming out to show the entire structure of minute wave i so far.
Now that the fourth wave is over because it breached the channel drawn using Elliott’s first technique, redraw the channel using Elliott’s second technique. Draw the first trend line from the ends of minuette waves (ii) to (iv), then place a parallel copy on the end of minuette wave (iii). In this instance if minuette wave (v) is slow moving then it may move along and end in the mid line of the channel.
If minuette wave (v) is faster moving then it may end at the lower edge of the channel.
Along the way down upwards corrections should find resistance at the upper edge of the channel.
If the lower edge of the channel is breached and downwards momentum builds, then there is a possibility that minuette wave (v) may be a swift strong fifth wave, typical of commodities. If that happens it may end below the target. A possible target for a stronger fifth wave would be either 1,122 where it would reach 0.618 the length of minuette wave (iii), or at 1,097 where it would reach equality in length with minuette wave (iii). In this case I expect this to be unlikely, it is more likely this fifth wave will be slow and momentum will show divergence with the third wave.
When the channel is clearly breached by upwards movement then the final fifth wave may be expected to be over and the next movement, minute wave ii, should be underway. At that stage a new high above 1,164.20 would provide price confirmation that minute wave ii is underway.
When this final fifth wave is over that would complete a five wave impulse down for minute wave i. The next correction for minute wave ii should show up clearly on the daily chart, lasting either a Fibonacci three or five days. If it gets that high it should find strong resistance, and not breach the upper edge of the blue base channel copied over here from the daily chart. It may not move beyond the start of minute wave i above 1,223.33.
Alternate Daily Wave Count
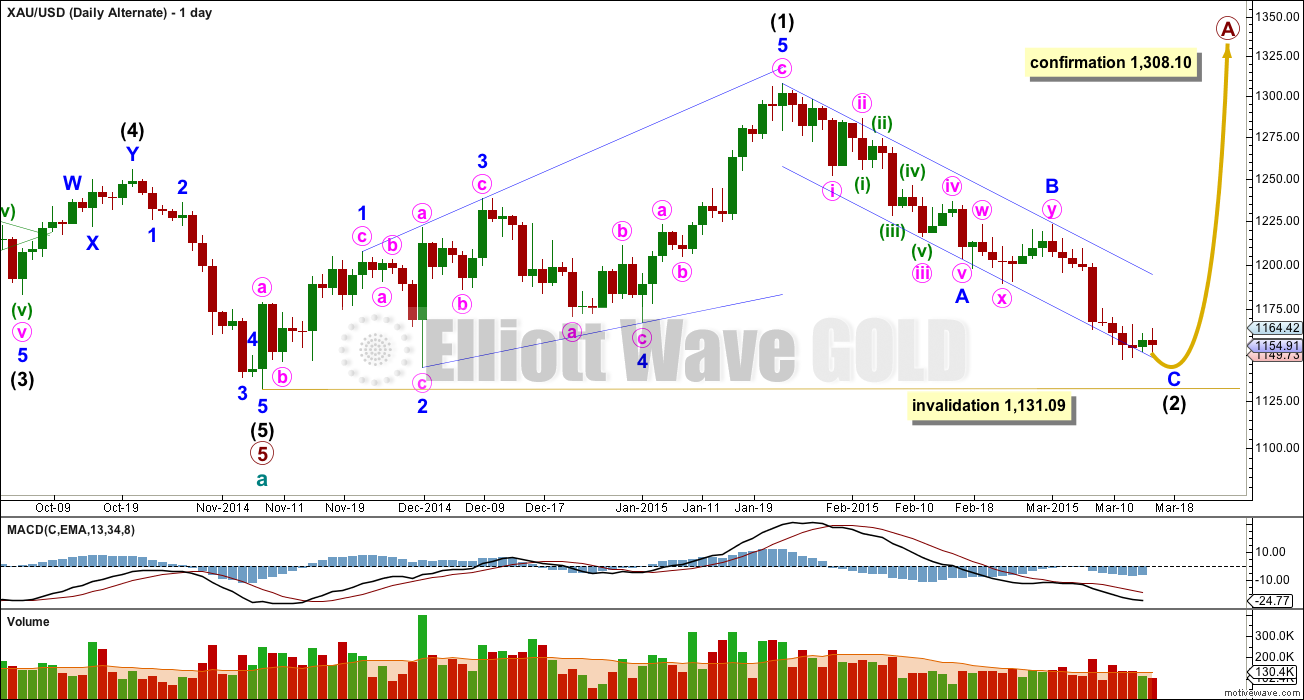
At this stage I judge this alternate wave count to have a lower probability. The structure of downwards movement, and momentum, will determine which wave count is correct over the next few weeks. At this stage they both expect more downwards movement so there is no divergence in the expected direction.
This wave count sees a five wave impulse down for cycle wave a complete, and primary wave 5 within it a completed five wave impulse. The new upwards trend at cycle degree should last one to several years and must begin on the daily chart with a clear five up.
The first five up may be a complete leading expanding diagonal. Within leading diagonals the second and fourth waves must subdivide as zigzags. The first, third and fifth waves are most commonly zigzags but they may also be impulses. This wave count sees minor waves 1, 3 and 5 as zigzags.
Leading diagonals are almost always followed by deep second wave corrections, sometimes deeper than the 0.618 Fibonacci ratio. Intermediate wave (2) is now deeper than the 0.618 Fibonacci ratio and the structure of minor wave C is close to completion.
For this alternate wave count minor wave C down must subdivide as a five wave structure. The hourly chart would see the subdivisions exactly the same as the main wave count above, so to keep the number of charts at a minimum I will publish only for the main wave count. For this alternate minor wave C may not exhibit a Fiboancci ratio to minor wave A.
Minor wave C is overshooting the lower trend line. Sometimes C waves do this. It is close to an end. When minute wave i for the main wave count can be seen as a completed five wave structure then this alternate would see minor wave C as complete. The price point which differentiates the two daily wave counts at that stage will be 1,223.33. This alternate will require movement above 1,223.33 and the main wave count would be invalidated with movement above 1,223.33.
Intermediate wave (3) must move beyond the end of intermediate wave (1) at 1,308.10.
Intermediate wave (2) of this new cycle degree trend may not move beyond the start of intermediate wave (1) below 1,131.09.
This analysis is published about 04:31 p.m. EST.
GOLD Elliott Wave Technical Analysis – 17th March, 2015
already out.
1143-42 still seen as holding with 1160-61 and 1164 on the outside seen as limiting…. Wonder where gold price goes from here, needs a break above 1156 to seek / test 1163-64
Bought DUST last night before close and at market open today confused on the count thinking would go down, should of just sold DUST at it’s high at 9:32 am up 6%. Instead watched like a deer in headlights as gold blasted up $12 in 2 minutes, while expecting and praying gold might correct down just as fast.
Ended up selling up high and broke even and should of followed my rule of Sell at first high of the day while profits are a click away for the asking.
Today is too much YoYo market, undecided and dangerous for me, now I will wait for the Fed FOMC Wednesday 2 pm news and follow the trend. Lara will show up and clarify what happened and might happen next. At least I didn’t get hurt on this trade and can do it again differently. This exciting ride didn’t cost anything. LOL. Congrats to those fast enough to grab pockets full of profits fast. Good luck all. See you at the Fed FOMC party.
The stock market was dropping this morning due to Fed interest rate concern might be delayed may of caused US dollar dropping overnight and also because gold down, bargain hunting and short covering and US dollar down may of shifted market to gold and happened very fast?
You are not alone. I bought DUST yesterday 15 minutes before the close when fast stochastics signalled a bullish crossover. However, today’s spike totally blindsided me.
me three. had Dust & fingers weren’t nimble enough to set sell at open. (last trade set sell way to soon) but this time i was a deer in headlights with mouth hanging wide open! Darn computers.
Looks like 5th wave over already or what?
Super fast jump up incredible?
Incredible!
so I was rally wrong. But invalidation is 1163.97. It may be micro to, which is an expandet flat. I think we will see new lows soon.
Once gold has new low at 1139 wave v and wave i (circle)is complete????
Gold will enter in wave 2 (circle) to 1180???
Road map is on Lara’s mar 16 hour ii chart.
wow. turn at just under 1144 was quick!
I believe that was the bottom – following the alternative. Added jnug significantly at 15.4 today and will expect new highs to come.
From the starting point on Lara’s hourly chart, wave 5 only shows 4 waves. That suggests it could be an ending diagonal and we are in wave 2 of that ending diagonal. Invalidation at 1164.20. Ending diagonals have all 5 waves dividing as 3s.
Any idea of the wave count now at 9:38 AM, please?
Are we in the 3rd or 5th wave?
Thanks to Lara for forecast!
micro 3, and not yet complete, I think. If it where micro 5, micro 3 would have been the shortest wave – not ok, and micro 4 would have been much too long. But take it only as an opinion.
I too was caught. I was so sure that we were merrily coasting down micro 3 until wham. On hindsight, this could not be the right movement because it is too fast.
I think we might need to rewrite Lara’s wave count. Micro 1 could be at the low of 1142.88, and the spike was micro 2. Second waves are sometimes very violent which fits this case. After it ended, we would be coasting down micro 3. Micro 5 and hence minute 1 may end closer to 1122. or lower (possibly 1097).
Yes … could be. Are you able to count an impulse from 1164 to 1142.88? I do not see it. So in that case it would become an ending diagonal like fencepost said. And hence micro 2 may not be complete yet.
I was thinking at that point in time that it had to be an ending diagonal, but I did not mention it because I was not so sure that it is. I could see micro 1 as three waves (unless somebody can count 5 waves) so it should be a zigzag, and zigzags are not part of a fifth wave unless they are in an ending diagonal. Micro 2 may be over as an impulse.
I stick with the expanded flat idea. submicro B is a bit longer than 200% of submicro A but all the waves fit quite nicely. So for me we are in micro 3 down (impulse) now with target 1137.40. (and that way again Lara would have been right all along ;-))
I remember Lara saying that wave B of an expanded flat cannot retrace more than 200%.
Hi Lara,
could we get update on XAG USD please. Are the targets still 11.52 and 5.305
A fair question, it’s been a while hasn’t it?
I’m really struggling with my Silver count at the moment. I’ve been waiting for the market to clarify it. I think I’ll have a go at that today for you Ursula.
Hi Lara: Sorry to hijack this gold post. Today US oil may put in a new low.
“The target for it to end is 53.61 to 59.03. It may include a new low below 43.58. US Oil has entered a consolidation phase.”
Is this the low expected?
Now that plenty of intermediate wave (4) has unfolded, yes. I can have a go at trying to figure out what structure it is.
The one thing I’m pretty sure on for Oil is this consolidation phase hasn’t ended.
It’s a fourth wave, so it may include a new low if there’s an expanded flat, running triangle or combination in there.
The current gold price set-up is not a very lucrative one with gold price trading in a narrow range. Something must give!…. 1150/48 is still seen as holding with 1162-63 seen as limiting…. Gold price remains bearish but short term rally (up move) is expecting which would require a break above 1156 to seek 1163-64…. Let’s wait and see if minuette wave v kicks in as expected!
Gold always waits for the Fed before beginning a big move. Tomorrow we should have our answer. I still believe $1131 will hold before a bounce at a minimum