
A little more upwards movement to the upper blue trend line was expected. Price has moved higher, but falls slightly short of this trend line.
Summary: It is very likely that minute wave ii is over and minute wave iii is beginning downwards now. The target for minute wave iii is at 1,048. Alternatively, we may see minute wave ii continue sideways for another one or three days, but this is less likely. Only if upwards movement provides a breach of the upper blue trend line on the daily chart will the main wave count be in doubt.
Click on charts to enlarge.
Main Daily Wave Count

This main wave count sees Gold as still within a primary degree downwards trend, and within primary wave 5 intermediate wave (3) has begun. At 956.97 primary wave 5 would reach equality in length with primary wave 1. For Silver and GDX this idea, that the primary trend is down, is the only remaining wave count. This main wave count has a higher probability than the alternate below.
Within cycle wave a primary wave 1 lasted a Fibonacci 3 weeks, primary wave 2 lasted 53 weeks (two short of a Fibonacci 55), primary wave 3 lasted 37 weeks (three more than a Fibonacci 34), and primary wave 4 lasted 54 weeks (one short of a Fibonacci 55).
Primary wave 5 is now in its 36th week and the structure is incomplete. The next Fibonacci number in the sequence is 55 which would see primary wave 5 continue for a further 19 weeks, give or take up to three either side of this number. Although I am expecting primary wave 5 to be equal in length with primary wave 1 that does not mean it must also be equal in duration.
The maroon channel about cycle wave a from the weekly chart is now breached by a few daily candlesticks and one weekly candlestick. If cycle wave a is incomplete this channel should not be breached. The breach of this channel is a warning this wave count may be wrong, and so I will still retain the alternate.
Draw the maroon trend line on a weekly chart on a semi-log scale, and copy it over to a daily chart also on a semi-log scale (see this analysis for a weekly chart).
To see daily charts showing the whole of intermediate wave (1) from its start at 1,345.22, and an explanation of why this main wave count has a higher probability than the alternate, see the last analysis showing charts to that point here.
A new low below 1,131.09 would confirm that intermediate wave (3) down is underway.
Within minor wave 3 minute wave ii may not move beyond the start of minute wave i above 1,223.33.
Within intermediate wave (3) minor wave 1 is a completed impulse lasting 18 days. Minor wave 2 is a completed double flat correction which lasted 9 days, exactly half the duration of minor wave 1. Because this is a second wave correction within a third wave one degree higher it is more shallow than normal due to the strong downwards pull of intermediate wave (3).
Minor wave 3 may total either a Fibonacci 21 or 34 days, depending on how long the corrections within it take. So far it has lasted 13 days. At this stage I will not provide a target for minor 3 to end, and it may not exhibit a Fibonacci ratio to minor wave 1. When minute waves i through to iv within it are complete I will again calculate and provide a target for minor wave 3 to end. For now the focus will be on minute wave iii.
Draw a base channel about minor waves 1 and 2. Minor wave 3 should have the power to break through support at the lower edge. Along the way down upwards corrections should find resistance at the upper edge. At this point in time the upper edge of this blue base channel is critical. If upwards movement continues over the next one or two days and breaches this trend line the main wave count will be in doubt. If the upper blue trend line is breached by one full daily candlestick above it and not touching it then I will swap the daily wave counts over and the alternate would be preferred.
Since the top labelled intermediate wave (2) volume is still strongest on down days.
On Balance Volume shows no divergence with price at the end of minute wave i. This supports the main wave count because if the alternate is correct and we have just seen a major low then OBV would be more likely to show some divergence. For this main wave count the trend remains down.
Main Hourly Wave Count
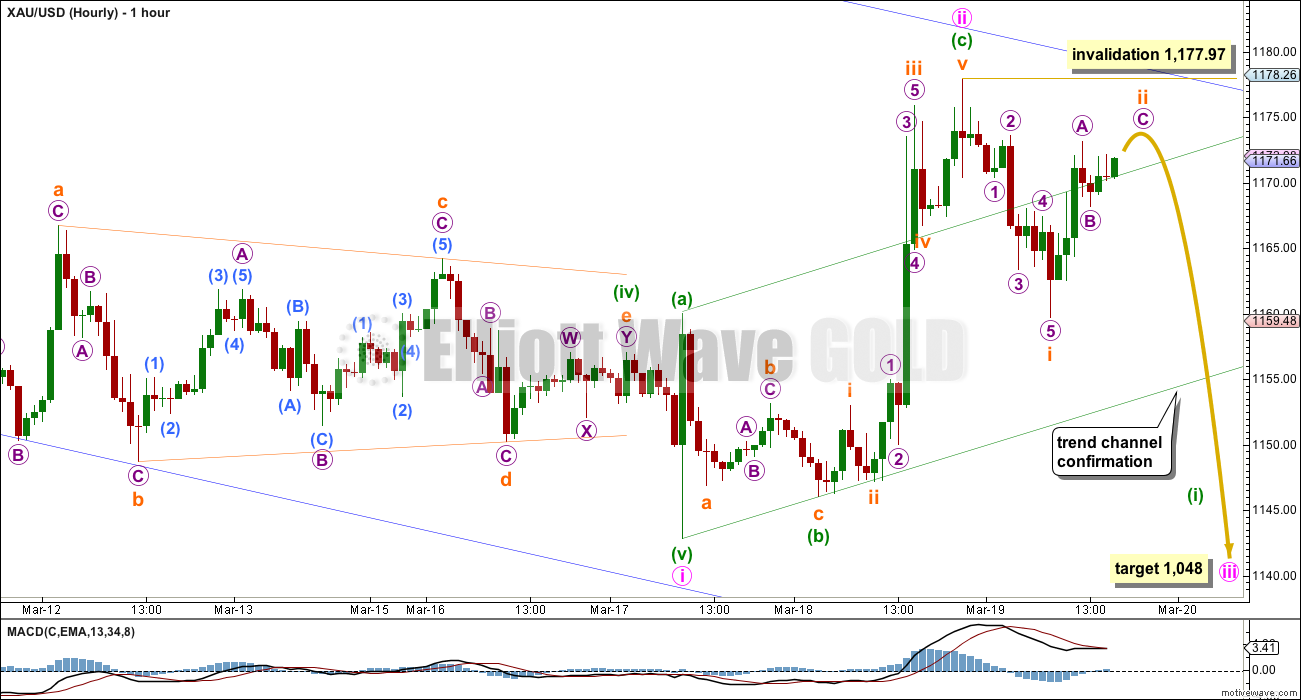
Minute wave ii is most likely over. I have checked the subdivisions of minuette wave (c) carefully on the five minute chart (provided below) and this structure looks complete.
From the high at 1,177.97 the first move down looks like a five, not a three. This supports the idea that minute wave ii is over.
There is no Fibonacci ratio between minuette waves (a) and (c).
Ratios within minuette wave (c) are: subminuette wave iii is 0.81 short of 4.236 the length of subminuette wave i, and subminuette wave v is just 0.07 short of 1.618 the length of subminuette wave i.
Within minute wave iii, subminuette wave ii may not move beyond the start of subminuette wave i above 1,177.97.
In the first instance I would have more confidence in this trend change if the upwards sloping green channel is breached by downwards movement. This would provide trend channel confirmation of a trend change.
Because minute wave ii is a second wave correction within a third wave one, two and three degrees higher, it may be expected to be more brief and shallow than second waves normally are. If minute wave ii is over now as a quick shallow zigzag that would fit the expectation for a brief shallow correction.
At 1,048 minute wave iii would reach 1.618 the length of minute wave i. Minute wave iii should show a clear strong increase in downwards momentum.
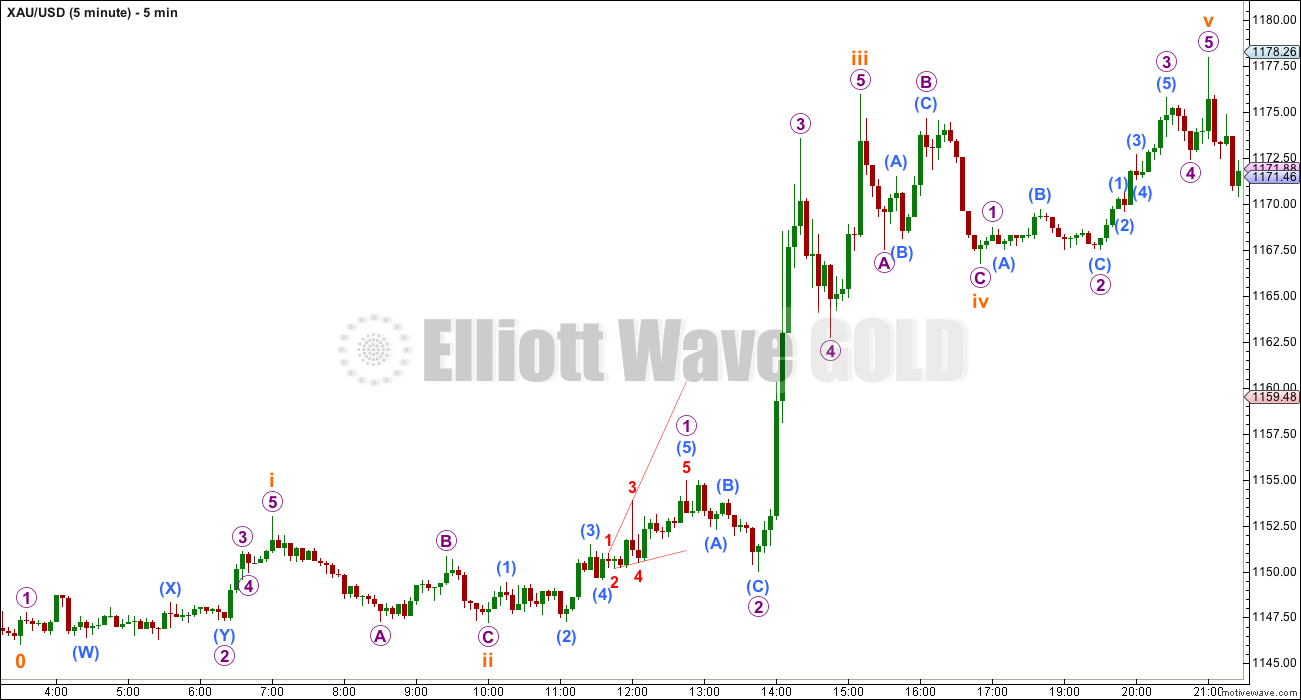
I will not make the publication of a five minute chart a regular feature, because in my opinion it often diverts and does not add to the analysis. In this case though it seems appropriate. This five minute chart shows only minuette wave (c) within minute wave ii, in order to explain how I see this five wave impulse as complete.
Alternate Hourly Wave Count

It is possible that minute wave ii is not over and may continue higher as a double zigzag or sideways as a double combination or flat correction.
This idea has a lower probability because it would see minute wave ii continue for either one more day to total a Fibonacci three days (if it is a double zigzag) and so break above the upper blue trend line of the based channel. This second wave correction is unlikely to break above that trend line because base channels normally provide strong support / resistance.
If minute wave ii continues sideways as an (a)-(b)-(c) flat correction, or (w)-(x)-(y) combination then it would be more time consuming, maybe completing in another three days to total a Fibonacci five. This is unlikely as minute wave ii would look better if it lasts only two or three days. Five seems a bit too long for a small second wave correction within a third wave one, two and three degrees higher.
This alternate wave count is possible, but it has a low probability. Unfortunately, expanded flats and combinations may both include a new low below the start of the correction at 1,142.82 so there is no lower price point which can differentiate the two hourly wave counts.
The only thing which will differentiate the wave counts is structure. The main wave count needs to see a five down develop and this alternate needs to see a three down develop. The main wave count labels current downwards movement subminuette waves i and ii. This alternate labels it subminuette waves a and b. When the next downwards piece is done it will be labelled subminuette wave iii for the main wave count and subminuette wave c for this alternate. How high the following movement goes will tell us which wave count is correct. At that stage if upwards movement breaks above 1,159.72 this alternate would be more likely and the main wave count less so because its fourth wave would be moving back into its first wave price territory.
If minute wave ii continues as a flat correction then within it minuette wave (b) must retrace a minimum 90% of minuette wave (a) at 1,146.34. Minuette wave (b) of an expanded flat may move beyond the start of minuette wave (a) below 1,142.82.
If minute wave ii continues as a combination then there is no minimum (or maximum) requirement for minuette wave (x), and it only needs to subdivide as a three wave structure.
Alternate Daily Wave Count
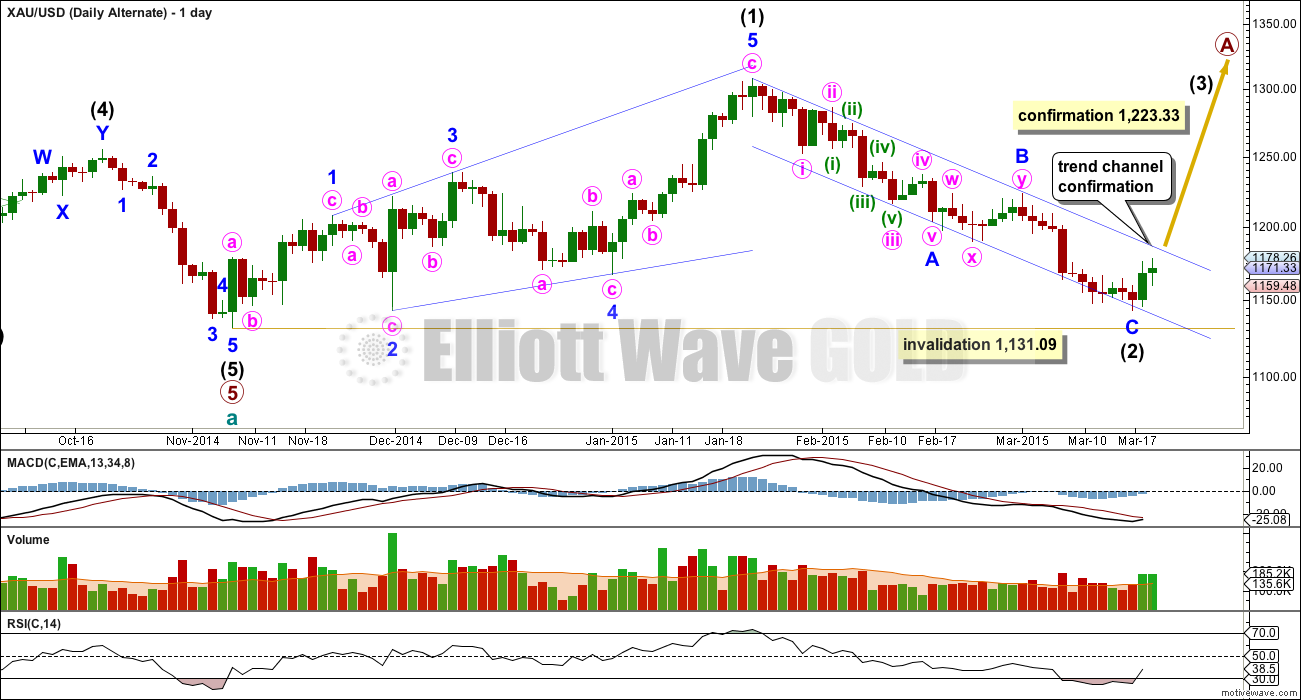
At this stage I judge this alternate wave count to have a lower probability. This is the point where this alternate wave count now diverges from the main wave count.
A new high above 1,223.33 would invalidate the main wave count and confirm this alternate. Before that price point is passed a clear breach of the blue channel about intermediate wave (2) with one full daily candlestick above the upper blue trend line and not touching it would provide trend channel confirmation for this wave count. At that stage it would substantially increase in probability and I would swap the main and alternate wave counts over.
Intermediate wave (3) must move beyond the end of intermediate wave (1) above 1,308.10. A new high above this point would provide full and final confirmation of this alternate wave count.
This wave count sees a five wave impulse down for cycle wave a complete, and primary wave 5 within it a completed five wave impulse. The new upwards trend at cycle degree should last one to several years and must begin on the daily chart with a clear five up.
The first five up may be a complete leading expanding diagonal. Within leading diagonals the second and fourth waves must subdivide as zigzags. The first, third and fifth waves are most commonly zigzags but they may also be impulses. This wave count sees minor waves 1, 3 and 5 as zigzags.
Leading diagonals are almost always followed by deep second wave corrections, sometimes deeper than the 0.618 Fibonacci ratio. Intermediate wave (2) is complete and 0.93 the length of intermediate wave (1).
Intermediate wave (2) of this new cycle degree trend may not move beyond the start of intermediate wave (1) below 1,131.09. Any breach of this price point by the smallest amount, even intra minute, would invalidate this wave count.
RSI has dipped below 30 which normally happens at the point of a more major trend change for Gold. However, this is not definitive. Looking back within cycle wave a I see other instances where RSI dips below 30 and does not precede a more substantial trend change: this happened for example at the low dated 19th Dec, 2012, where RSI dipped below 30 slightly only preceding a rise lasting 7 days, and RSI dips below 30 on 11th September, 2014, (just off to the left of the chart) yet price continued sideways and lower to find the low at 6th Oct, 2014.
In this instance there is very slight divergence with RSI and price. The price low of 11th March was followed by a new low on 17th March, yet RSI did not also make a new low. This divergence is only slight though, and if this low is a major low I would expect to see stronger divergence.
RSI is a small warning that this alternate may be correct, but it is not definitive in this case.
This analysis is published about 05:16 p.m. EST.
“Today the London Bullion Market Association (LBMA)is being terminated after over a 100 years of fixing the price of gold in the am and pm by four or five bullion banks. They have been able to front-run orders for decades. Now the International Commodities Exchange (ICE) will be run as an anonymous cash only exchange. China bought the LBMA over a year ago and this new structure is due to there influence I believe. In my opinion the futures traders are standing aside because they don’t know how the market is going to change. In light of this massive change in the gold market I think the up tick in the price is quite moderate. IMHO I think the Chinese will continue to want a low gold price so they can continue to accumulated cheap bullion for their long-term goals.” Allan Robinson
The above comment is from current member, who asked to post the comment for him.
Gold price is basing off 1181/79 looking to break above 1184/85 and likely to seek 1190-95….
Syed do you think gold may drop Monday before moving up to your targets?
Gold Could Push To $1,200 Next Week If U.S. Dollar Remains Weak – Analysts
http://www.kitco.com/news/2015-03-20/Gold-Could-Push-To-1200-Next-Week-If-US-Dollar-Remains-Weak.html
I like how so called analysts and experts state the obvious. Saying gold might go up if the dollar is weak is like saying there may be rain if a storm front appears.
You’re right he can’t go wrong with his IF forecast.
And I think that IF we stayed bearish in gold with MACD and RSI in oversold territory we would eventually get burnt. When I got burnt this morning I took my money out of burning up in the fire by selling my DUST at 10:12 am and cutting my losses.
LOL!
Lara
Any idea if Gold will open up or down or trade on Monday?
Maybe best to not hold anything over the weekend?
I think gold RSI and MACD oversold and US dollar drop countered our expected drop in gold.
I expect it to go up a little more to 1,191 – 1,193.
This is a critical point; the main and alternate wave counts diverge. If Monday produces a candlestick above that blue trend line on the daily chart I’ll swap the wave counts over.
If Monday sees price start to come strongly down, back below that blue trend line, the main wave count will remain preferred.
From an EW perspective we’re right at the cusp of figuring out which one is correct.
Hopefully gold either goes below 1,131.09 or above 1,223.33 before the end of March to invalidate either the main or alternate daily wave counts.
Lara did say on March 18th, “If the main daily wave count is correct we should see the alternate
daily wave count invalidated within the next week.”
Miners backtesting breakout from last week. The resistance line should hold on Monday. Once XAU closed below the bottom s/l it is wave 5 in effect. HUI has the same pattern.
I see lots of confusion below and I’m going to toot my own horn here. The bollinger band buy setup which triggered earlier this week could’ve gotten everyone on the right side of trade. It always triggers a multi week rally of some significance. I posted this numerous times in the last 5-7 days and I told lara I was concerned by main wave count because of this setup
Toot away! – I will toot also. Made a fortune on the upside this week. Only regret is exiting too soon this morning and missing an addition £8k… I will let the market keep that though 🙂
Yup, I’m doing well too. 🙂
I too use Bollinger bands. That combined with RSI made it very clear that there was going to be a change of direction. However, I do not believe that movement will be multi week. Gold has crossed from the outside to the inside and stayed there for at least 6 days or so. If one looks back over the last few months, one can identify periods where gold moves completely to the other side in maybe 9 days only to turn back the other way.
When I say “other side,” I am referring to the other side of the Bollinger band river. Also on the topic of RSI, it should now be close to 50. In other words, oversold conditions are rapidly disappearing. I think the next significant wave down could occur within a couple days.
And thank you for tooting that horn, collectively bringing all perspectives. What’s your wave count at this point?
short term I can count 5 waves up I believe. will have to verify later. Either way that means another leg up should ensue next week after pullback. I would be a buyer when the daily channel is backtested around $1170ish possibly
I’m dying to go short but I too see a 5 up. Also it is not overbought and nothing on my charts is telling me to go short other than that we are still in a downtrend in the bigger timeframe. But that may be changing. Sold too soon today so I’m going to have to force myself to just watch and wait now
I am leaning toward – just finished a B wave (1308 to 1144/46) and now into C wave. COT is very bullish looking at it quickly.
You probably know the COT is the CME positioning as of Tuesday afternoon. That will have changed since the outside reversal gold made since the COT.
Pathetic that in this era of computerization, this data is so damn laggy.
Yes, the data is a few days old. As of Tuesday, the banks were almost net long gold contracts…the last two times that happened good ran up $150-$200 over 8 to 10 weeks. We’ve gone $40 in 3 days. Like Lara wrote in the analysis late Friday, we are at a critical juncture.
I agreed with that last week too. And I pointed out 1.5 weeks ago the exact timing of this change in trend and rationale using other analysis incl gann and trendlines (not Elliott’s trendlines which are simplistic and of limited use).
EW is interesting but just a secondary indicator for me (more like a road map). A problem that I and other traders have with EW is that it’s so subjective: EW analysts draw opposite conclusions from the same chart.
For example, this week there was a free open house at EWI and I saw two EW gold analysts with very different counts and opposite expectations, both short and long term.
That’s not unusual for TA overall. But the same technical indicator doesn’t often lead to wildly opposite expectations as it does among EW analysts.
That said, I’ve enjoyed this site, seen that EW has merit and I’ve grown by adding EW to my toolbox.
Were you bullish today based on your bollinger band buy setup? It does sound helpful. Based on this week. I am adding some more indicators to my trading platform.
I was bullish a week ago, stayed patient, and got the move I was looking for. I sold 75% of my position today looking to add on a pullback.
Great for you that you made money on your knowledge and patience.
Too many indicators can lead to analysis paralysis.
I mentioned BB and Double BB almost 3 months ago for the January spike, which many of the EW crowd missed (except Chapstick). I pointed out a reference, but someone dissed me for “promoting my book” (even tho it isn’t mine). I can post it again if you like.
Yes I remember that was an excellent observation and post. Similar to another great one of yours in January. Thanks for those on behalf of everyone.
A chartists view????
Gold seasonality is in force. Jan high brings Feb-Mar low. Gold made low and now gold will have Mar-April high. Unless the EW wave count wave 5 puts the breaks.
From 1307 high to recent low 1144 gold could bounce to Mar-Apr high to 1244.
Gold may develop up channel reverse symmetry channel just like the one from Jan to March.
That is abot .618 weekly retracement from 1307 to 1142
Can’t this be a large A-B-C correction still? A ended at 1177.97, B at 1159.48 and C is almost complete. If C should complete as a 5, then maybe we just experienced a 3rd wave.
I still think thats a possibility.
I believe that we have just gotten hung up on the channel idea. There are other solid trendlines still in place. A similar situation happened when gold broke out of the weekly channel – the channel was breached, but major trendlinees provided resistance.
I hope you are right, but a wave ii within a larger wave 3 should not have broken the upper boundary of the channel.
I’m not so sure about that. It has happened before.
I hope you are right – it is just something Lara said in her last video.
I know, but I respectfully disagree that upward movement must remain in the channel. As I mentioned before, the prime example of this was when intermediate wave 2 broke out of the weekly channel. Despite having done so, it held right at a strong resistance line and plummeted down from there. I believe that we are experiencing the same thing, but just at a lower degree.
I don’t think I said “it must remain in the channel,” just that a weaker wave within a wave that did not break the channel should also not break the channel.
Gold up a third straight session as dollar drops
Mar 20, 2015 11:26 a.m. ET
http://www.marketwatch.com/story/gold-up-a-third-straight-session-gain-as-dollar-drops-2015-03-20
On Friday, the ICE U.S. dollar index DXY, -1.35% fell 1%, and traded roughly 2% lower for the week. A weaker dollar often provides support for dollar-denominated commodities, including gold, as investors seek out alternative investments.
Gold just dropped .60 in last hour since 11:35 am, that pumps up the value of gold in US dollars, just like it would with other currencies because Gold acts like a world currency.
Dear Lara,
is there no possible wavecount between your both alternates?
I dont believe we did see the low in november and on the other side i would be surprised if the blue trend channel holds short term.
956$ seems to be too low for me for a final low .
The Cot Report looks like we have seen the most of downward movment already .
If we see a full clearing up of longspeculators before the next multiyear trend change will start we may get near your pricetarget for the mainwavecount intermediate wave (3) but not deeper.
Since the low at 1187 in june 28. 2013 you can see a rise of Longpositions in the futuremarket.
We saw the biggest clearing up of speculators on that date in june 28 when we dipped at 1187 first time.
Since that date we see longspeculators making higher highs and higher lows while price made lower highs and lower lows.
the bears had not the power to clear out all the bulls. The manipulators which are a big part of the bears who had influence on the chart never had the power to wash out the bulls again completly not even when we made lower lows. the manipulators covered their shortpositions evry time when exactly when we saw the trendchange for bearmaketrally.as they exploded their shorts when we saw a trendchange to the downside.
Im very good with my Cot report analysis to catch the mid term trend change. so i trade round about 3 month usually and im sad that my english is soo bad.
For the last low at 1131 they sold a high amount of physical metal into the market into falling prices to breake through the trippleresistance at 1185 what is very untypical cause the manipulation most happens into rising prices. you can see it when you set the positionchange on the futuremarket relativ to the pricechange. They sell physical gold into the rallys and at the end of the rallys when longspeculators are exhausted they explode their shorts on the futuremarket on importante marks resistance or zones on the chart to keep the bearish look potential. i only speak about the manipulators now not all the commercials. i cant go more in detail now but you can believe me that i see the manipulation and use it very succesfully for my trading over long time period.
Is there no possibility that 1055 is the final target and we see a bit more upwardmovement for now before?
Lara i allways used your brilliant work for my trading to my analysis to get more precise and you allways got a Wavecount supported my analysis about the COTs.
This is the fist time you have no count really supporting what i see on the Cot-data developing.
I just want say that the market is highly manipulated and there is not that high longdroppoteantial anymore to see your low targets if the central banks dont sell a high amount of gold into the market. That would be very expensive and im not sure that we will see that.
Is there no possible wavecount which sees a bit more upwardmovement to get longspeculators to make a final drop below the novemberlows maybe with a final sell of to 1085- 1055?
We should see that in the cot report in the next overnext week. if now the longpositions rise better realtiv to price im sure we will make a new low but 959 i dont think this target is realistic.actually i cant see from where the energy should come when you look at semtiment.
I cannot believe that we have already seen the final low cause the shortposition of JP Morgan in silver a very good indicator was still to high. the manipulators already reduced the half of theri position in gold and silver and they never would do that now if we will se 956.
your both counts soo extrem apart to each other , cant there be a middleway? a new low but not that deep? if JP morgan still holds a too high shortposition i would prefer still a cout wich sees new lows but not that low as your maincount. this is not really possible if we dont see a sell of from central banks. that would be very unlikely.
I’m providing EW analysis, with a little other TA thrown in now as I learn more for my CMT.
So to your question asking if there’s a wave count in the middle…. not that I can see.
I can’t produce a wave count to fit what you see happening.
Okay, I have a wave count you may like. I don’t like it though from an EW perspective. I’ll publish it at the end of today’s analysis.
1187-88 resistance…..
1175 support hourly
I don’t expect gold to break 1188 today
That is about to be tested…
yes…
Can expect a pullback to 1176-1179
It its breaks next could be 1203-1204
If its rising wedge.rising wedge often breaks downwards……
size of rising wedge 160 pips..
Thanks for posting this. My revised plan is this, the rising wedge completes over the next few days. Miners look to have completed 5 waves up, so I am going to look for a pull back to close todays gap, then they rise to close the gap left from 3/6, which should happen about the same time as the gold rising wedge completes, maybe mid next week. I am estimating one could enter JDST around $9 by then. Now lets see what Lara thinks.
Thanks. Yes rising wedge will have to narrow down and then the break will come.. it that idea is correct.
Are we forming a diagonal?
1203/1204 is very close to the 38% retrace.
It’s clear the trend is up for now, and I exited longs a bit too early, maybe way to early. I wonder if Lara can see a way, rather than reverting to the daily alternate, of seeing only Minor 1 over and this being Minor 2. I’d prefer looking at the EW count that way, if possible, rather than the alternate.
I’m charting this and I have a few problems with it. I’ll publish it at the end of today’s analysis as a “what if”.
Thanks very much Lara. I share your concerns on the current alternate daily for lots of reasons.
Is it possible that her count from 2 days ago, that called for v, c, ii to complete is now what is playing out? She changed the count from 2 days ago to yesterday to have v complete at 1177.97, but 2 days ago she had that as micro 5.
I think this is a possibility, and looking at the miners, they are reaching overbought already on daily, and hourly, and hitting gap resistance.
Thoughts?
What is happening is NOT what Lara expected. Can someone make sense of this for me? What alternate wave count is this?
Miners approaching gap down resistance from 3/6.
Today its all about positive sentiment on the euro.
The gold future’s guys are on the sidelines, no
buying or selling.
So far the previous lows 1181-83 have curtailed the upside with upside risk 1189/90 still open… Gold price closing at or above 20dma (1180-81) will leave the shorts in a spot of bother…. Gold price has based off 1169/68 all day which appears to now be good short term support with 5dma (1165-64) below that; currently gold price is basing off 1180 and a break above 1189-90 will possibly signal reversal and open up further upside risk….
Lara’s Hourly Alternate chart has a ii circle at the very top right corner.
Could that have been 1,184.35 at 10:18 am?
Or would ii circle still be higher?
After ii circle, how low would it retrace?
Come on US dollar, move up to a new high today to push gold far down.
According to my calculations, minute 2 for the alternate daily could complete at 1191 as minute 2 appears to be an expanded flat. This is based on Lara’s minuette b being lower than 1146.34 which was not reached today.
TKL
Once again gold is not behaving being in final pm wave 5 down. This being a 3rd of 3rd of 3rd wave does not have enough pull down?
Yes day is not over yet.
That is close to the 0.618 ratio, which was my original target before Lara brought up the fact that the trend channel would provide resistence. However, at this point, I would say that the low 1190s is the maximum that gold could reach. I believe this will be over soon and consider it dangerous to think of being anything but short gold right now. Once gold breaks, there could be a $50-80 move in a single day.
I hate to think of the alternate daily count as being correct, in view of the trendline bring breached. In that scenario, Intermediate 3, minor 1, minute 1 would reach 1193/1194 before a pullback.
I can’t take the daily alternate seriously because there has to be a washout in gold at the end. On a chart that would look like an enormous wick or tail. Makes more sense to me that this would occur with movement below 1000, as Lara’s main count suggests.
I think what we are going to learn out of all of this is that there can be brief swings outside of channels during extreme times. For example, many (myself included) were shocked when gold moved above 1300. However, being short at that peak turned out to be a great idea.
If you look back at impulses for Gold you will see base channels occasionally breached…. and then a third wave takes off in the opposite direction.
Base channels are almost always adhered to very strongly. But again, almost always is not the same as always.
What I’m trying to do is look for the most common scenario, the theory being then I’ll be right more often than I’m wrong.
What this means is when an uncommon scenario happens I’ll be wrong. That’s the problem with low probability occurrences; they do happen, and when they do they’ll never be what you expected as most likely. That’s the nature of probability.
And there is absolutely NO way I can be right all of the time.
I completely understand and wouldn’t want you to behave any differently. I very much appreciate your work and admire the fact that you do have such high regard for the laws of probability.
You may be right, but its getting increasingly difficult to see that happening.
On second thought, the structure may be correct as a double zigzag 1143.25 – 1177.97 – 1159.48 – ? (I was too enamored with the flat/combination idea to see this). At 1.0 retrace, the end point for minute 2 would be 1194.20. This ties in with minute 2 being a 0.618 retrace of minute 1. It also is of shorter duration than the flat or combination. If this is correct, then minute 3 down will be on steam soon.
Yes, that’s what I think it is. I’d discounted it because it needed price to break above the base channel.
That’s the problem I’m learning with base channels. They almost always work really well, but almost always is not the same as always.
So… If I’m aiming to get the prediction right more often than wrong I have to go with the highest probability scenario. Which means when a low probability scenario occurs I’ll be wrong.
There’s just no way I can always be right.
Hi Lara. I agree wholeheartedly with you on acting on the course of action with the highest probability. I have long learned since my days of playing duplicate bridge in the national premier league that you have to always make decisions on the fly. To have the best chance of winning, you have to decide on the most likely event and play accordingly. We only make a contrarian play on one occasion: desperation. That occurs when we are losing in a 16-boards match, and one final board using a lower probability approach, which we think the opponents would not adopt, can engender a double swing. That is make or break. I wouldn’t try it in trading. We are gambling with real money at high stakes! There is absolutely no way in which you can be right all the time especially when working on a tight time constraint. That’s why the Americans call it a batting average in baseball. You win some, you lose some, but if your wins greatly outnumber your lossses, and your losses are not catastrophic, you will be doing fine. It is easy for armchair critics (and those analysts who post once a week) to point to the right move, on hindsight. When the dice has already been cast, you can’t possibly go wrong. That is why I most respect analysts who dare to stick their necks out and give predictions on the future course of events in all honesty, not shrouding them with ambiguity or using caveats and provisos.
🙂
Gartman says Crude to $15…time to go long UWTI…lol, that guy gets it wrong every time.
Looking for usd to change direction, then all in
with jdst
Lara’s Hourly Alternate is correct as Tham says. Lara explains below.
After Lara’s report gold went up to 1,173.96 then down to 1,168.84 then above 1,159.72 this morning, then hourly alternate more likely.
“When the next downwards piece is done it will be labelled subminuette wave iii for the main wave count and subminuette wave c for this alternate. How high the following movement goes will tell us which wave count is correct. At that stage if upwards movement breaks above 1,159.72 this alternate would be more likely and the main wave count less so because its fourth wave would be moving back into its first wave price territory.”
Are we looking at a good jdst trade now?
Did a 5 wave structure just top at 1,184.35 at 10:18 am?
I was just thinking DUST like Dell is?
On pmbulls.com, that third wave in that structure looks to be the shortest so it is not a 5 wave impulse you are looking at. Therefore I doubt it is complete.
Its in my target zone to buy but with Gold over 1180, I am waiting for some confirmation.
I thought I wanted to wait this one out. I had my doubts that Lara’s main count yesterday was correct since 1177.97 was too low. It was only minuette 3 on my minute 2 count. I had reckoned that minute 2 would end at 1179+, but after looking at Lara’s lower degree wave count, I defer to her count. (There is still a chance that minute 2 is correct with a 1.618 retrace of minuette 5 at 1186.47).
It appears that the alternate hourly count is now correct with minuette b (or x) as an expanded flat. If otherwise, gold price rallying skywards would have blindsided almost many analysts out there.
Subminuette b of minuette b (or x) would reach 1185.03 at 1.382 retrace. Minuette b (or x) would drop down to 1135-1136 at 1.618 retrace of subminuette c. That means minute 2 itself is an expanded flat. Let’s see how this pans out.
1.184.35 at 10:18 am.
http://www.pmbull.com/gold-price/
This is super accurate real live gold price to the minute.
Looks like the MACD and RSI both very oversold warning signs should of been heeded and not gone bearish against gold.
I already sold my DUST at 10:12 lucky only had 400.
I’ll let Lara sort things out.
My super bounce day trader friend has told me this morning that
3/11 is the day when GLD price down but gold miners up. That is the real bottom on gold miners.
Just closed out my longs. This might be it. Hope I don’t regret it.
Gold right at 1180 trying to get above it.
But will it.
Most likely – I should have continued with my long! Frustrated.
Just went above 1,117.97 upper invalidation point at 9:47 am !!!!
US dollar weak this morning is pushing up gold.
Yahoo Finance is showing daily high at 1179.2, currently 1176.9.
Can anyone confirm high above 1179.97 using Lara’s data feed?
We hit 1184 about 5 minutes ago. http://www.pmbull.com
OK, 1179.97 clearly breached on Yahoo Finance
Weekly closing.. It seems to b bullish at the moment….. There is still time left before closing….Lara’s main chart has been invalidated and hourly trend channel is breached
hourly chart is invalidated at 1177.97 but daily is not. Within minute wave iii, subminuette wave ii may not move above 1,177.97 invalidation point. Only if upwards movement provides a breach (1 full daily candlestick above) of the upper blue trend line at about 1,180 on the daily chart will the main wave count be in doubt.
I am looking for 1180-82 as resistance. I would expect a pullback shortly. I
yes 1180 daily channel resistance and 1182.82 50% retracement from 1222 to 1142.. but if price closes above that then…….and weekly candle pattern pattern….
if today’s candle close as bullish then morning star pattern in weekly chart can be formed… reliable reversal pattern
I posted on 11th of march
I am expecting a bounce..
reason
The chart below shows circles… circles on highs and lows on prices and highs and lows of stochastic indicator on weekly chart
I observed whenever stochastic is overbought and oversold price often not moved beyond that point at which the stochastic is overbought or oversold
and if we look at price now and stochastic.. stochastic is oversold and weekly support is at about 1140
so price may not move beyond 1140 and bounce
hourly channel has been breached now next candle should have to close below 1176… otherwise chances will that market will close above daily resistance at 1180
daily resistance is on the line…..and close above 1180 will definitely open up 1223…….
Selling jnug (which has been a perfect trade) and buying DUST on open. Analysts pointing down.
Sold JNUG too soon – 19.06. However into Dust at 16.96. Bring on the downside!
Looks like alternate getting a possibility … Keep a close eye!
movement from 1160 looks like double zigzag retracing around 76.4% of the wave from 1177.6.
Not too happy to see gold price having found support at 1169/68 all day so far… last time gold price found support at 1149/47, it spiked to 1177…. RSI and stochastic seem to be supporting upward movement for now and remains to be seen if the trend channel line can contain the upward movement!
Hour chart sm wave i completed at 1159.73. micro wave A at 1173.11and micro wave B at 1168.09.
Micro wave C and sm wave ii ended at 1173.96.
Now gold trading at 1171-1170 below the green line.
AM I correct ????
Hi. I am just thinking; quite apart from the base channel providing resistance, a 50% retracement of H 1223 / L 1143 comes in at about 1183; also not to forget the previous 118x lows. So all in all with so much overhead resistance, the main wave count should remain favored
U R right. Gold to 1180ish will happen today once COMEX opens. A big take down according to Lara’s wave count.
Watch and see!!!!
First things to watch for indications of two choices in direction are above 1,177.97 and below 1,155 area trend line confirmation.
Thanks Richard
Price above 1177.97 count will change and below 1155 more confidence in the primary wave count.
Gold trading around upper green line. Briefly traded below the green line.
I will clear much of my bets if price over 1178.8 to 1180, to observe the more clear the wave pattern first. The channel cohere with Lara analysis. AUD test a strong low resistance at 0.76, NZD resists to follow the AUD, I hope both gold and Aud break through the downward resistance and create the next drop. I think the drop not start yet because accumulates too much shorts on days before.
These 2 days may clear some and resume the downward trend sudden and fast
Article with 2 Elliott Wave charts with link at bottom on US Dollar DXY and how it may top within a few days to a couple of weeks, then begin a drop of from 5 to 10% over 2 months. Both of these may have a significant effect on gold.
Is it possible the dollar will only get stronger?
Mar 18, 2015 11:30 a.m. ET Avi Gilburt
http://www.marketwatch.com/story/is-it-possible-the-dollar-will-only-get-stronger-2015-03-18
Richard, what does he say about gold during the projected dollar pull-back?
He mentions nothing about gold in the article, however when the US dollar moves it does has an effect on gold because gold is priced in US dollars. Compare $DXY and /GC together in one chart and the difference is obvious like how they both moved at each FED FOMC meeting.
Thank goodness for Lara’s analysis. Gold price appears to be a little bottomy basing off 1169 with 1163/60 holding…. Short term up move / upturn (rally) is expecting for a few bars up with upside risk 1189/90…. Gold price remains bearish but ADX has weakened for the downside which is a concern and remains to be seen how gold price behaves within the base / corrective channel…. I would look to short the rally for a break below 1157….hmmm
If gold moves higher to your target 1189 the current wave count is invalidated.
Lara: “Within minute wave iii, subminuette wave ii may not move beyond the start of subminuette wave i above 1,177.97.”
If gold did move higher than back to square one.
I think you mean if moves higher to what was today’s target of 1,179 / 1,180 then current count invalidated.