
Upwards movement was unexpected. The second wave correction is continuing higher.
Summary: The target for upwards movement to end is at 1,191 – 1,193. The next daily candlestick must return price below the upper edge of the blue base channel. If a full daily candlestick closes above and does not touch the blue trend line I will swap the main and alternate wave counts over. I have a new alternate wave count for you today.
Click on charts to enlarge.
Main Daily Wave Count
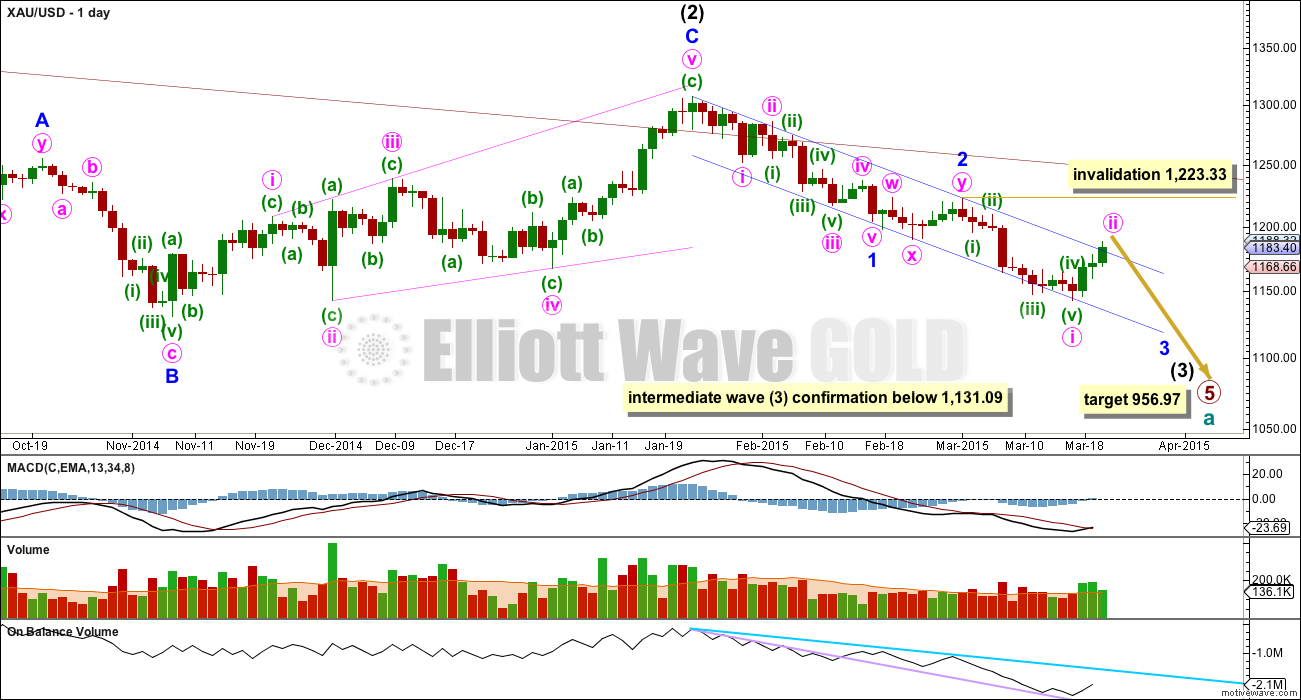
This main wave count sees Gold as still within a primary degree downwards trend, and within primary wave 5 intermediate wave (3) has begun. At 956.97 primary wave 5 would reach equality in length with primary wave 1. For Silver and GDX this idea, that the primary trend is down, is the only remaining wave count. This main wave count has a higher probability than the alternate below.
Within cycle wave a primary wave 1 lasted a Fibonacci 3 weeks, primary wave 2 lasted 53 weeks (two short of a Fibonacci 55), primary wave 3 lasted 37 weeks (three more than a Fibonacci 34), and primary wave 4 lasted 54 weeks (one short of a Fibonacci 55).
Primary wave 5 has just ended its 36th week and the structure is incomplete. The next Fibonacci number in the sequence is 55 which would see primary wave 5 continue for a further 18 weeks, give or take up to three either side of this number. Although I am expecting primary wave 5 to be equal in length with primary wave 1 that does not mean it must also be equal in duration.
The maroon channel about cycle wave a from the weekly chart is now breached by a few daily candlesticks and one weekly candlestick. If cycle wave a is incomplete this channel should not be breached. The breach of this channel is a warning this wave count may be wrong, and so I will still retain the alternate.
Draw the maroon trend line on a weekly chart on a semi-log scale, and copy it over to a daily chart also on a semi-log scale (see this analysis for a weekly chart).
To see daily charts showing the whole of intermediate wave (1) from its start at 1,345.22, and an explanation of why this main wave count has a higher probability than the alternate, see the last analysis showing charts to that point here.
A new low below 1,131.09 would confirm that intermediate wave (3) down is underway.
Within minor wave 3 minute wave ii may not move beyond the start of minute wave i above 1,223.33.
Within intermediate wave (3) minor wave 1 is a completed impulse lasting 18 days. Minor wave 2 is a completed double flat correction which lasted 9 days, exactly half the duration of minor wave 1. Because this is a second wave correction within a third wave one degree higher it is more shallow than normal due to the strong downwards pull of intermediate wave (3).
Minor wave 3 may total either a Fibonacci 21 or 34 days, depending on how long the corrections within it take. So far it has lasted 14 days. At this stage I will not provide a target for minor 3 to end, and it may not exhibit a Fibonacci ratio to minor wave 1. When minute waves i through to iv within it are complete I will again calculate and provide a target for minor wave 3 to end. For now the focus will be on minute wave iii.
Draw a base channel about minor waves 1 and 2. Minor wave 3 should have the power to break through support at the lower edge. Along the way down upwards corrections should find resistance at the upper edge. At this point in time the upper edge of this blue base channel is critical. If upwards movement continues over the next one or two days and breaches this trend line the main wave count will be in doubt. If the upper blue trend line is breached by one full daily candlestick above it and not touching it then I will swap the daily wave counts over and the alternate would be preferred.
For Gold base channels almost always show clearly where price finds support / resistance during corrections. But again, almost always is not the same as always. Sometimes the base channel is overshot, sometimes it is breached. A breach is unusual though so if this channel is breached the probability of this wave count reduces significantly.
Since the top labelled intermediate wave (2) volume is still strongest on down days.
On Balance Volume shows no divergence with price at the end of minute wave i. This supports the main wave count because if the alternate is correct and we have just seen a major low then OBV would be more likely to show some divergence. For this main wave count the trend remains down.
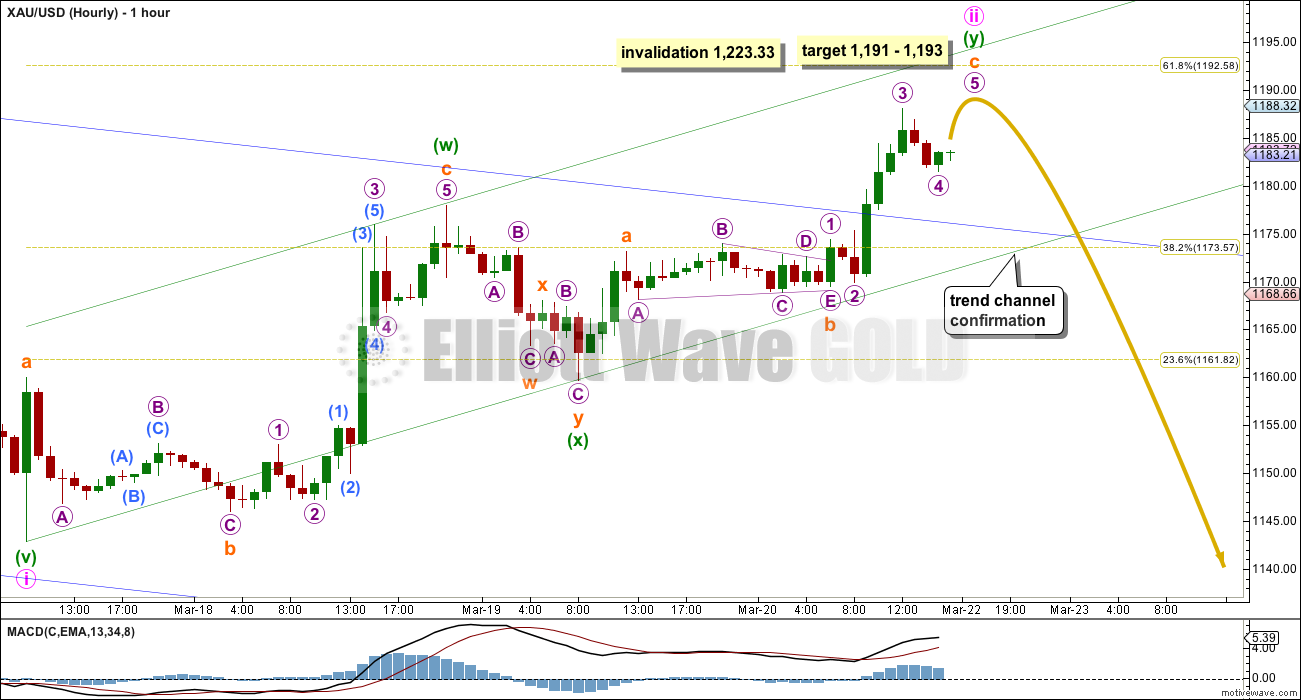
Minute wave ii may be continuing as a double zigzag. Because this double zigzag takes price above the base channel it was the least likely structure for minute wave ii. It also would probably end about the 0.618 Fibonacci ratio of minute wave i about 1,193. This would see minute wave ii a relatively deep correction, which is less common for a second wave within a third wave one and two degrees higher.
At 1,191 subminuette wave c within the second zigzag would reach 1.618 the length of subminuette wave a.
This target should be met early during Monday’s session. Monday must see price move back below the dark blue trend line on the daily chart so that the base channel is not breached by a full daily candlestick.
At this stage the main and alternate wave counts are at the cusp of diverging. This main wave count needs to see a third wave down begin before I will have any confidence in it. Initially a breach of the green upwards sloping channel on this hourly chart would provide some confidence in this main wave count.
Minute wave ii may not move beyond the start of minute wave i above 1,223.33.
Alternate Daily Wave Count
At this stage I judge this alternate wave count to have a lower probability. This is the point where this alternate wave count now diverges from the main wave count.
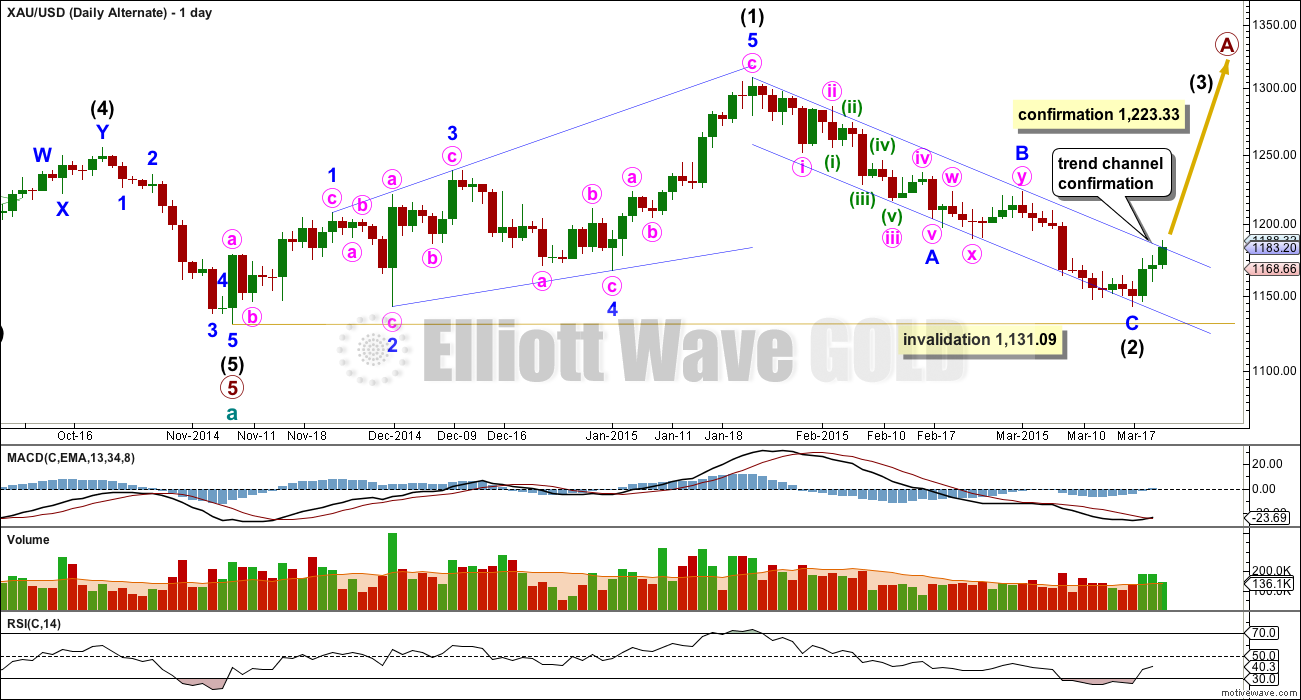
A new high above 1,223.33 would invalidate the main wave count and confirm this alternate. Before that price point is passed a clear breach of the blue channel about intermediate wave (2) with one full daily candlestick above the upper blue trend line and not touching it would provide trend channel confirmation for this wave count. At that stage it would substantially increase in probability and I would swap the main and alternate wave counts over.
Intermediate wave (3) must move beyond the end of intermediate wave (1) above 1,308.10. A new high above this point would provide full and final confirmation of this alternate wave count.
This wave count sees a five wave impulse down for cycle wave a complete, and primary wave 5 within it a completed five wave impulse. The new upwards trend at cycle degree should last one to several years and must begin on the daily chart with a clear five up.
The first five up may be a complete leading expanding diagonal. Within leading diagonals the second and fourth waves must subdivide as zigzags. The first, third and fifth waves are most commonly zigzags but they may also be impulses. This wave count sees minor waves 1, 3 and 5 as zigzags.
Leading diagonals are almost always followed by deep second wave corrections, sometimes deeper than the 0.618 Fibonacci ratio. Intermediate wave (2) is complete and 0.93 the length of intermediate wave (1).
Intermediate wave (2) of this new cycle degree trend may not move beyond the start of intermediate wave (1) below 1,131.09. Any breach of this price point by the smallest amount, even intra minute, would invalidate this wave count.
RSI has dipped below 30 which normally happens at the point of a more major trend change for Gold. However, this is not definitive. Looking back within cycle wave a I see other instances where RSI dips below 30 and does not precede a more substantial trend change: this happened for example at the low dated 19th Dec, 2012, where RSI dipped below 30 slightly only preceding a rise lasting 7 days, and RSI dips below 30 on 11th September, 2014, (just off to the left of the chart) yet price continued sideways and lower to find the low at 6th Oct, 2014.
In this instance there is very slight divergence with RSI and price. The price low of 11th March was followed by a new low on 17th March, yet RSI did not also make a new low. This divergence is only slight though, and if this low is a major low I would expect to see stronger divergence.
RSI is a small warning that this alternate may be correct, but it is not definitive in this case.
Volume for the last three up days has not exceeded highest volume during the prior wave down. If this upwards movement is the start of a much longer trend I would expect to see higher volume.
Second Alternate Daily Wave Count
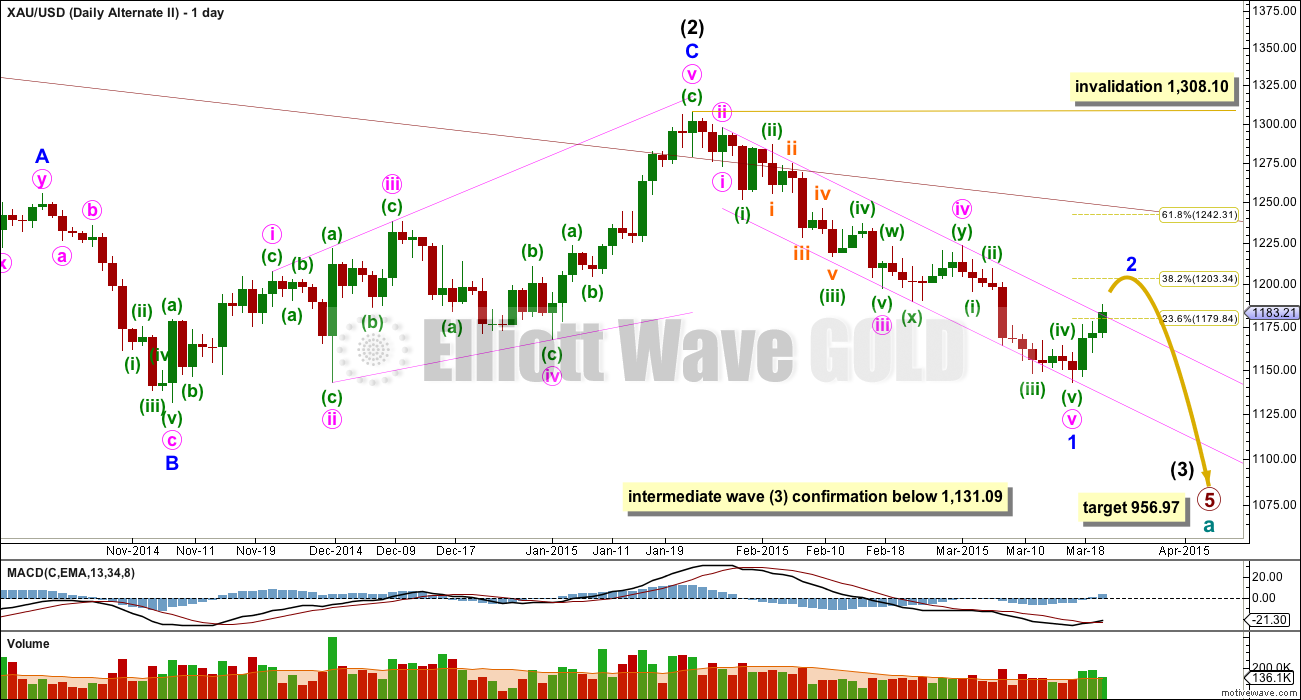
It has been suggested by a member that only minor wave 1 may be complete. I wanted to see if the idea fits EW rules and has the “right look”.
If minor wave 1 only has recently ended then it was an exceptionally long extension, lasting 38 days. Gold does not exhibit extended first waves commonly; it normally has extended third or fifth waves. That reduces the probability of this wave count slightly.
Within minor wave 1 minute wave ii lasted 15 hours and minute wave iv lasted 199 hours. Minute wave iv is more than 13 times the duration of minute wave ii. This gross disproportion substantially reduces the probability of this wave count and does not lend the “right look” at the daily chart level.
Minor wave 2 should breach the channel about minor wave 1. In this instance minor wave 2 may continue for another two days to total a Fibonacci five, and may end about the 0.382 Fibonacci ratio of minor wave 1 at 1,203. Minor wave 2 may last longer and move higher, to end about the 0.618 Fibonacci ratio at 1,242, but this would be less likely for a second wave within a third wave one degree higher.
If the blue trend line is breached on the daily chart I will use this wave count as an alternate.
This analysis is published about 06:35 p.m. EST.
High at 1,191.10 at 3:07 pm now in the target zone 1191-1193.
It looks to me like completed 5 waves, although want other opinions.
Because of delay today and didn’t close under green or blue channels I am undecided when and if and how it will drop now or overnight?
Nothing below 1185/83 in a hurry with 1180/79 holding below that…. Gold price ought to engage 1191-93 resistance cluster; a break above would likely target higher 1195-98… Ouch!
Gold just hit high of the day 1,189.46 at 2:38, maybe making a run for the 1,191-1,193 target zone?
Lara is minute ii target zone of 1,191 to 1,193 still in effect and then a strong downward movement or has today’s delay/indecision already reduced the main daily’s probability?
Richard Do you know what is the fib duration for wave ii?
I do not think wave 5 is going to give up this easy it has 19 more weeks to go after three years in bear trend.
The chart and written analysis show, minute wave ii it also would probably end about the 0.618 Fibonacci ratio of minute wave i about 1,193.
It is for the main wave count, but it looks like today’s candlestick is going to close green, above the trend line on the daily chart. The candlestick is touching the line, but it’s enough of a breech for me to swap the wave counts over.
The situation is unclear. I’ll have the alternate wave count now as the main wave count, and the second alternate as the first alternate and with a close to even probability.
I’ll label them main and alternate, but I think the probability is about even. The problems that each have are about of the same weight.
With 1180/79 holding, gold price would need to rise above 1190-91 first before being engaged by a resistance cluster at 1191-93, a break above will likely seek 1195-98…. At first sight gold price does not look like dropping below 1180/79 in a hurry. Lets wait and see!
Gold just hit 1,189.31 at 10:23 am and may now be heading for 1,191 to 1,193 target zone for minute wave ii, which may be followed by very strong downward movement. Silver just hit 16.98 at 10:53 and may be heading for 17.267 target. Lara said the final small part of minute ii would complete early in Monday’s session.
Anyone have a wave count now? Was that 1,189.31 just the top of the 3rd for wave 5 circle to end minute wave ii?
we will have to see a $20 drop in gold yet today to get back under the blue trend line.
You’re right about needing a $20 drop today.
If gold hits 1,193 upper target zone then main daily needs gold down below the blue channel, which at about noon will be at 1,173.
The green channel will cross 1,180 at noon today.
This main wave count needs to see a third wave
down begin before I will have any confidence in it. Initially a breach of the green upwards sloping channel on this hourly chart would provide some confidence in this main wave count. One full hourly candlestick below the green channel would provide ‘trend channel confirmation’.
It will not make it. Time to switch the wave count
I wouldn’t give up so yet on the main daily.
Who knows if it will continue up or down now. It may have already starting working it’s way down and may pick up speed, ?
It is possible to get a $20 drop today!
Would help to clarify the wave count.
Only time or Lara will tell.
papurdi you were right. Time to switch counts. Darn. Oh well I didn’t own anything today anyways.
Micro 5 might be an ending diagonal and it could be over.
That is definitely important to know as if that is the case than you are suggesting gold may have topped for the day at 10:23 am at 1,189.31 for micro 5 circle, minute wave ii? Then minute wave iii may provide clarification hopefully within the hour if gold has topped or else begin very strong downward movement?
This upwards move seems corrective again. So I don’t see the end of ii yet. The structure today could be an expanding triangle – but they are so rare. In that case: down to 1177 and then up to 1193. Who knows …
For those of you expecting a substantial break, but don’t want to bet on which direction, a good trading strategy can be a straddle. 🙂
What is a straddle trade? Is it in option trade?
Exactly, you buy both sides and as long as there is enough movement either way (volatility) you win.
Google for elaboration/examples.
It could be possible Lara’s EW analysis wave ii is complete and the 3rd of 3rd of 3rd wave is about to begin. Todays action should resolve this.
I think which way gold goes at 1,191-1,193 (Lara’s target) will signal the direction UP or DOWN.
This analyst agrees with 1,190-1,193 resistance area as point of decision for gold and it will be effected by the strength of the US dollar..
http://www.kitco.com/news/2015-03-20/Gold-Could-Push-To-1200-Next-Week-If-US-Dollar-Remains-Weak.html
Gold is falling in terms of almost all major FX except for the US dollar. That’s not terribly bullish.
One other note, gold options expire this week and the sweet spot is just north of 1200 it appears, which would be consistent with another move up and the 2nd daily alternate.
Correct – futures traders are shifting out of the April contract to June. Since there was heavy selling over the last few weeks, they have to buy to liquidate…thereby pushing the gold price up temporarily. The process is already underway, but the exact day that buying stops is not clear. My target date for the next leg down (if it doesn’t happen in the next few hours per main wave count) is between March 25-31.
Thanks for the follow up, and the insight. Options are Wednesday and Futures need to roll by Friday the 27th. Should have a great week to position for the next big drop.
Futures traders should be out well before the 27th.
Actually, to be exact, Monday the 30th is the last day when positions are rolled into the new contract. This is the day before “first notice.” In other words, I think that the longs will have completely dried up by then.
I make no claim to EW skill so will not attempt to identify a wave pattern but will say I see gold ultimately going lower–got to break below 1000 maybe 900, 800. So I accept EW analysis that allows this lower gold scenario.
Reason: These are unique economic times, long held norms of analysis may not apply. Euro will continue to have problems, capital will flow to safety which is US dollar (which may correct but will go higher) and US equites (which may correct but will go higher). Higher US dollar and US equities push gold down BUT at some point the world realizes even US economy is a fraud, causing capital flow move to gold for safety–gold moves up.
I look to EW and appreciate Laura skills and comments on this board to help me navigate this journey.
Lara, in the 2nd alternate, could it be that minute waves i and ii of minor 1 should be lower? I was thinking that they may fit well at the points you have marked as minuette waves i and ii. That is, move the pink circles down to where the green parenthesis are.
It doesn’t work on the hourly chart. Minute i would look like a three wave movement on the daily chart, and also on the hourly, where I am really struggling to see it as a potential five there. It just won’t fit.
That’s pretty much why I placed them where I did.
Lara, while I am definitely in the short camp, I am no longer of the belief that gold will turn around in the next 24-48 hours. Instead, I am now looking at your 2nd daily alternate as the most viable count – it matches up with all of my other analysis.
Upward movement will only last a few days, not weeks, and may well surprise traders when that 3rd wave down appears. It will likely be ferocious.
If it comes down to you having to discard your main count, what will tell you that your bullish daily count (the current alternate) should become the main? My preference would be that you make the 2nd daily alternate the main count.
Thanks.
Lara, I think Matt has a good point here. Silver seems to support the idea that gold may make a clear upward break of the channel and that this upward move in gold is possibly a higher degree correction with a little more room to run. When you look at your Silver count, what is it telling you?
I’ve finally worked out a count for Silver on the daily chart. Will be published tonight.
“A new high above 1,223.33 would invalidate the main wave count and
confirm this alternate. Before that price point is passed a clear breach
of the blue channel about intermediate wave (2) with one full daily
candlestick above the upper blue trend line and not touching it would
provide trend channel confirmation for this wave count. At that stage it
would substantially increase in probability and I would swap the main
and alternate wave counts over.”
Lara, does it mean that after gold draws full daily candlestick abov the blue channel, you will make the alternate the main wave count and second alternate the only alternate?
Yes, I believe that is what Lara will do. However, if gold were to move above 1223 – if it even gets that high – the 2nd daily alternate should be just as valid. Personally, I’ve never been a fan of the current alternate.
I see strong arguments for gold to depreciate in light of change in monetary policy. But now we have printing in Europe and more dovish FED. If the current economic situation in US worsen, we have zero interest rate policy forever. Same if Chinese housing bubble deflation will start to pose problems elsewhere… So there are good arguments for bulls and for bears 🙂 just like there are viable wave counts for bulls and bears 😉
Technically speaking, gold hasn’t hit its washout phase yet. That makes me 100% certain that gold will go lower – probably to the 1000 mark, or briefly into the 900s before it hits rock bottom. Timing wise, this will probably be in the summer months. Thereafter, I plan on becoming a long term holder of gold for all of the reasons that the perma-bulls have been arguing for years.
For right now, there will likely be a few days of upward movement.
Amen!!!! I am in your side and could not wait for that day in Summer Jun -Jul low. From that day on gold will have seasonality wind behind it to go higher.
Yes.
Very possible.
The very bullish alternate, the first alternate, really needs a new high above 1,308.10 now for full confidence in it.
Bullish arguments:
– Speculators bullish positions lowest since 21 Jan 2014:
http://www.investing.com/analysis/gold-speculators-bullish-positions-continued-to-slide-sharply,-drop-245758
– RSI signaled trend change
– Daily MACD signals trend change.
– USD correction (?)
I am in favour ofsecond alternate.
A reputable blogger posted this gold annihilation weekly chart. POR stands for Point of Recognition that gold is in bear trend.
Enjoy!!!
I trust Lara’s primary wave and all charts pointing for wave 5 target.
http://www.investing.com/analysis/$8-billion-gold-liquidation-245781
Hi anything about Silver?
Sorry it’s taken so long Ursula. I’ve finally got a wave count for Silver that I’m happy with at the daily chart level. It will be published tonight my time, and I’ll make sure it is.
Anxiety over gold’s action is heightened. But chart tells different story:
Gold’s weekly chart breakout and back testing bottom breakout.
Found this on a blog.
Thanks for this. Why do you make of it?
What I make of this is gold bottom is about to fall of the bottom line just like it did in 2013 after a long sideway choppy correction. This appears to be a symmetry and a final low in gold will happen. This does not look like a bottom. IMHO.
But the blue area was clearly a range trade – it’s a rectangle pattern. Whereas the red area is a wedge pattern.
The ADX indicator tends to lag price.
In Second Alternate Daily Wave Count, I don’t understand why minor wave 2 is most likely 0.382 than 0.618, Lara? Can you explain it, please?
0r anyone, please?
because it’s a second wave correction within a third wave one degree higher. the strong downwards pull of intermediate wave (3) may force minor 2 to be more brief and shallow than otherwise.
it doesn’t always work like this, but it happens often enough for it to be a tendency to look out for
in my opinion, somewhere in between 0.382 and 0.618 is the most likely of all.
Very valuable and useful analysis by Lara highlighting
in fair detail various possible outcomes, a main wave count and two
alternatives with the main wave count struggling to stay valid! Thank you Lara….
JUST A VIEW: Gold price currently overbought and bullish having closed at or
about 20dma basing off 20dma (1181/80) and below that its pivot 1180/79 and appears bottomy here with 1174/73 holding below there…. Gold price seems to have changed short term direction to up (up move from 1149/46, up move from 1169/68)…. Short
term up move / rally (upturn) is expecting from current levels / pivot to break
above 1183/84, 1187/88; hourly RSI has enough in it to take gold price higher, stochastic
and MACD are bullish, ADX has weakened the downside suggesting for gold price
to continue to rise. A break above 1190-91 would likely look to seek 1195-98…. Sentiment: Bearish Gold with risk, keeping it short as long as gold price is under 100dma (1207/08) however will need to make allowance for an uptick; a break below 1173/71 looks unlikely at this stage but if it does occur, should look to test 1160, one never knows when the bears can strike lol – expect the unexpected!…. ||WEEKLY
OUTLOOK: Trend is down but short term Gold price appears bottomy playing to a
buy signal, a bullish key reversal; ROC & Momentum appears to be slowing
suggesting for an upturn in Gold price. The weaker shorts may want to consider covering
and taking to the sidelines; Gold price expecting to rally / short term up move; remains to be seen how far up the Gold bulls can take this! Good luck.
Lara, I am not as skilled in EW as some others, but i have seen an EW analysis that shows the drop from 1308 to 1144 to be a B Wave, and we are not starting a C wave. Does this have a possibility or have you ruled this out already?
Wave B dasn’t 5 waves. Move down is clear 5 waves. I see first wave down and now correct 2 up possible 1220-1245
Wave B dasn’t 5 waves. Move down is clear 5 waves. I see first wave down and now correct 2 up possible 1220-1245
First: yes, that could be seen as a complete zigzag which a B wave may be.
Second: it has to fit into the bigger picture.
Without a chart of the idea showing the bigger picture I can make no common on whether or not the idea has merit.
The COT structure appears to be very bullish, similar to July 2/9 2013 COT report.
Lara, thanks for going back and sharing your thoughts on several of the posts in the prior session. Even though the regular session of the NYSE may have been closed and your replies may be up to several hours after the original post, your thoughts are appreciated. We can all benefit from scrolling back through and reading them so that we’ll be better prepared for future situations that may play out in similar patterns.
Excellent points Bob much valuable analysis is provided to assist us in these somewhat indecisive times.
O yes.
You’re welcome. I was another frustrating week. I’m really wanting next week to give us clarity. One or the other of the main or alternate wave counts needs to be confirmed / invalidated.
As Syed above notes there are plenty of TA indicators pointing to a bullish run at least short term.
From an EW perspective the situation looks bearish.
So this is one of those occasions when my EW analysis disagrees with many other analysts TA. Members will have to take all the evidence into account and make decisions based upon your risk appetite next week.