
Upwards movement was again expected. We have a new high. Downwards movement was not expected to be this deep though.
I have a new Elliott wave count for you to consider today, and price should tell us very quickly if it is likely.
Summary: This correction is too deep. The main hourly wave count now requires a new high above 1,223.33. If we get that confirmation I will have confidence in the target at 1,240 – 1,243. Alternatively, if we see a new low below 1,204.53 the second wave will most likely be over, and the middle of intermediate wave (3) should have begun. The target for a strong third wave down would be 1,055.
Click on charts to enlarge.
Main Daily Wave Count
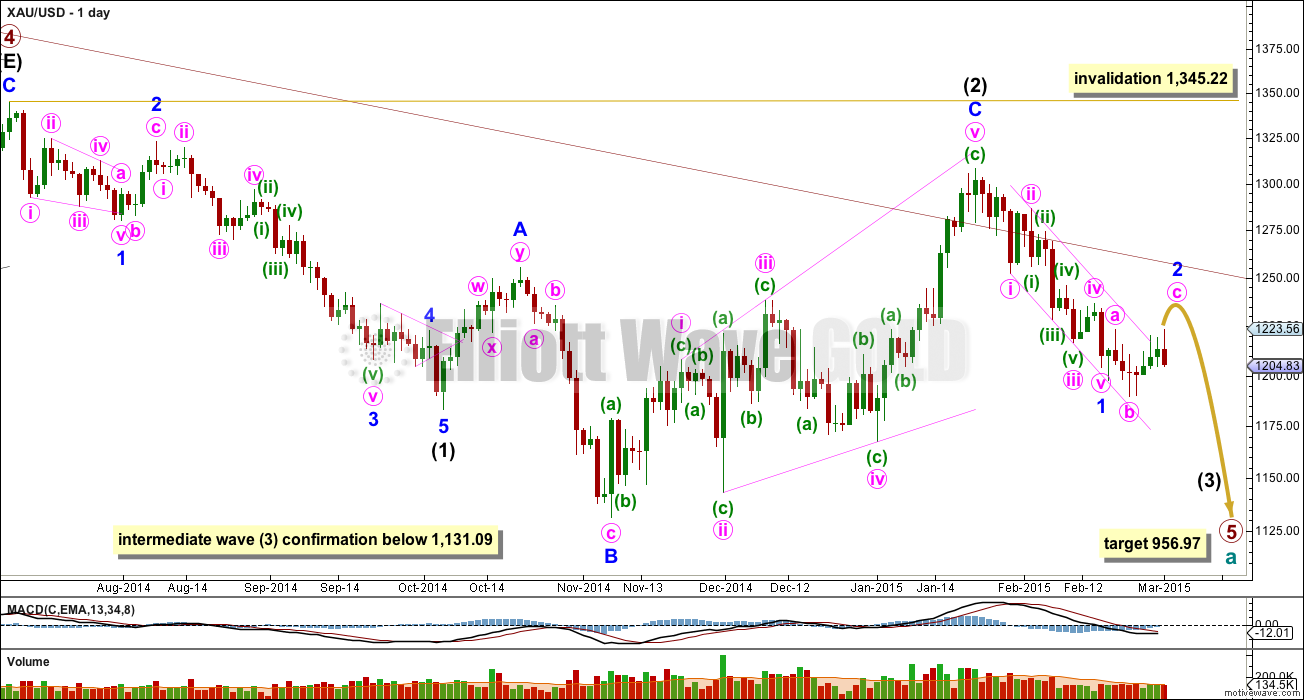
This main wave count sees Gold as still within a primary degree downwards trend, and within primary wave 5 intermediate wave (3) has begun. At 956.97 primary wave 5 would reach equality in length with primary wave 1. For Silver and GDX this idea, that the primary trend is down, is the only remaining wave count. This main wave count has a higher probability than the alternate below.
The maroon channel about cycle wave a from the weekly chart is now breached by a few daily candlesticks and one weekly candlestick. If cycle wave a is incomplete this channel should not be breached. The breach of this channel is a warning this wave count may be wrong, and so I will still retain the alternate.
Draw the maroon trend line on a weekly chart on a semi-log scale, and copy it over to a daily chart also on a semi-log scale (see this analysis for a weekly chart).
Within primary wave 5 intermediate wave (1) fits perfectly as an impulse. There is perfect alternation within intermediate wave (1): minor wave 2 is a deep zigzag lasting a Fibonacci five days and minor wave 4 is a shallow triangle lasting a Fibonacci eight days, 1.618 the duration of minor wave 2. Minor wave 3 is 9.65 longer than 1.618 the length of minor wave 1, and minor wave 5 is just 0.51 short of 0.618 the length of minor wave 1.
Intermediate wave (2) is an expanded flat correction. Minor wave C is a complete expanding ending diagonal. Within an ending diagonal all the sub waves must subdivide as zigzags. The fourth wave should overlap first wave price territory. Expanded flats are very common structures and ending diagonals are more common than leading diagonals.
This wave count has more common structures than the alternate wave count, and it has a better fit.
A new low below 1,131.09 would confirm that a third wave down is underway.
Intermediate wave (2) may not move beyond the start of intermediate wave (1) above 1,345.22. If this invalidation point is passed this wave count would be fully invalidated.
Within intermediate wave (3) minor wave 1 is a completed impulse lasting 18 days. Minor wave 2 is either an incomplete expanded flat which may continue to end in another two or four days (main hourly wave count) or it is a completed double flat correction which lasted 9 days (alternate hourly wave count below).
Main Hourly Wave Count
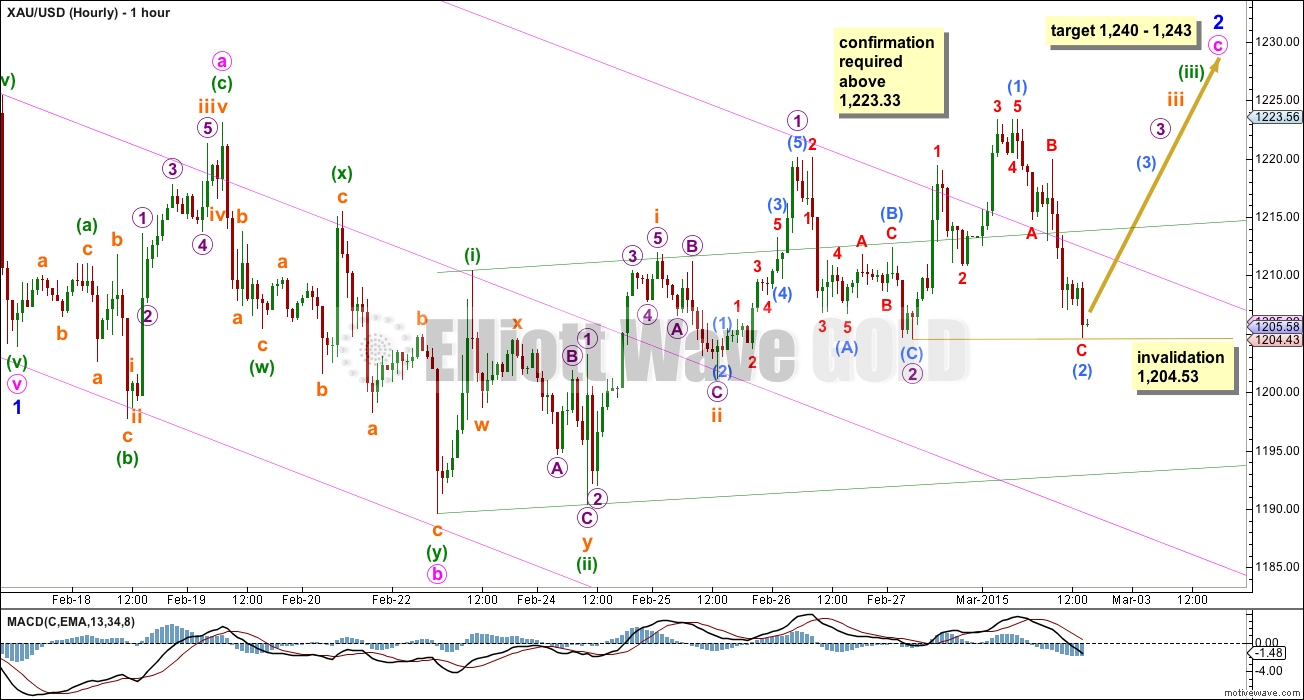
Within minor wave 1 minute wave v ended right at the lower trend line of the channel drawn using Elliott’s first technique. Minute wave ii is a deep 0.61 double zigzag and minute wave iv is a shallow 0.29 triple zigzag, so there is some alternation between them although not as much as normal for Gold.
Minor wave 2 may be unfolding as an expanded flat correction. Within the expanded flat of minor wave 2 minute wave a itself subdivides perfectly as an expanded flat with minuette wave (b) as a 187% correction of minuette wave (a), and there is no Fibonacci ratio between minuette waves (a) and (c) (but that is not unusual for Gold).
Minute wave b subdivides perfectly as a double zigzag and it is a 174% correction of minute wave a. Minute wave c has so far moved very slightly above the end of minute wave a, which was at 1,223.10, and a truncation and a very rare running flat was avoided. However, I am unable to see minute wave c as a completed five wave structure. A diagonal will not fit in any way within this movement, and an impulse would be incomplete. This wave count requires minute wave c to move higher to complete. At 1,240 minute wave c would reach 2.618 the length of minute wave a. This is just below the 0.382 Fibonacci ratio of minor wave 1 at 1,243, giving a $3 target zone.
Minor wave 1 lated 18 days, with no Fiobnacci duration. So far minor wave 2 has lasted 9 days. If it ends in two more days at 11 days total it may be 0.618 the duration of minor wave 1. Or it could continue for another four days and total a Fibonacci 13.
I am concerned that price is not behaving as expected for this wave count today. Once the green base channel and the pink channel about minor wave 1 are breached, they should provide support, but they are not. If minute wave c is moving towards the middle strongest portion we should see short brief corrections, not full 100% time consuming second wave corrections. This no longer has the right look. This wave count now requires confirmation with a new high above 1,223.33 before I have confidence in it.
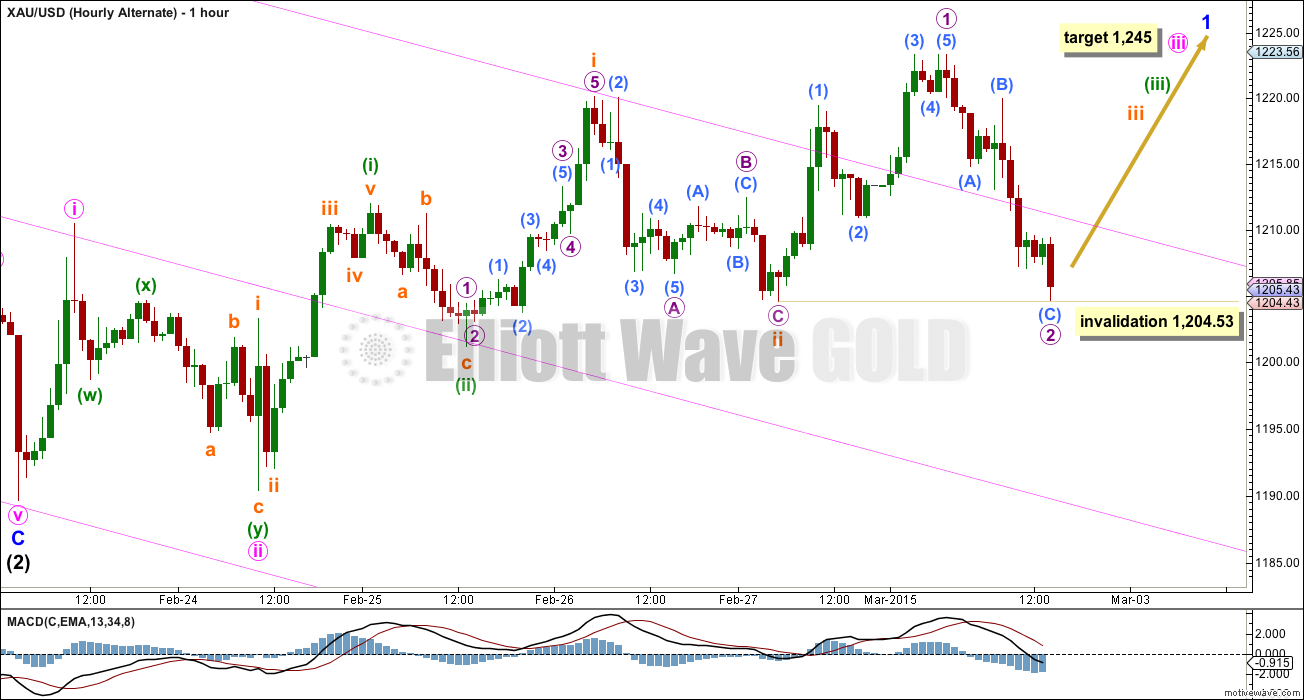
Submicro wave (2) may not move below submicro wave (1) at 1,204.53.
Please note: because 1-2-3 and A-B-C of a zigzag subdivide in exactly the same way (they both subdivide 5-3-5) this idea also works for the alternate below. There, intermediate wave (2) may not be over and minor wave B may also be unfolding as an expanded flat correction.
Alternate Hourly Wave Count
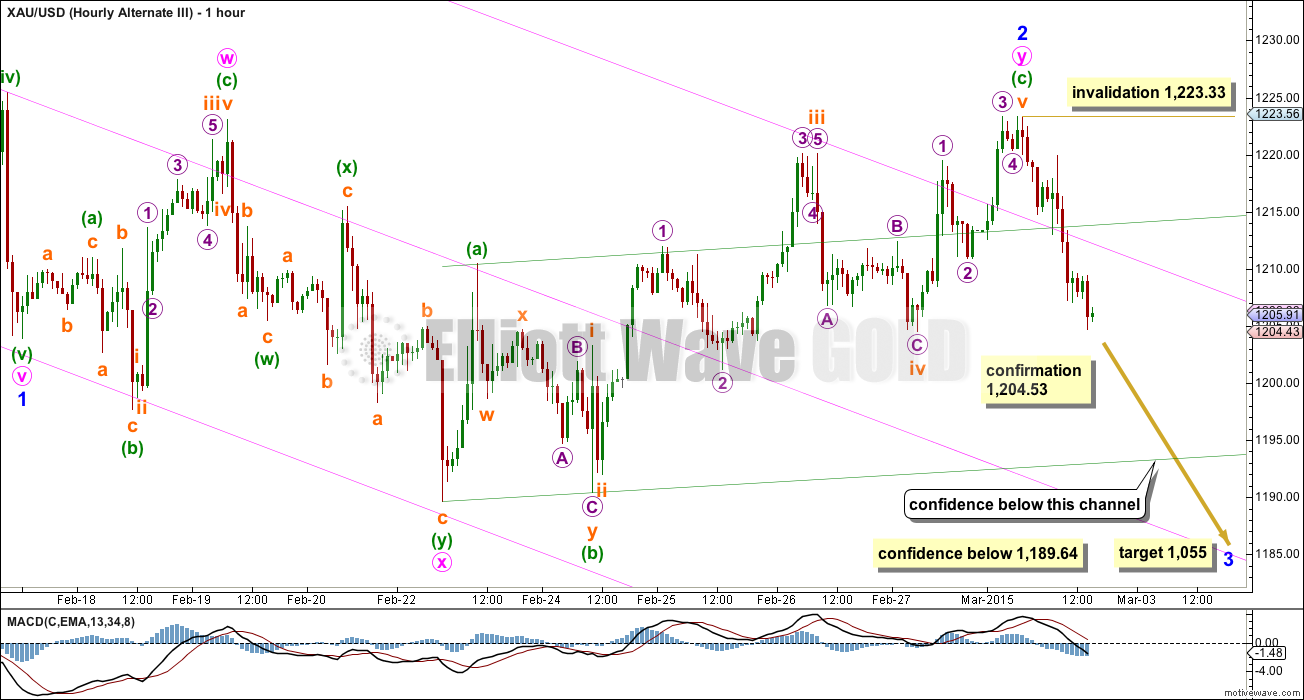
Minor wave 2 fits as a completed double flat correction. The first structure in the double is an expanded flat labelled minute wave w, and the subdivisions here are exactly the same as the main hourly wave count. The double is joined by a “three”, a double zigzag in the opposite direction labelled minute wave x. The second structure in the double is a regular flat labelled minute wave y.
Minute wave w is a very typical looking expanded flat correction.
Minute wave y is a rather atypical looking regular flat correction, but the subdivisions fit. Within minute wave y minuette wave (c) is just 0.72 short of 1.618 the length of minuette wave (a).
Ratios within minuette wave (c) are: subminuette wave iii has no Fibonacci ratio to subminuette wave i, and subminuette wave v is 1.46 longer than 0.618 the length of subminuette wave iii.
Double flats have the purpose of taking up time and moving price sideways. To achieve this purpose the second flat in the double usually ends about the same level as the first, so this wave count in that respect has the right look.
If this wave count is confirmed it would be highly likely that minor wave 3 is underway. Depending upon your risk appetite you may want to see the channel about minute wave y breached and / or a new low below 1,189.64. When the channel about minute wave y is breached with downwards movement I would have increased confidence in this wave count. I would have full confidence in it with a new low below 1,189.64.
Alternate Daily Wave Count
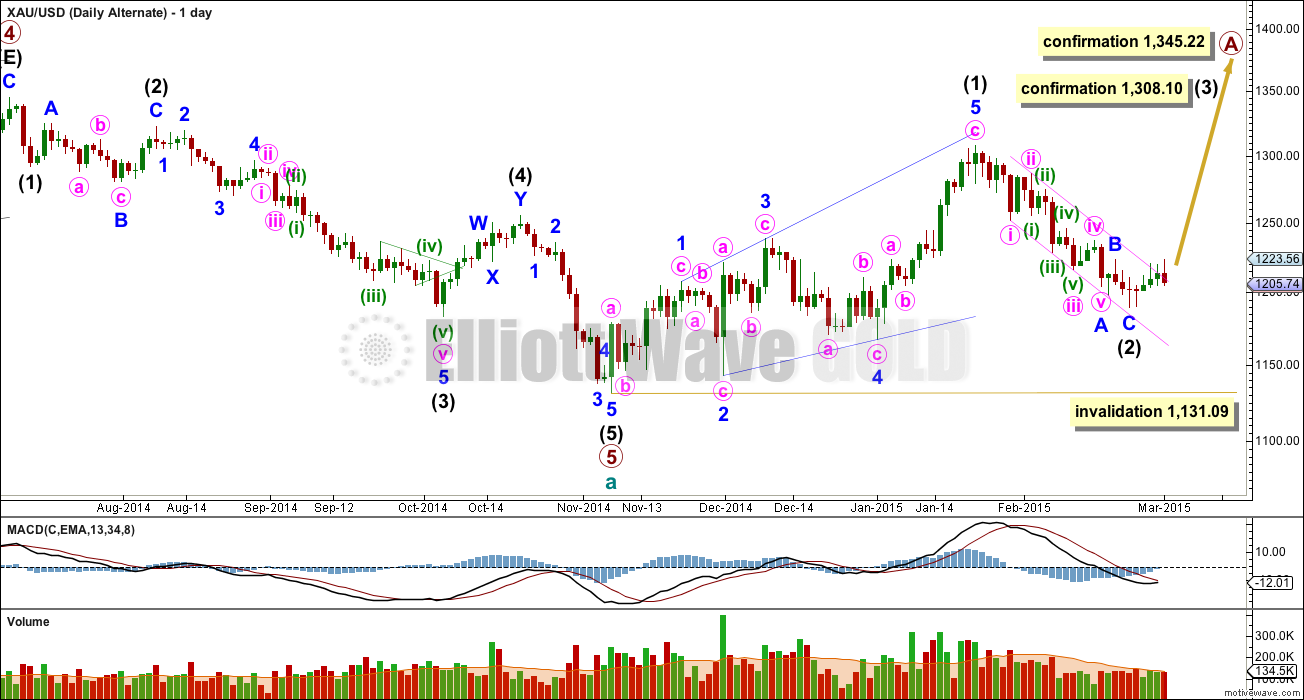
At this stage I judge this alternate wave count to have a lower probability. The structure of downwards movement, and momentum, will determine which wave count is correct over the next few weeks. At this stage they both expect more downwards movement so there is no divergence in the expected direction.
This wave count sees a five wave impulse down for cycle wave a complete, and primary wave 5 within it a completed five wave impulse. The new upwards trend at cycle degree should last one to several years and must begin on the daily chart with a clear five up.
The first five up may be a complete leading expanding diagonal. Within leading diagonals the second and fourth waves must subdivide as zigzags. The first, third and fifth waves are most commonly zigzags but they may also be impulses. This wave count sees minor waves 1, 3 and 5 as zigzags.
Leading diagonals are almost always followed by deep second wave corrections, sometimes deeper than the 0.618 Fibonacci ratio. It is possible now to see intermediate wave (2) as a deep 0.67 single zigzag. If it is over it may have lasted just a little under half the duration of intermediate wave (1).
My biggest problem with this wave count is the structure of intermediate wave (2) within primary wave 5. This is a rare running flat but the subdivisions don’t fit well. Minor wave C should be a five wave structure, but it looks like a clear three on the daily chart. If you’re going to label a running flat then it’s vital the subdivisions fit perfectly and this one does not. This problem is very significant.
Within intermediate wave (5) minor wave 3 looks like a three on the daily chart, where it should be a five. This movement may also be labelled with minor wave 3 ending higher and minor wave 5 looking like a three. Either way, one of the actionary waves within this downwards movement will look like a three and not a five which does not have the “right look” at the daily chart level.
Intermediate wave (2) of this new cycle degree trend may not move beyond the start of intermediate wave (1) below 1,131.09. I am leaving the invalidation point on the daily chart here because it is still possible that intermediate wave (2) is not over, because it may be continuing as per the main hourly wave count above.
Intermediate wave (3) upwards may have begun. It would be beginning with a series of overlapping first and second waves, and so an increase in upwards momentum should be seen also for this alternate idea.
Alternatively, if we see a new low below 1,204.53 then for this alternate I would expect that intermediate wave (2) is not over. The subdivisions for this alternate would be seen in the same way as the hourly alternate wave count above, because A-B-C and 1-2-3 may subdivide in exactly the same way.
This analysis is published about 03:53 p.m. EST.
March 3rd Update out now. Analysis is published about 03:16 p.m. EST.
Anyone still holding NUGT? We seem to be against the trend right now.
A VIEW: Hi. The line in the sand to take out 1193…. For the shorts its back to the drawing board to take down 1202-01, 1197-96 all over again. The 1223 high on Monday probably marked a significant short term turning point, next stop down ought to seek 1185….
New gold EW today, the counts don’t look right.
http://bit.ly/17NCzlx
Your wave 4 invades the space of wave 1. Look at how Lara labeled Feb 24-25.
1190 this time?
This is my assessment of the movement since yesterday. Minor 2 was over at 1223.33 as gold price could not break the resistance at 1224.60. The drop to 1196 was the first sub-wave of Minute 1 downwards. It would be Minuette 1. (The drop was too deep to be part of Minor 2). We are now in a long drawn out Minuette 2. Minuette 2 comprises 3 sub-waves (SM a, b, c). We have completed the second (SM b), and is now going up in 5 waves in the third sub-wave (SM c). At this point, I would say we are at the fifth of the five waves, and the whole of Minuette 2 should complete soon, unless Minuette 2 morphs into a complex correction. The end point cannot exceed 1223,33 as it would invalidate the movement.
The drop in the fourth wave is still continuing. My wave count could be wrong, and we have completed Minuette 2 at 1214.88.
Thanks for sharing your wave counts. wave counts are along the line of Lara’s primary count????
I’ll take them to be.
Matt–is Matt here, would appreciate hearing his opinion where we are now based on recent gold moves.
I have to agree with Lara’s wave count now. Right after gold move down from 1223 in a clear 5 waves down
I think the idea of gold rallying today is slim, doesn’t make sense after last night’s drop and Lara’s warning and revised charts. I’m glad gold went up after the open and used that as chance to sell all my GDX and looking to buy some DUST.
Gold already exceeded retrace .618 at 1212.72 and then hit high today of 1214.87 at 9:57 am. I think that may have been the top of a 5th wave?
if that happens then projected target of falling wedge break 1232>> falling wedges breaks upwards
I calculate .618 retrace at 1212.72
1223.32 0:45 am – 1195.56 9:11 pm low x .618 + 1195.56 = 12312.72
Gold’s daily possible HnS in few days and then Lara’s wave down unfolds to 956??
I posted it on 20th of February and then again on i guess 24th of feb
anyone interested in nzd/usd
that might help
From Kimble charting
just for the sake of the argument, let’s say, a head and shoulder is forming. can someone suggest a target for the right shoulder? Thanks.
Right shoulder around 1236-12340 on daily chart. Waseem had pointed out
the possible HnS. Gold just made the 2nd price pt of right neckline
@1195????
It is forming in daily chart and daily resistance is at 1230-1231
Thank you.
Thank you. I spend 20 minutes looking for that post from Waseem but never found it.
I posted it on 20th of February and then again on i guess 24th of feb
Waseem – do you still have confidence in this projection?
i think that will do for you…
Lara, Minor wave 3 that started Monday would it have less retracing and more descending?
Just asking as gold lately has had daily wild swings where gold is making big changes in direction every day and you don’t know what investment to hold overnight and almost just have to just day trade and do .618 calculations every mornings before the open.
In the beginning we may see another more time consuming correction for minute wave ii. Once that is done, it should fall off a cliff.
Corrections should be more brief and shallow than usual. Downwards movement should be very strong indeed.
My take on an update to Lara’s GDX count. I think minute wave 2 (pink) up is complete as an expanded flat with minuette wave (c) (green) equal to 1.61 the length of minuette wave (a) (green). Seems to fit real good. High volume on today’s down day. If this is correct, it could fall hard.
Bob B, Really like your GDX chart. Luckily I only have a little GDX, so I will switch over to DUST Tuesday a little at first then more once, “I would have full
confidence in it with a new low below 1,189.64.”
Richard
Gold just put in head last night at 1195-1198. Today if gold goes above 1212 target will be 1240 to 1250 from this inverted HnS. Neckline at 1212. Short term gold seems to be bullish.
Before closing bot some JNUG yesterday.
Has the Alternate Daily Wave Count gone as well because intermediate wave two has ended as the main hourly wave count has been invalidated?
No. For the alternate I’ll change the hourly count to the same as the new count for the main wave count.
The alternate will have minor waves A and B complete, and minor wave C down beginning.
Where the main wave count now has minor waves 1 and 2 complete and minor wave 3 down beginning.
Because 1-2-3 subdivides the same as A-B-C (for a zigzag).
However, the alternate has reduced in probability further.
Gold just dropped at 8:30 pm EST down to $1,203.69.
Alternate Hourly Wave Count has been confirmed with a new low below 1,204.53. The second wave will most likely be over, and the middle of intermediate wave (3) should have begun. The target for a strong third wave down would be 1,055.
If this wave count is confirmed it would be highly likely that minor wave 3 is underway. Depending upon your risk appetite you may want to see the channel about minute wave y breached and / or a new low below 1,189.64. When the channel about minute wave y is breached with downwards movement I would have increased confidence in this wave count. I would have full confidence in it with a new low below 1,189.64.
Primary wave just got invalidated at 8:30 PM. Gold trading at $ 1203.69.
At the end of Lara’s Video she states, we should have clarity in an hour or two. Is she suggesting that a break of 1204.53 would most likely show up by then?
Either a strong move up or down is to be expected since gold is in a 3rd wave.
That’s what I was expecting, yes.
From time to time I have an alternative count to consider. What do you think about this: minor 2 is a double three: expanded flat, zigzag x, expanding (barrier) triangle. I attach the chart below. In this case we would have a target of about 1224 for tomorrow, no lower invalidation and a strong third wave downward after.
Your possible triangle for (y) is invalid: C moves beyond the end of A. This is neither a contracting nor expanding triangle. Take a look at the video on the education page titled “triangles” for an explanation of these structures.
The other thing you may want to consider here is you’re labelling a combination, the purpose of those is to move price sideways. This one is deepening the correction, not the normal look for a combination.
Thank you, Lara, for having looked at this! And thank you for the
insights. One question anyway: You always stress that the lower bound of
a barrier triangle is not black and white, do you? So why would it have
been invalid? After Hong Kong today it could be expanding – very rare,
but why not. Anyway: I really really appreciate your work! It is always
simply awesome.
Gold daily chart has breakout below the neckline of Hns and a resistance channel drawn from wave ii and wave iv extended.
Tomorrow will determine the trend.
This chart was posted before it is an update.
Lara: I have mentioned this before in another post, but no matter where I look, I see the day after what you list as the recent low (1189) to be the lower day of the two. Could that be affecting your wavecounts? I may be dead wrong, but I am having trouble accepting both of your wave counts.
I am fairly certain that gold is in intermediate 3, but I don’t think that minor 2 is over. Moreover, I don’t believe that movement below 1204 would confirm this.
Matt: what do you expect we will see gold do?
I expect gold to fall to somewhere between 1204 and 1190. Thereafter, it should shoot up to Lara’s target or higher to complete minor 2.
I really believe that gold needs to correct a little more before minor 3 begins.
Given tonight’s price action so far, you may be on the right track.
The flaw in my idea is that the movement down from 1223 now looks like a clear 5 waves on the hourly chart. It should look like a 3 instead. More likely, Lara’s alternate is correct.
Different data feeds have slightly different data points. I don’t know exactly why, and AFAIK it shouldn’t be this way, but it is.
As long as I’m using the same data feed consistently the wave count will not be affected.
Hi Lara,
I take your point about the validity of using the same data consistently. However, there must be the odd occasion when it DOES make a difference.
Every data source I’ve checked for both spot and nearest futures shows a lower low on the 24th vs the 22nd. Since you have a wave ii ending on the 24th, treating the 24th as a lower low would change the count.
What I can’t work out is whether treating the 24th as a new low would increase the probability of the main hourly or the alternate hourly. Please indulge my concern with your comment.
Thanks
good point
I think if the low was on the latter date, one could argue that it marks the end of a 5th wave down. I still believe that gold has more to go on the upside. Whether it goes straight up from here, or dips slightly first is still open IMO. If the alternate is correct, then where is the momentum? Something is wrong here.
I can only use the data I have. I cannot begin to incorporate possibilities from other data sources, that just makes no sense.
And anyway, it wouldn’t make that much difference to the wave count. Unless the subdivisions for the different data sources are really different… in which case we’re back to my same response. Use the same data, consistently, for your wave count.
Main hourly count not sense for Main daily count?
Big rewards… Big losses… Never boring….
I stayed with NUGT…we’ll see…
Me also. Far from happy.
Big rewards… Big losses… Never boring…..
The latter seems to be on ‘rinse and repeat’ at the moment.
Looks good so far…tomorrow morning might be 1190…however let’s stay positive…
Yes, I bought in at close at 14.42. About 15 minutes before update… As long at we are 12 something at 2.30 GMT.
mines 14.44
I bought 7433… Fingers crossed for a move up…
You didn’t re-mortgage the house?