
The main Elliott wave count expected downwards movement. This is not what happened. The small channel was breached on the alternate hourly Elliott wave count, which was the first indicator it was more likely.
Summary: The main hourly wave count is discarded in favour of the alternate. A very short term target for Monday is at 1,215. The mid term target is at 1,267 for the middle of a third wave up.
Click on charts to enlarge.
Main Daily Wave Count
There are more than thirteen possible corrective structures that cycle wave b may take. At this stage it is unclear what degree to label this big movement. Primary wave A (or W) is an incomplete zigzag.
It is also possible that primary wave A will subdivide as a five wave impulse if cycle wave b is a big single zigzag. This idea would relabel intermediate waves (A), (B) and (C) to intermediate waves (1), (2) and (3) within primary wave A trending upwards. The length of this current upwards move labelled intermediate wave (C) on the chart will indicate if this scenario is possible.
Cycle wave b may be a flat correction where primary wave A is a zigzag. Cycle wave b may be a triangle where primary wave A is a zigzag. Cycle wave b may be a combination where primary wave W is a zigzag. Cycle wave b may be a double zigzag with the first in the double, primary wave W, incomplete.
When the big zigzag now labelled primary wave A is complete, it is also possible that cycle wave b could be over there with the degree of labelling within it moved up one degree.
When intermediate wave (C) is a complete five wave structure alternate wave counts will be required to manage the various possibilities of cycle wave b continuing.
A new high above 1,308.10 would invalidate the alternate and confirm this main wave count at primary and cycle degree.
The upwards wave labelled intermediate wave (A) fits only as a five wave structure, a leading expanding diagonal. Within a leading diagonal the first, third and fifth waves are most commonly zigzags, and the fourth wave should overlap first wave price territory.
Because intermediate wave (A) subdivides as a five, intermediate wave (B) may not move beyond its start below 1,131.09.
At 1,320 intermediate wave (C) would reach equality in length with intermediate wave (A). If price keeps rising through this first target, or if when it gets there the structure is incomplete, then I would use the second target. At 1,429 intermediate wave (C) would reach 1.618 the length of intermediate wave (A).
Because intermediate wave (A) is a diagonal then it is highly likely intermediate wave (C) will be an impulse in order to exhibit alternation. Intermediate wave (C) may end about the upper edge of the channel drawn about primary wave A.
This wave count sill has problems of structure within primary wave 5 of cycle wave a:
– within primary wave 5 intermediate wave (2) is a running flat with its C wave looking like a three and not a five.
– within intermediate wave (5) the count is seven which is corrective; either minor wave 3 or 5 will look like a three wave structure on the daily chart where they should be fives.
It is for these reasons that I will retain the alternate until price confirms finally which wave count is correct and which is invalidated.
At 1,303 minor wave 3 would reach 1.618 the length of minor wave 1. Within minor wave 3 minute waves i and ii are complete. Minute wave iii should have begun on Friday.
The base channel is adjusted to a best fit. The lower trend line may provide support. The upper trend line may be breached by a strong third wave up.
Volume for Friday was lower. Although this does not support this wave count, it is not necessary for the start of a third wave to begin with higher volume on its first day.
Friday’s session completes a bullish engulfing candlestick pattern. This is the strongest bullish reversal pattern.
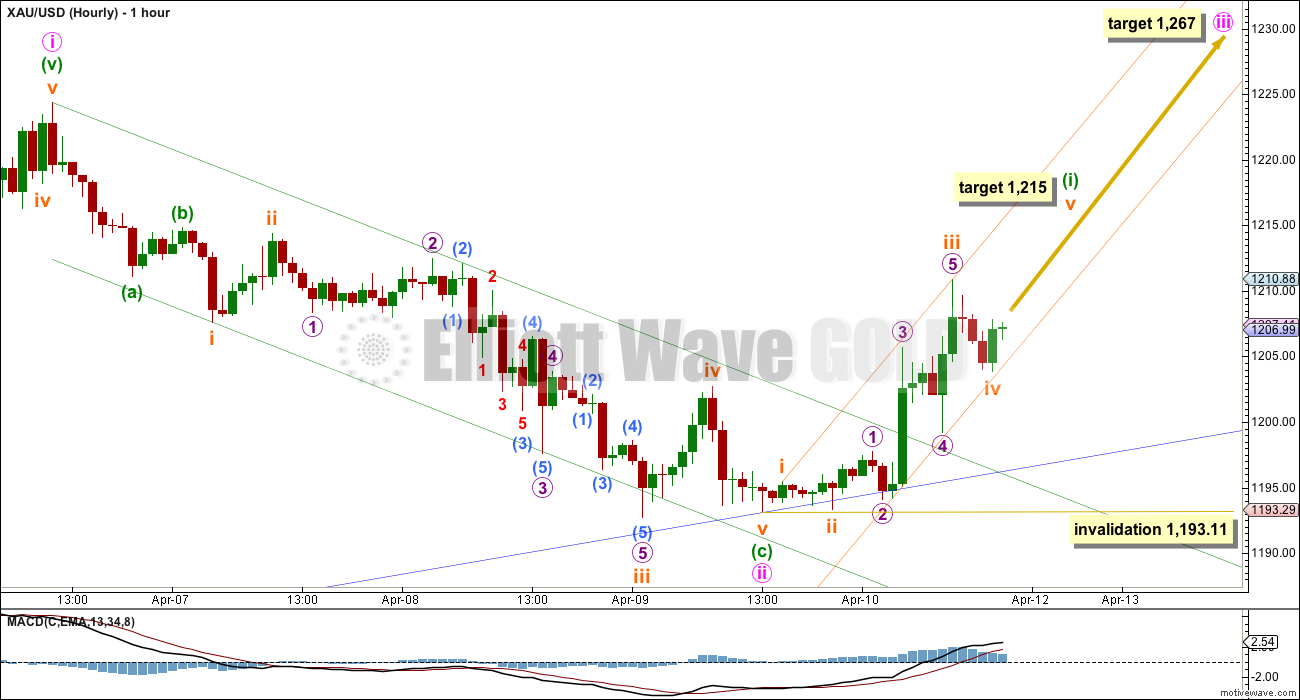
Within minute wave iii there is not yet a complete five wave impulse upwards.
Subminuette wave iii is 1.69 short of 6.854 the length of subminuette wave i.
Ratios within subminuette wave iii are: micro wave 3 is just 0.04 short of 2.618 the length of micro wave 1, and micro wave 5 is just 0.03 short of equality with micro wave 3.
At 1,215 subminuette wave v would reach 0.618 the length of subminuette wave iii.
When minuette wave (i) is complete then minuette wave (ii) should unfold downwards. It may not move beyond the start of minuette wave (i) below 1,193.11.
The mid term target for minute wave iii is at 1,267 where it would reach 1.618 the length of minute wave i. It may be met in a Fibonacci 5 or 8 days.
I have drawn a best fit channel about minuette wave (i). When this channel is clearly breached that should indicate minuette wave (i) as over and minuette wave (ii) downwards as underway.
Alternate Daily Wave Count
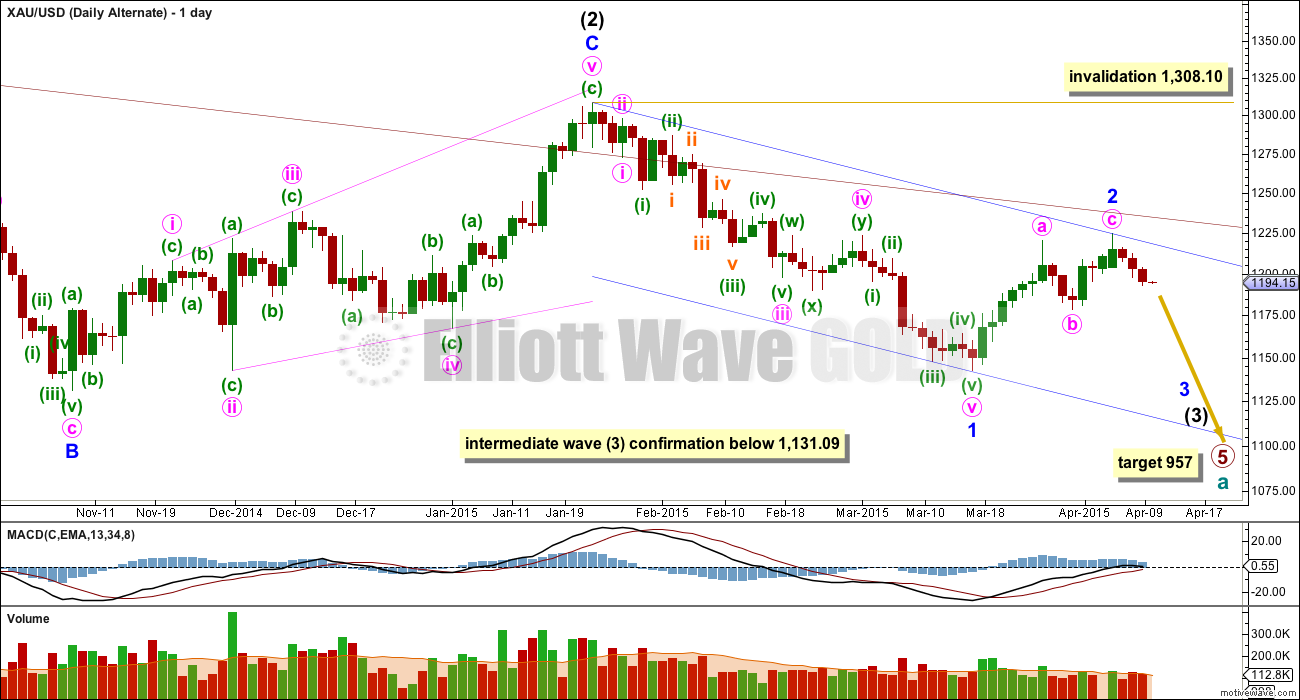
This alternate wave count sees Gold as still within a primary degree downwards trend, and within primary wave 5 intermediate wave (3) has begun.
At 957 primary wave 5 would reach equality in length with primary wave 1. Primary wave 5 may last a total Fibonacci 55 weeks. It has now ended its 39th week.
The maroon channel about cycle wave a from the weekly chart is now breached by a few daily candlesticks and one weekly candlestick. If cycle wave a is incomplete this channel should not be breached. The breach of this channel was the first warning this wave count may be wrong.
This wave count still has a better fit in terms of better Fibonacci ratios, better subdivisions and more common structures within primary wave 5, in comparison to the main wave count above.
Within intermediate wave (3) minor wave 1 is a long extension. Within minor wave 1 minute waves iv and ii are grossly disproportionate, with minute wave iv more than 13 times the duration of minute wave i. This also reduces the probability of this wave count.
Although the invalidation point is at 1,308.10, this alternate wave count should be discarded long before that price point is reached. If the maroon channel is breached again by one full daily candlestick above it and not touching it then I would discard this alternate wave count.
A new low below 1,131.09 would confirm that intermediate wave (3) down is underway.
Minor wave 2 would now be a completed zigzag. If this alternate is correct it should show itself this week. It now expects a big increase in downwards momentum as a third wave at two degrees begins to gather momentum. An increase in volume as price moves lower would support this wave count. A new low below 1,178.59 would be a strong indication this wave count may be correct.
The green candlestick for Friday’s session (seen on the main wave count) corresponds with lower volume. This does support this alternate wave count. It remains viable.
This alternate wave count remains technically possible. Because the implications are important I will continue to publish it at this stage.
Updated Hourly Wave Count
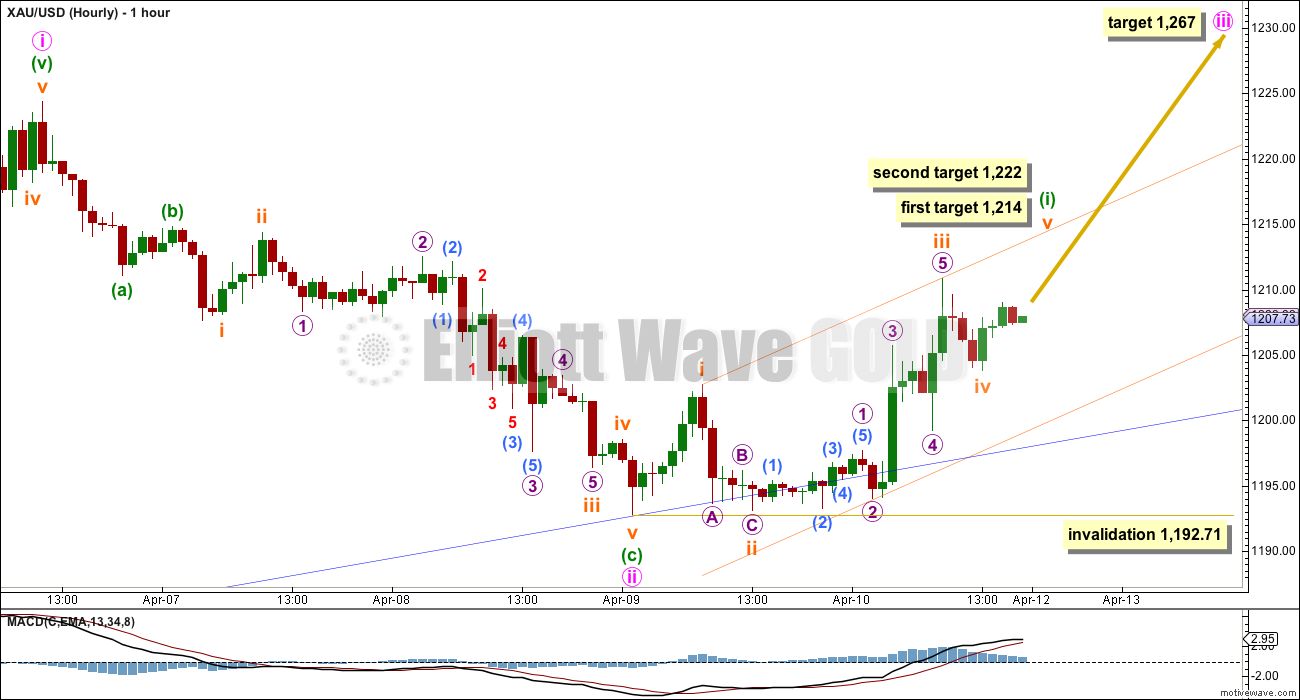
After some consideration I’m changing the hourly wave count a little. It makes no difference to expected direction and changes the short term target only from 1,215 to 1,214. It makes no difference to when the next deep correction for minuette wave (ii) should arrive.
If minute wave ii ends at the price low this avoids a slightly truncated fifth wave, which looked like a three wave movement on the first hourly chart.
This wave count sees the first wave up from the price low as a five wave impulse. On the five minute chart this movement is ambiguous: may be seen as either a zigzag or an impulse.
Within minute wave ii minuette wave (c) is 0.67 longer than 1.618 the length of minuette wave (i).
Within the new upwards movement subminuette wave iii is just 1.57 longer than 1.618 the length of subminuette wave i. At 1,214 subminuette wave v would reach equality in length with subminuette wave i. If price keeps rising through this first target the fifth wave may be extending. The next target would be at 1,222 where it would reach equality in length with subminuette wave iii.
Minuette wave (ii) may find support at the lower edge of the dark blue channel copied over from the daily chart (this is unchanged from first analysis).
The invalidation point is slightly lower: minuette wave (ii) may not move beyond the start of minuette wave (i) below 1,192.71.
This analysis is published about 11:53 p.m. EST.
Analysis updated at 02:19 a.m. EST on 12 April, 2015.
Yup Richard I have seen that too…Just wanted to reply to the message that Lara had posted
April 13th analysis is out.
Thank you Lara. I agree, looks like 1240+ levels will hit first and the bulls are not ready to lower it below 1192. This stands as a strong base even on the daily chart. From a count perspective I expected 3-3-5 movement however it turned out to be a double zig-zag
These movements make us get into a trading zone with the wave 2 now forming an (a,b,c,d, e) phase. I’m sure post this gold will shoot up high
2nd waves can’t be triangles .
The bears have almost no volume…. the volume spikes are all bullish…. The ADX is very low when the bears make a small move….. good luck to us !
I agree on the volume indicator and feel the structure just looks very constructively bullish. I’m not sure what all the panic is about but nothing is certain.
Mark you have a good focus on buying low at the bottom trend lines and selling high at the top trend lines, which is great if you have successful tract record doing that.
The panic may be about Lara’s projection didn’t follow through as we hoped, which is difficult to do anyways as exact gold movements are somewhat unpredictable. Also if many try and follow the exact EW count which is very complex and gold direction not going as planned and exact wave count is unknown than fear sets in. Meanwhile you got your cheap buy at bottom trend line and and expecting gold to head for top trend line.
my target for this upwardmovement starting from 1142 is the 1250-zone but maybe we dont even get there.
Im
sure we will not make new highs above 1308 before we will have gone
deeper to new lows. the
manipulation is going on and price is rising too weak relativ to
construction of longpositions by the specs in the last 2 COT reports.
this will cause a classical bloodbath. Price was retarded the last two
cot reports. Gold had a good clearing up but the manipulators were still
to high short and they have been raising their shortposition further now by
rising prices the last weeks what is untypical cause in gold they
usually do that
nearly the end of a rally. maybe we are near at the end of this rally
since 1142. in contrast to silver golds manipulation for
the most part occurs in the physical market while in silver the
manipuators are forced to use futuremarket consistently. so if you dont
know what to do in gold look at silver. i cannot see that strong
upwardmovement to new highs above 1308 coming. from cot report we
clearly have never had a buy signal for several month even to several years .
that only would be the case if manipulators in Gold (the centralbanks in
cooperation with some big banks and the government / in Silver some big
banks in most part JP Morgan Chaze ( the big banks) which own
the fed dont know what the fed is doing respectively they have to close
their big shorts in rising levels form now. very unlikely! Look at the
big 4 and big 8 dealers. they will use a distribution phase to get out
their shorts with a big profit like allways. with a not so differentiated view
gold looks not bad but i predict another blood bath for the bulls which
will take us propably to new lows.the next cot reports will descide it. Silver looks very bad now and is
closer to a sellsignal then otherwise. in the last two reports goldprice
clearly was retaded. Silver the same. remember in gold
they flood the markte physical in rising prices and build up shorts on
futuremarket at the end of a rally. in silver they are consistent on
futures.
it gives me a bit of a
headache that you Lara will discard the only alternate wavecount which
predicts new lows the further we go on cause it is likely possible
wee could see another 2 or 3 weeks of sideways/upwardphase before the
next drop is starting. this is just my view. im excieted to watch you
Lara at work now. are you right or when you will realize that something
is wrong with your counts. have not much confidence in your counts for
now cause my focus on the
manipulation allways took me in the right direction but for the next drop starting from now it is too early. it is just my view
and i cant trade against it. it is hard for me now cause Lara you
allways was in harmony with my COT analysis.for this levels the shortposition of the manipulators is very high in Gold and silver while silver is looking overall bad!! Gold only looks better overal but in gold the manipulation is more in the physical market, not in futuremarket.this fact and the weak upwardmovement of goldprice relativ to longposition build up by specs is a sign we are propably not done with this correction since 2011. I wish all the the best. and Lara kudos to you for your always cool head and your brilliant work.
positions structure is now still closer to the bottom. I see a lot upwards potential from this perspective.
Speculative Long Gold Positions Increase For Third Straight Week – CFTC
By Neils Christensen of Kitco News
Monday April 13, 2015 12:29 PM
http://www.kitco.com/news/2015-04-13/Speculative-Long-Gold-Positions-Increase-For-Third-Straight-Week-CFTC.html
My position is still that today is a low volume, gap-filling day with bullish structure. here is my updated GLD channel. Looking for strong up move on channel touch and STO reset.
I would like to see just a little more weakness on the miners, maybe 1 to 1.5% on GDX/GDXJ to close that gap and reset the hourly stochs. The charts I am looking at could see a few hours of sideways/down action yet. (GDXJ missed by a few pennies). If that happens, I will be adding to my long position.
Yes, there is that gap between GDX 19.18 and 18.95 that hasn’t been filled yet. Problem is that it cant get filled without GLD breaking my channel which I think matches Lara’s channel. I said last week that if GDX falls below 19.18 I will sell my long positions and that’s probably still my plan but I need to evaluate this evening. GDX dropped right to 19.19 today and bounced so I suspect I have a decent handle on support if this uptrend is going to survive.
Lara
Did subminuette wave iv or minuette (ii) end at 11:25 am EST at 1,196.42.
We’re not sure which wave we are in and if gold is about to get more bullish or bearish. It is good to know so we can adjust our position before the close, thank you.
Hi Richard: Gold price has probably already indicated Bearish Two Crows…. That would suggest an eventual erosion in the uptrend and possible trend reversal; not too sure yet, maybe tomorrows price action will point the way forward.
I have a 5-3-5 complete upwards followed by a deep 3 down.
So I have a 1-2, 1-2 up, followed by a deep second wave correction.
I think this deep second wave correction should be over now, finding support about the lower edge of that blue channel. That should continue to provide support if this wave count is correct.
The nested first and second waves indicate strong upwards movement to come very soon.
If price breaks below 1,193.11 the main wave count is in trouble. The alternate is still viable (although it has a low probability). If the alternate is correct this is right where it should move price strongly lower.
So the two daily wave counts now strongly diverge; main expects a third wave up, alternate expects a third wave down. Price will tell us this week which one is correct.
If that lower blue trend line is breached on the daily chart I’d be very concerned for that main wave count. I’d be using that trend line for support.
Lara that is good to hear as I did keep my GDX as I thought a bottom formed today. Thank you.
Lara , would appreciate if you could make an hourly count for both Main daily and Alternate daily . I know I have said I won’t trade off hourly anymore but I am very curious what is going on . Please include from the top around 1220 as well .
I don’t want to give that alternate wave count undue weight by including an hourly chart for it.
Yeah but in all honesty I hate the main hourly also and I want to see what alternatives are out there . I don’t what else to say . Should be able to see all angels if not for anything else but educational purposes .
I’m long but getting more bearish by the minute. Today’s action wasn’t expected and not friendly to the bull case IMHO. I might get stopped out right here and miss a big move up but, so be it. Doesn’t look right to me and as much as it’s possible a huge move up is coming, i see the possibility of a huge move down
Just bailed on longs. Felt like a sitting duck lol. It’s free to go up now for you all!
The most compelling thing I note on the charts right now is the 100 day MA. We broke through it to start the year but then it failed in February. It was challenged very recently but was not bested on Friday, and one could argue that was a simple backtest before the next leg down. I’d keep my eye on that
JUST A VIEW: With 1196 so far holding, Gold price neutral, trendless with upside bias (good for scalping?) but currently having an inside day…. Range expansion would likely point the way forward…. Erosion in the uptrend is seen with 1209-11 limiting subject to break above 1206-07. A high above the Friday H 1210.6 appears unlikely (resistance by 100dma at 1210-11, 20weekMA at 1209-10) and may indicate a pending reversal….?
It’s starting to look like today was all about backfilling gaps and consolidation. I suspect there will be no big moves today based on volume alone. Tomorrow though could be a much different story. I still like the bullish structure and maintain my long positioning and bias.
A very large Head and Shoulder formation has been flagged by an increasing number or TA’s. While their is an inverse H&S in the right shoulder the larger formation should be adhered to until it is invalidated. I remain short.
Here’s an update of my GDX chart from last week. The structure is still very bullish and the consolidation has been tight between the fibs. Momentum has reset on this 15-min chart and has started turning back up. Looking for a breakout of the coiled flag to mark the beginning of minuette 3 (note – I don’t really trade in EW terms but I’m trying to draw in the relevancy).
GDX daily volume at 3:15pm is only 10.8M shares.
min wave 3? nope no strength
Minuette 3 beginning?
I think minuette (iii) may have began at 11:25 at 1196.42
Confluence of many trendlines for gold – triangle looks to want to break-out soon (I’m bullish). XAU has a very similar look. Reminds me of mid January. Yen looks like it wants to move higher soon too. There has been a strong correlation between the Yen and Gold (look at weekly back to 2010). Anyone else notice VIX up over 6% with market higher? Good luck.
Hi Risk – I have bought into TVIX on Friday and it isn’t tracking the VIX – my first venture into this. Do you know why?
I would think if the VIX holds its gains then TVIX will play catch-up. There are carrying costs holding TVIX as they constantly try to roll near-term volatility into the next term, which may be trading at a premium. For example, the May implied VOL might be at a premium to the April implied VOL, so TVIX loses even when things stay flat (since they have to buy the next month at a premium). Tricky, but big gains if you time it right.
I would have expected more ‘lift’ from a wave 3….
patience grasshoppa ;)….I don’t think we are quite there yet.
Friday’s gap up in GLD has now been backfilled. Added to JNUG longs.
It did look like a bottoming at 11:25 at 1196.42.
However still is a brave move to add to JNUG.
If we hit one of Lara’s targets for today, you’ll do well.
1198.5 Will it be support or resistance via the wave count?
Mark, nice call on ERY.
Glad that’s working out for you too!
I didn’t trade it yet, but I have been watching.
I think 1198.50 will be the test it has bounced down there several times and found support.
Gold at 1199.75 at 9:35 am EST, What is the wave count?
Has the down wave that started at 9:06 ended?
Are we going much higher or lower from here?
At this moment my thinking is it’s possible we’re either in the C of a pretty big ABC correction, or a smaller degree very large wave 2 correction, or the daily alternate may well be correct. Very hard to say
okay that’s it. This correction needs to end now or i’m getting ready to put my bear hat on. it could be over now though
Miners are certainly leading the metals this morning. Action continues to look very bullish to me.
In another 14 min Gold will have another bullish Fry Pan candlesticks pattern.
Google it:
http://www.candlecharts.com/fying-pan-bottom.html
I’m new to this pattern. What happens after the price is fried? Does it move down to the bottom of the frying pan / wok, or below it (pouring the food out of the pan into the dish below)? From my price calculations, price could move down below the lowest level of the pan. See whether this is correct. Thanks.
Frying pan bottoms are the same as a rounded bottom, but with the addition of a gap on the breakout. They’re a bullish indicator, not usually a strong one though. If they work they should be at the price low.
Bullish Fry Pan is very bullish, once fried, price moves way up. I goggled and saw many images, is very positive.
Looks like it is moving to the bottom of the pan soon. So if the pattern is very positive, this one would not be that pattern.
Frying pan bottoms are a less strong reversal signal. So I wouldn’t say they’re “very” bullish, just a bullish indicator. I’m taking this from Nison’s book “Japanese Candlestick Charting Techniques” 2nd ed, page 81: “this chapter examines more reversal indicators that are usually, but not always, less powerful reversal signals”.
On Friday morning, gold prices shot up from 1195 to 1203 in about 15 minutes, effectively leaving a gap-like thin zone below. This morning’s trading in the 1197-1201 zone looks constructive to me, akin to a backfill before prices move higher following some churn.
Lara wrote: Friday’s session completes a bullish engulfing candlestick pattern. This is the strongest bullish reversal pattern.
do we not have a clear overlap of iv and i on the primary?
Yes. See my analysis below in which I changed Lara’s count.
Yes we have. That makes this wave count no longer valid
With 1197/96 holding; do the longs have what it takes for gold price to rise through 1206-07 to target a break above 1210-11?….
Not to me yet. There is a chance but as I mentioned below, 1197.71 could also be the first wave down in the alternate.
Hi. Thanks your views TKL. I am a newbie and read with great interest yours and other enlightened views…. I think a break below 1196 should set the cat amongst the pigeons for the longs…. with 20dma ticking at 1191/90, a break below 1193/92 is a tough ask as yet. On a weekly outlook basis, gold price remains bullish and bottomy and expecting and upside move / rally. It will remain to be seen if gold price can get to and rise above 1225 and sustain above there. I would imagine the first objective for gold price would be to start to sustain above 1216-17 for bullish upside continuation. Have a nice day and a profitable trade! Thank you.
Thanks Syed. I agree with your viewpoint. Zooming in, I feel that in the immediate couple of hours, price is finding difficulty to break above 1200 due to the low stochastics reading. It may even drop to retest 1192.71 if the downside pressure is high. I would still expect, like you mentioned, a bullish outlook and hence a rebound is in the cards.
I am also favouring the 1225 region as a rise above that would target 1244.
My take is that provided the movement does not proceed below 1192.71, the updated main count is correct, except for some changes.
Considering the main count, I have minuette 1 as 1192.71 – 1202.73 – 1193.06 – ongoing, same as Lara’s updated count except that subminuette 3 is not over yet.
Subminuette 3 so far goes 1193.06 – 1210.83 – currently 1197.71.
The uncertainty comes when the alternate does not take out 1192.71 on the first attempt but does so on the next.
So, the danger of going long now is still nagging at us. Let’s see how this plays out.
At what point do you think danger is over and gold confirms the wave count?
The only sure price point is a rise above 1308.10 but we can’t wait until that to trade. I would have confidence on a rise above 1224.35. It does not invalidate the alternate yet, but for the alternate it means that its minor 2 is wrong and needs to be reworked.
If you are gung-ho, you may long on Lara’s original 1211.10.
Now it looks like the structure 1192.71 – 1202.73 – 1193.06 – ongoing is not minuette 1 of Minute 3 because after 1193.06 price rises to 1210.83 and then drops to as low as 1196.42 (which overlaps the first wave in the structure). It appears to fit best as minuette 1 and minuette 2 respectively.
The next structure 1193.06 – 1210.83 – (currently 1196.42) – ongoing would then be minuette 3. Subminuette 2 could have ended at 1196.42 (there are 3 waves) but the ongoing price movement still appears rather bearish, hence my uncertainty. I would need to await further developments before making a call.
Anybody has a better idea?
Does the recent down move today ( from high of 1209 ) look like a leading diagonal to you ?
I think this is subminuette 2, and I don’t think second waves form leading diagonals. The possibilities are that this wave 2 is complete at the low of 1196.42, or it forms a triangle, or it is a combination. I just can’t figure this out at the moment.
Well 2nd waves can’t be triangles . But I am asking if the move from the high looks like a wave 1 expanding diagonal . If we make a new low soon it won’t be that I guess .
Again missed to post that chart, but here it is now…
Hi Lara – The previous 5 wave unfolding did not happen in that fashion and now looks like an a,b & c
Moreover the current wave formation has taken only 32% of time of the previous hourly wave movement downward that touched 1178.39
Looks like still the 1172 levels cannot be overlooked, do you have any thoughts around that
Yes. Either the alternate daily wave count is correct and that three wave move up is a correction against a dominant downwards trend….
or…
if the main wave count is correct we now have 1-2, 1-2 up and should see strong upwards movement in the next 24 hours to new highs.
Volume continues to favour the bull wave count.
This is right where they diverge strongly. We will know this week I hope which wave count is correct at the daily chart level.
May be the subminuette wave iv is not over. At blue TL it is completing now 1197. ???
SM wave v and minute wave i to begin now.
Invalidation for this hour wave count is 1192.71
The (daily hourly wave count) invalidation point is slightly lower: minuette wave (ii) may not move beyond the start of minuette wave (i) below 1,192.71.
I guess with the recent move overlapping supposed wave i the updated wave count is not valid…
The new revised hr main wave count is now invalid correct
Wave 4 has overlapped. Wave 1
Gold is at 1,200.03 at 4:35 am, which is close to the support Lara mentioned.
“Minuette wave (ii) may find support at the lower edge of the dark blue channel copied over from the daily chart.”
I sure hope gold bounces up from here and hits Lara’s target today at 1,214 or even better at 1,222.
$HUI Gold Bugs Miners Index
https://www.dropbox.com/s/9psmdw2aidsujua/HUIweekly.png?dl=0
http://static.cdn-seekingalpha.com/uploads/2015/4/11/33517445-14287804323314764-Ben-Lockhart.png
Chart comes from full EW Gold forecast April 11th that sounds similar to Lara’s.
http://seekingalpha.com/article/3063576-its-time-to-buy-gold
Richard, that wave count has it’s wave (B) labelled as a five wave impulse. B waves can’t be five wave impulses. That’s not a valid EW count.
I love it. Lara I am glad u find error in these guys EW knowledge. I do not read this person analysis.
Either wave Y in iv is over or it is c. Seems like quite a good moment to enter long.
Updating this COT chart that i have posted every few weeks. It measures the 10 week total divergence between SWAP net and MM Net positions. I like to reference this to see where positions might be getting to extremes. The reason I look at 10 weeks is because after looking at a number of other weeks, 10 seemed to be a good git.
This is futures only, no options.
This is an old chart…look at the dates.
It’s updated, it just doesn’t display all of the periods in the axis.
What is the time frame for the top you are looking for according to this chart ?
I don’t really use this to predict the extremes, but based on the underlying data and current COT trends, I would say 3 to 5 weeks, maybe a few more. Just a guess though. Also note that I am not suggesting a gold price to go along with that. I zoomed in a little on this version.
Lara A request for hour chart/s. Now that gold price is high enough and near the upper TL of important maroon channel can you include the upper TL of this channel on hour chart?
I have to flip back and forth to day chart to see maroon channel line.
thanks.
It’s not close enough to show up on my hourly chart. You can’t even see the upper edge of the more narrow and close blue channel.
I have published an updated hourly wave count. It’s not a big change, but it’s important to get it right at the start. Chart and text at the end of analysis above.
Thanks Lara.
Is it possible the sm ii will be shallow?
Gold going back down from 1222 to just below or at 1200 (blue TL) will once again breach the HnS neckline at 1219. This will confused the chartist like me. A back test of NL at 1219 from 1222 is well acceptable.
Longs are happy and are correctly positioned. Shorts are trapped.
Of course, it’s possible. When another wave up completes minuette wave (i) then use the 0.382 and 0.618 Fibonacci retracements of it’s length as targets for minuette wave (ii). If one of those corresponds with the lower blue trend line that may be more likely.
This will be a small second wave correction within a third wave one and two degrees higher. It may very well be shallow due to a strong upwards pull.
At least, that’s what past behaviour tells us is most likely next time.
The only other question I would have Lara is IF alternate daily is correct ( i don’t think so but IF ) , what exactly would be transpiring in the hourly right now ?
Another second wave correction would have just finished as a zigzag. It would subdivide 5-3-5, exactly the same as the subminuette waves i, ii and iii on the hourly chart above.
So the alternate now has two first and second wave corrections complete within intermediate wave (3). It should be seeing extremely strong downwards movement now or very soon indeed.
Lara, thanks for the info on this alternate(daily). Its looking like its real right now. 🙂
Can you put up for us an hourly using the Alt. Daily count? It would be so helpful during trading hours.
on second thought, although an alternate daily hourly is good preparation, — i didn’t read far enough to see the price point for invalidation on main updated hourly — being 1192.71. Still, glad your on this move.
I have just attached the chart…initially I have missed attaching it
Oops…missed to attach the wave count to you
Some comments :
1. Correct me if I am wrong but your wave labelled ‘3’ of ‘a’ at the beginning looks shorter than ‘1’ or ‘5’ . This is a violation of the rules . Look at Lara’s main wave count on April 8 for correct count . Your ‘a’ I believe is clearly a 3 wave structure .
2. After your ‘c’ is over ( looks like like you don’t have c labelled ) your ‘1’ is labelled a corrective ‘4’ by Lara . I doubt Lara would make the mistake of labeling an impulse as a corrective wave .
3. I prefer the way Lara labelled her main hourly on April 8 . As a double zig-zag . It is nice and clean . Don’t know why that was changed . Now we have subminuette waves that are larger than minuette waves . Makes me doubt this latest up move is an impulse .
Okay, I see the chart now.
I agree with your first point Alex, that third wave in the diagonal for the A wave is by quite a big margin the shortest. That violates a core EW rule.
That upwards movement labelled a first wave can be seen as a zigzag or an impulse on the five minute chart. It’s ambiguous.
OK cool , thanks for clarification .
I don’t see a chart?
Hi Lara – Last time I had presented the count to you that the 5 wave movement is over and the wave ii was in progress. You had still shown the wave count as an irregular wave
Now the a, b,c correction followed by i, ii, iii, iv needs a little bit of re-look. On your charts the wave no. v of downward correction is not lower than wave iv which looks like a a wave v truncation
Have attached the wave count to you to take inputs as well
Yes, the fifth wave is slightly truncated by 0.40.
I’m considering another way to label minute wave ii with it ending at the price low.
I’m going to post a few charts that I believe show confluence with my bullish analysis and that of Lara’s which is what I like to find to give me the best confidence in my trades. We appear to have begun or are about to begin a very significant move up that could break some very long downtrend lines and will likely encourage some to believe that the bear market in gold/silver is over. I personally don’t believe the final bottom is in which could actually be years away but that doesn’t really matter….I trade what is right in front of me and for now that is a hugely bullish setup that I’ve fortunately been well positioned for the past 2 trading days as I built my longs.
GDX Daily. This chart speaks for itself….no words needed.
GG is often my “canary in the coal mine” as it is the largest component of the GDX at 10%+. It appears to have broken resistance is poised to launch Monday.
NUGT – I haven’t had to change my notes from 4/8.
JNUG – on the verge of breaking 9-month downtrend. Just watch the euphoria pour out from the goldbugs when that happens.
HL – possibly one day away from breakout too.
and finally a look at confirmation on the inverse….JDST tips it hand by breaking down last week on big volume. All my charts, in conjunction with Lara’s analysis add up to a high probability bullish setup from my view.
Great charts, Mark. They paint a good picture that shows convergence of trends. They are very helpful. Really appreciate the good work.
Thanks for the charts. Please keep them coming!
I have to add this one to my watch list. Nice chart.
Love the total simplicity of that chart!
When I was bullish Gold around 1140 ( no I did not declare it on this forum ) , you were the most vocally bearish person here , every day calling for a top since then and up to a few days ago . And now you are the most vocally bullish . Just wondering what significance that might have 🙂 Maybe none but who knows .
Are you sure you’re not confusing me with someone else? Gold was at 1141 on March 17. I only recently joined this forum. I went back and looked and my first post was on March 23rd when gold was at 1191. I was bearish then and gold rose two more days and then fell to 1178. I covered my DUST short position at 19.31 and I think I stated exactly that on here and have pretty well captured the meat of most of the swings since then. I’m neither bull nor bear and cant imagine anyone staying in the same long position while from 1141 to 1220 and then back to 1178 unless you have some long term investing philosophy. I’m a swing trader. Feel free to discount my analysis as you see fit….I have no agenda and I suspect I’m not a good sentiment indicator for those who consider themselves contrarian traders. Are you bearish on gold now?
Just went back and found my post from 11 days ago. If people feel that it would be better that I not post or that I’m leading folks astray, I’ll gladly stop posting here. https://disqus.com/home/discussion/elliottwavegold/gold_elliott_wave_technical_analysis_8211_30th_march_2015/#comment-1938561348
Ah never mind man , everything is cool .
You have the right to play your way and post your analysis . The charts are interesting for sure .
Mark F, keep posting comments plus charts. I appreciate all thoughtful opinions and definitely factor them into my trade decisions. But feel no pressure, I give thanks to all when my trade wins and I take responsibility if my trade breaks.
I’ll take your posts over alex any day!
hey , I’ll be honest and say I am not here to provide any info on how I trade and when I trade .
I appreciate your contribution Mark. I am currently profitable with my I.B.M trades (Influenced By Mark).
Ah , well , I have been following your comments on another forum before the ones you made here going back a month or more . You’ve been playing DUST up to about 4 days ago which for me was against the trend . But I don’t want to go back and forth about that though .
And yes I got in late at 1165 missed the exact bottom but was looking for it at 1140 . Should have got out at 1220 . Got out at 1195 . Overall not happy with that result but what can you do at least I didn’t lose . Have to wait for my next opportunity . Not convinced Monday is the day Gold is skyrocketing higher but could be . I am still bullish but don’t want to buy here unless I see something more convincing .
A double HnS for GLD. Below is a line chart of GLD shows double HnS side by side. Can any one go wrong with this another BO of neckline. Never seen this double pattern before.
Gold has to be in a trend change mode??????
While it’s possible the 2nd inverted H&S will play out to the upside, if we go down from here, there is an even bigger H&S in play with a neckline down near 1131. The situation is still not clear.
Gdx, Gdxj, and Gld all made the Selling on Strength list on wsj.com. That fits with analysis above that a pullback is coming.
TKL
Lara stated that after wave v is complete at 1215 there will be a correction.
What will be the target of this correction ?
Possible to the bottom trend line???
This being a larger degree wave, I would expect the retrace to be at 0.618 retrace. It ought to reach around 1202, near the bottom trendline. I also think that the third wave will be quite large, possibly at 2.618 Fib. I am eyeing this setup for my longs next.
Thanks TKL.
I do not know whether u follow candlesticks chart pattern or not but I used candlestick very often. Like yesterday’s fry pan pattern was bullish and gold went up.
I am soon going to post a new gold daily candlesticks bullish chart pattern. look out for that.
Gold is really bullish now.
Hi papudi.
I look at candlestick patterns a lot during my trading sessions. They give a very clear picture of the very near term movements, especially in indicating trend changes.
Thanks for any additional input.
Wow!! gold finely showed it is in line with Lara’s wave count on chart. a combination of powerful bullish candle pattern is in line with Lara’s bullish forecast today.
The candle pattern is three small body red candles sandwitched between two green candles twice. This is very bullish and once gold crosses the NL at 1215 it is going higher.
Gold above $1308 is NIRAVNA territory. AND above 1345 it is definitely achieved MOKSH.
Lara thanks for your terrific analysis. I get a sense of relief when there is only only hourly wave count as it will be easier for me to daytrade.
Every day I really enjoy reading and watching and studying your writings, charts and video. Based on 2 years of reading many Elliott Wave analysis from many Elliotticians I find that you provide a much higher degree of detail that gives me much more clarity for me to trade with,
Many others provide very vague details that are of little help to daytrade with. Of course with their vague guidelines they often claim they are always right, which I see through but don’t mention it as it is my decision if I want to trade with it. Lara you provide so much detail that if one chooses to they may find a mistake here and there or a probability didn’t happen. Elliott Wave is not a perfect method of forecasting as it is based on probabilities, which can change daily, or sooner.
I’ll chose yours everyday as I work with the great detail that you provide and stay cautious, nimble and fill in the blanks with what the market provides in several ways. I also graciously accept whatever you provide on your terms and your timetable because I have the deepest respect for your efforts, results, and honestly. I don’t know of any other financial advisor of Elliott Wave I can say that about. In the spring of 2013 I was looking for months for a way to make money with gold etfs. Then one day I saw one of your forecasts, which came true shortly after and I was captivated how you did that so I followed you and your Elliott Wave which was totally new to me, every day since June 2013. I really wouldn’t trade gold without your analysis. Thank you Lara.
Well said Richard. Ever since i joined this fabulous service i have come to get away from many analysts who claim to be the best. Found the real analysis with with clarity and various option of the gold ma term forecast has kept me away from a fixed mind set. I have notice great chartists become confused on multi direction of gold and now flat because does not have idea what is unfolding long or short.
Accuracy of forecasts always improve when options are restricted. It is when too many possibilities exist that one can choose wrongly.
Richard, You verbalised my sentiments perfectly.
Ever since I used Lara’s analysis as a basis for my trades, my accuracy improved. Before that, I only dared to trade the larger degree waves as one can hardly go wrong with them. That involved a buy-and-hold methodology, tempered by swing trades, which works well only for a trending market. Once intraday choppiness sets in, buy-and-hold is virtually useless, especially when the trade is leveraged.
Lara’s philosophy and work ethic fit my personality well. I am cynical of self-professed experts who provide sketchy analysis. They talk the loudest when the market is moving in their favour, but when the going gets tough, I hardly hear from them. Worse yet are the poor traders who listen to every bit of news and try to extrapolate meaning from them. It doesn’t work. The same information can be interpreted to mean anything; it just depends on who do the analysis and his/her reputation. Furthermore, these people tend to ignore the reality that a lot of talking heads on the news channels have some vested interests. Many of them are “paid” by someone else to spew their ideas. Worse yet, how many of them do actually trade? It is just their charisma that hoodwink those poor souls. Lara’s analysis down to the lower degree waves shows the meticulous preparation needed. Scientists are like that. We engineers normally evaluate quite thoroughly but are mostly satisfied with a ballpark figure. Such is the nature of our job. However, we must always note that our analysis is only as accurate as the amount of precise information available at the particular moment in time. (It is for this reason that I rejected fundamental analysis in the formative years of my trading life; much needed information is never available, and as an engineer by training, this is only slightly better than a coin toss). And we can’t blame anyone should a well-prepared work plan goes awry due to some additional or contradicting information that surface later. This we have to accept as traders.
Keep up the good work, Lara. I will always remain your staunch supporter.
These are excellent comments. One thing that I believe gets lost in the discussion is the difference between good analysis and good trading….they are unfortunately mutually exclusive. Many emotionally believe that as long as they have the best information, they will be armed for success. Yes, good data gives you a leg up but it must be applied correctly. Becoming a good trader is more psychological than anything else. It requires strict discipline and trading within yourself according to a plan and abiding by probability/risk parameters that you’ve defined and actually follow. Too many people are actually trading “randomly” and don’t even realize it.
I agree. My hardest lessons have been ‘being ok’ with not getting the top or bottom exactly right. Low risk, high probability has kept me from trying to play the 2 and 4 waves much, and to practice patience when we are within days of a major move.
Yesterday is a good example, maybe we had another 18 down to go in gold but 120 to 240 up….that’s that’s time to be positioned long in my book.
I think its TKL that likes to trade the 3rd waves and I’ve taken note of his example. Maybe there are fewer trades but it’s easier to sleep at night.
I agree with Mark and yourself on the practice of trading.
One of the most important things to note is to stick to a well-laid out plan until it is proven wrong. You will need to remember all your assumptions and parameters that you use when laying out the plan, and so if conditions show a marked deviation from them, be nimble enough to change. A good plan with well thought out escape options reduces the emotions that would upset any trader. We never trade on a whim and fancy. That is gambling, and sooner or later the odds will stack up against you. Well, that is the mainstay of the herd anyway.
I do trade all the waves but my positions are greatest in the third waves, specially the third of a third. They provide the greatest gains for the least amount of worry and anguish. They also need very little adjustment; you just need to ride the trend. First waves usually have the least volumes and unless you trade something with inherently good liquidity, it is difficult to buy/sell. Fifth waves are the darling of euphoric traders, and they are always a source of worries as the wave may truncate, especially if the third wave had been too strong too fast. You have to be extremely nimble with second and fourth waves. There are just too many variations, and these can change from day to day. This is exacerbated by the fact that the US market is closed for more than half the time of day, and you can do nothing once you are in a trade left overnight. It is not too bad now but I don’t know what will happen once the Shanghai Gold Exchange becomes fully operational. With a huge population and hence trader base, they can move prices tremendously before we can even lay a finger on the trade. And my experience shows that the knee jerk reaction is felt the most during the opening hour or so. Prices become unrealistic. Large selling or buying will push prices away from the actual levels, and losses/gains can be large.
So guys, trade safe, and may prosperity be with us all.
Hi Mark. A plan is only as good as its execution. To a disciplined practitioner, they cannot be mutually exclusive. They always go hand in hand. I learnt this during my younger days playing competitive contract bridge in the Singapore premier league every weekend for more than a decade.
The competition is based on two 18-boards (similar to golf) in the space of four hours. Each game lasts slightly more than 6 minutes. We have to formulate a plan of action based on available information (through the bidding process) and then execute that plan. I have come to learn that when the going initially appears smooth sailing, that is the time to worry. We have to consider pitfalls and consider how to prevent if not circumvent them. These are probability plays. Ironically, it is when there are no suitable alternatives that makes for easier play. We just need to stick to the one play available. If the gods favour you, that is it, but if otherwise, you have to learn to deal with your losses the best way you can. You can’t blame anybody else.
I have transposed these practical skills to my trading. The scenarios are exactly the same. You deal with incomplete information, you formulate a plan of action based on it, and you execute it, always sticking to the plan unless external circumstances prove to the contrary. And all these are done under extreme time pressure.
I think we are actually saying the same thing and I agree with you!
TKL,
I’m currently in HK, passing through SG Tuesday for 2 days.Staying in Trumps at Kembangan.
Do want to meet for Lara Appreciation Society for coffee/beer?
Would fully understand if you don’t want to meet person off ‘ínternet’. However if you if you fancy it and are nearby, then email jwcs2@optusnet.com.au
Hi johno. I have replied to your email as this is more of a personal nature, and not suitable in taking up space in a public forum.
You’re very welcome Richard.