
Downwards movement for Wednesday was expected, but this is not what happened. While upwards movement remains below the invalidation point it makes the situation unclear. I will present four Elliott wave counts, 2 bull and 2 bear.
Members should use their own preferred technical analysis tools to judge for themselves which wave count they can use as a road map for the immediate future. One by one price will invalidate wave counts until we have one left.
Summary: Gold is in a sideways consolidation phase which began on March 27th. The strongest volume day within this consolidation is for a down day indicating the breakout when it comes may be down. However, the Elliott wave picture is unclear. While price remains below 1,210.88 and above 1,178.59 multiple wave counts will remain valid.
Click on charts to enlarge.
Weekly Bull Wave Count
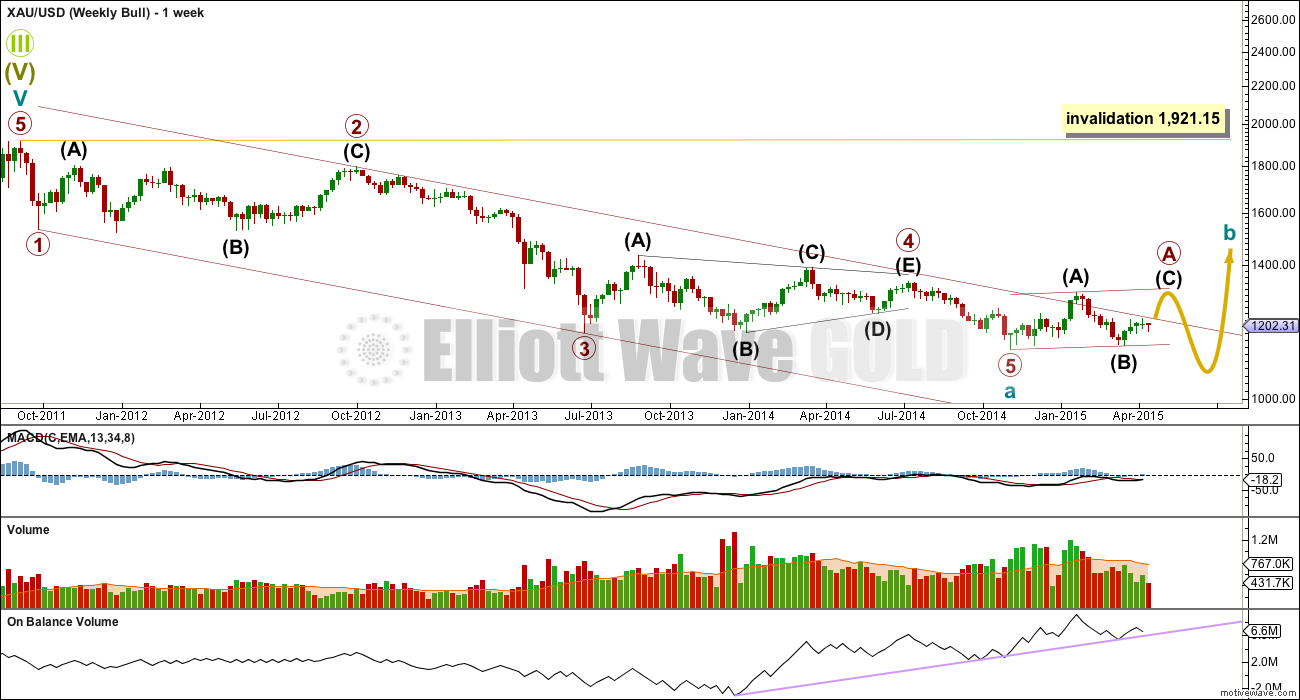
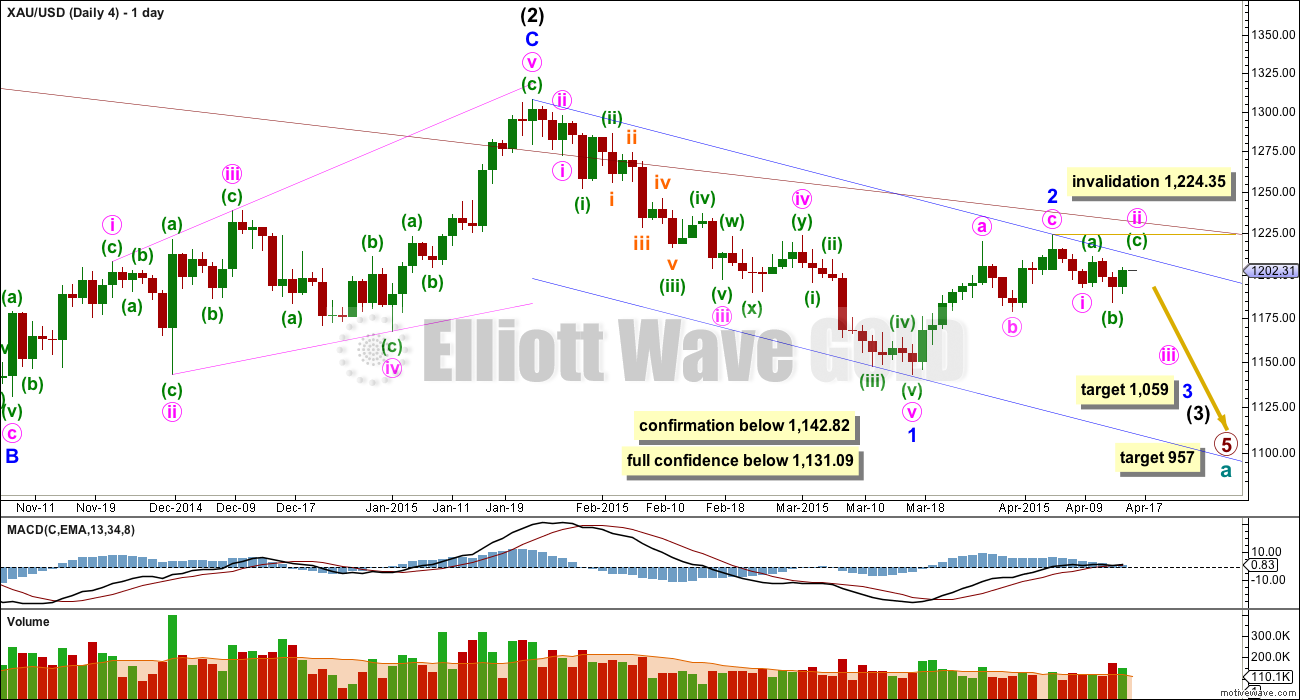
Cycle wave a may be a complete five wave impulse. Within it primary wave 2 is a deep 0.68 running flat (the subdivisions fit and intermediate wave (C) is only slightly truncated) lasting 53 weeks, and primary wave 4 is a shallow 0.27 regular contracting triangle lasting 54 weeks. There is perfect alternation and almost perfect proportion between primary waves 2 and 4.
Primary wave 3 is 12.54 short of 1.618 the length of primary wave 1. There is no adequate Fibonacci ratio between primary wave 4 and either of 1 or 3.
Because cycle wave a subdivides as a five wave structure cycle wave b may not move beyond its start above 1,921.15.
Cycle wave b may be any one of more than 13 possible corrective structures. It should last one to several years, move price either sideways or higher, and clearly break out of the channel about cycle wave a, which would provide full confidence in a cycle degree trend change.
Draw the channel from the lows labelled primary waves 1 to 3, then place a parallel copy on the high labelled primary wave 2. There is a small breach of the channel within cycle wave b, which is the first indication that cycle wave a may be over.
Primary wave 5 does not subdivide perfectly as an impulse on the daily chart and for this reason I retain the weekly bear wave count.
Wave Count #1
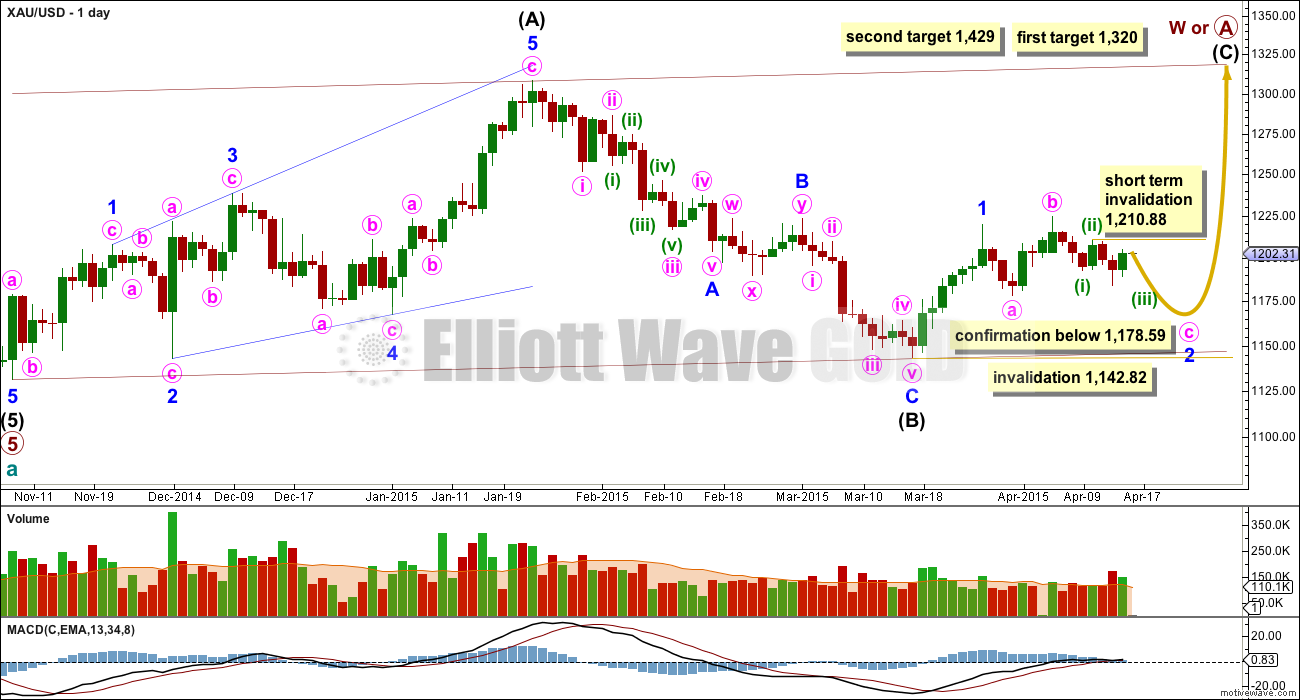
So far within cycle wave b there is a 5-3 and an incomplete 5 up. This may be intermediate waves (A)-(B)-(C) for a zigzag for primary wave A, or may also be intermediate waves (1)-(2)-(3) for an impulse for primary wave A. Within cycle wave b primary wave A may be either a three or a five wave structure.
Intermediate wave (A) subdivides only as a five. I cannot see a solution where this movement subdivides as a three and meets all Elliott wave rules. This means that intermediate wave (B) may not move beyond the start of intermediate wave (A) below 1,131.09. Intermediate wave (B) is a complete zigzag. Because intermediate wave (A) was a leading diagonal it is likely that intermediate wave (C) will subdivide as an impulse to exhibit structural alternation. If this intermediate wave up is intermediate wave (3) it may only subdivide as an impulse.
At 1,320 intermediate wave (C) would reach equality in length with intermediate wave (A), and would probably end at the upper edge of the maroon channel. At 1,429 intermediate wave (C) or (3) would reach 1.618 the length of intermediate wave (A) or (1). If this target is met it would most likely be by a third wave and primary wave A would most likely be subdividing as a five wave impulse.
Within intermediate wave (C) minor wave 2 is seen for this first wave count as an expanded flat correction. These are very common structures. It may not move beyond the start of minor wave 1 below 1,142.82.
Within minor wave 2 expanded flat minute wave c must subdivide as a five wave structure.
Pros:
1. Expanded flat corrections are very common structures.
2. Minute wave b up looks like a three on the daily chart.
Cons:
1. Within minute wave c subminuette wave ii is showing up on the daily chart, which is unusual for Gold.
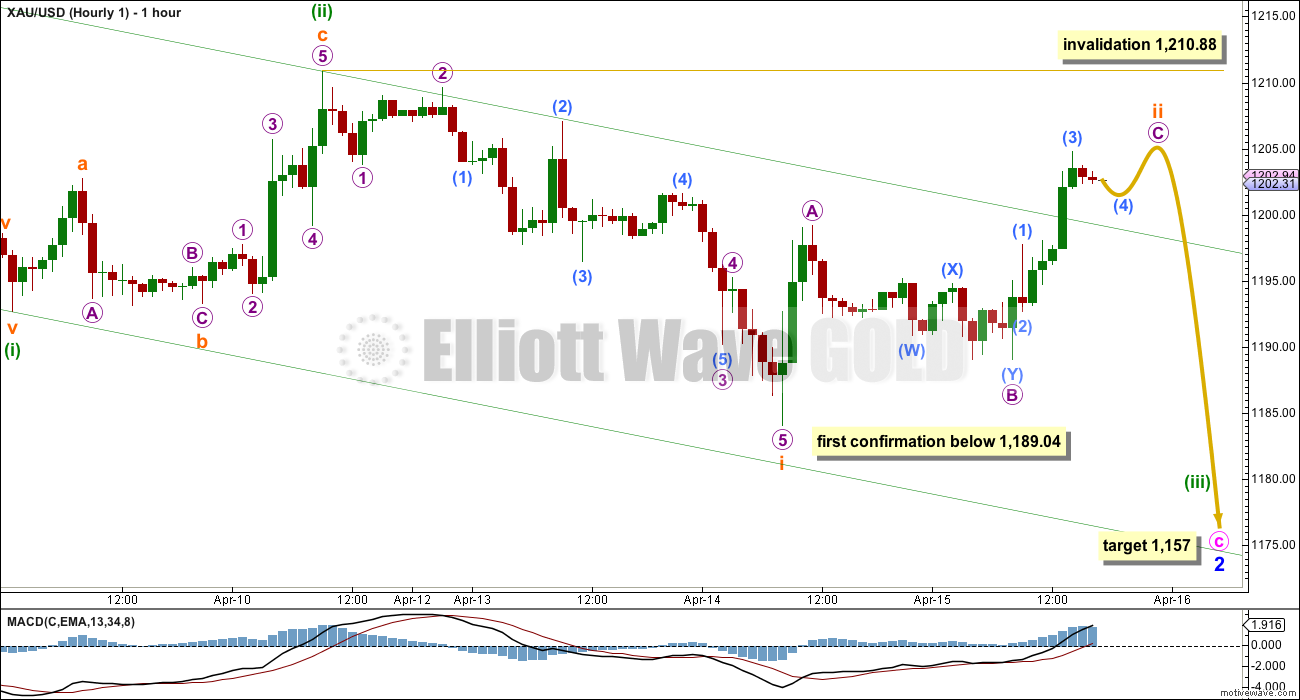
So far within minute wave c down there may now be two first and second waves complete. This indicates an increase in downwards momentum.
Subminuette wave ii is close to completion as a zigzag. Micro wave C is an incomplete impulse and needs the final fifth wave up. Subminuette wave ii may not move beyond the start of subminuette wave i above 1,210.88.
The green channel is a base channel drawn about minuette waves (i) and (ii). Subminuette wave ii has breached this base channel. Sometimes this happens, but more commonly a lower degree second wave should find support or resistance at a base channel drawn about a higher degree wave. This breach of the base channel indicates this wave count may be wrong.
At 1,157 minute wave c would reach 1.618 the length of minute wave a.
A new low below 1,189.04 would invalidate wave count #2.
Wave Count #2
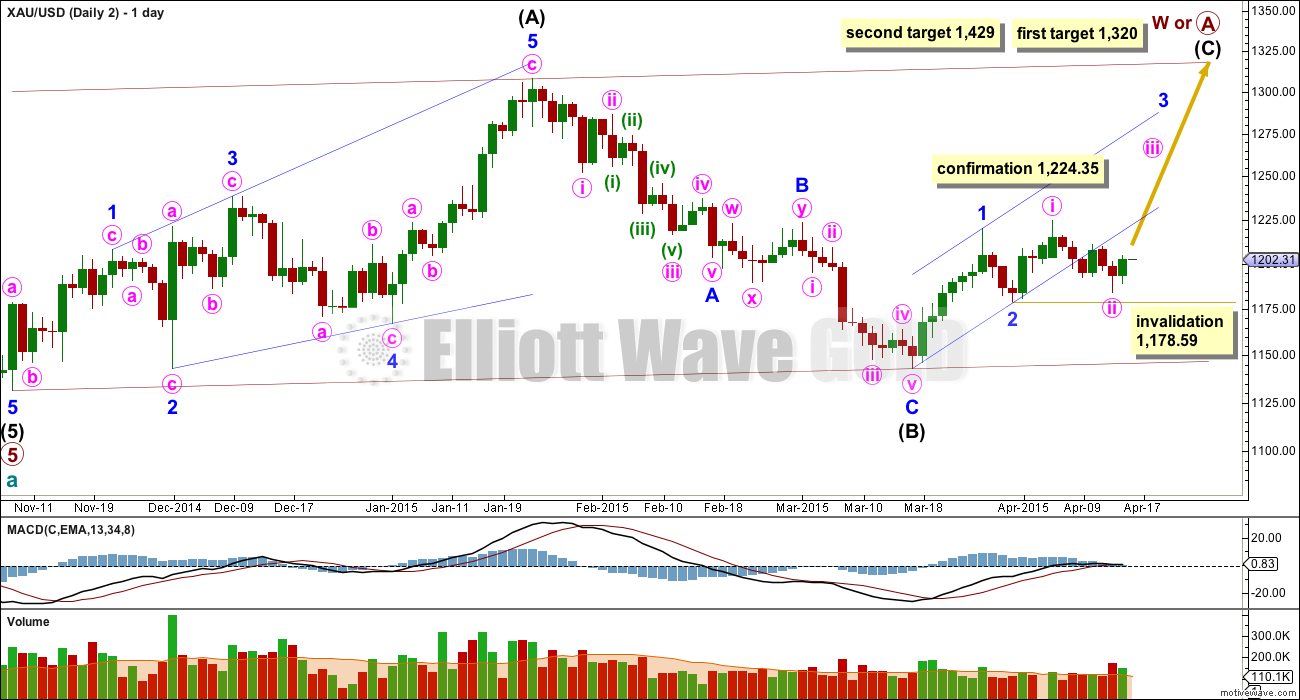
This wave count is identical to wave count #1 up to the high labelled minor wave 1. Thereafter, instead of minor wave 2 continuing it sees minor wave 2 as complete, and now within minor wave 3 minute waves i and ii complete.
Pros:
1. Minute wave ii looks like a clear three wave movement now on the daily chart.
2. Minor wave 3 should show its corrections for minute waves ii and iv clearly on the daily chart.
Cons:
1. Minute wave ii clearly and strongly breaches the lower edge of a base channel drawn about minor waves 1 and 2, one degree higher.
2. Minute wave ii is twice the duration of minor wave 2 one degree higher.
A new high above 1,210.88 would invalidate wave counts 1 and 3. A new high above 1,224.35 would invalidate wave count 4.
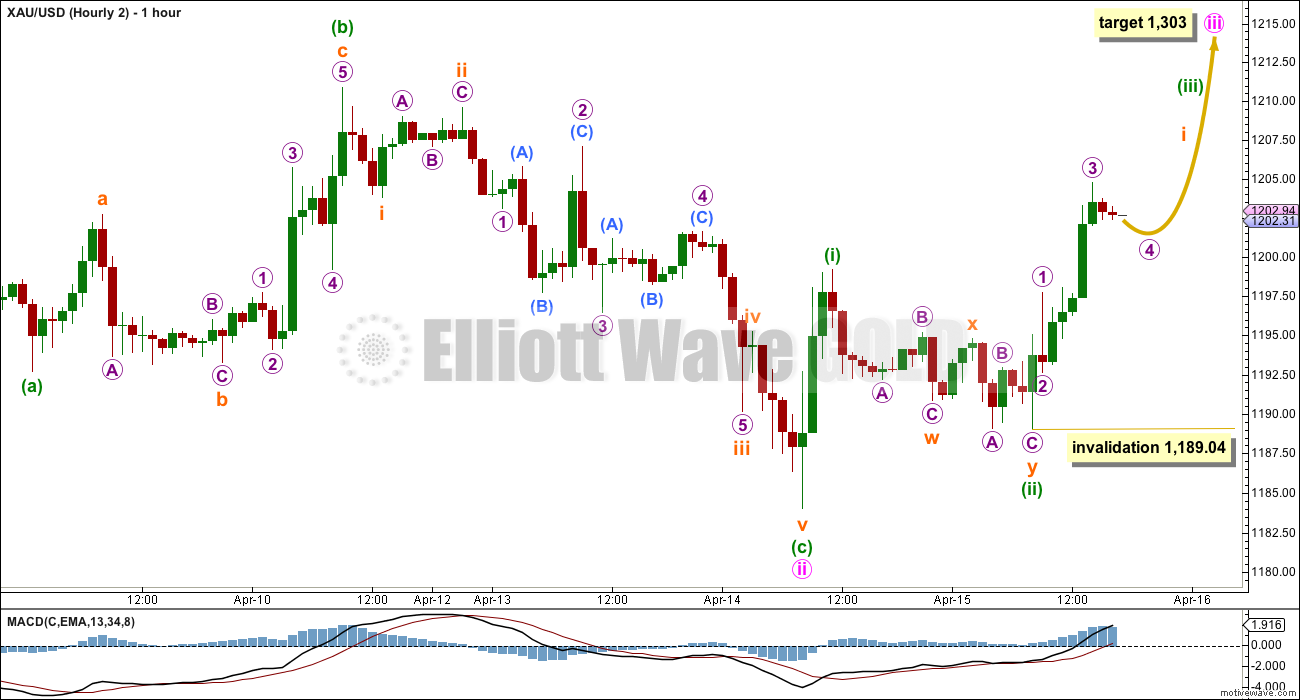
If minute wave ii is over then minute wave iii up should show a strong increase in momentum. At 1,303 minute wave iii would reach 1.618 the length of minute wave i.
Within minute wave iii the middle would not yet have arrived. When subminuette wave i is a completed five wave impulse then subminuette wave ii should move price lower, but not below the start of subminuette wave i below 1,189.04.
Weekly Bear Wave Count
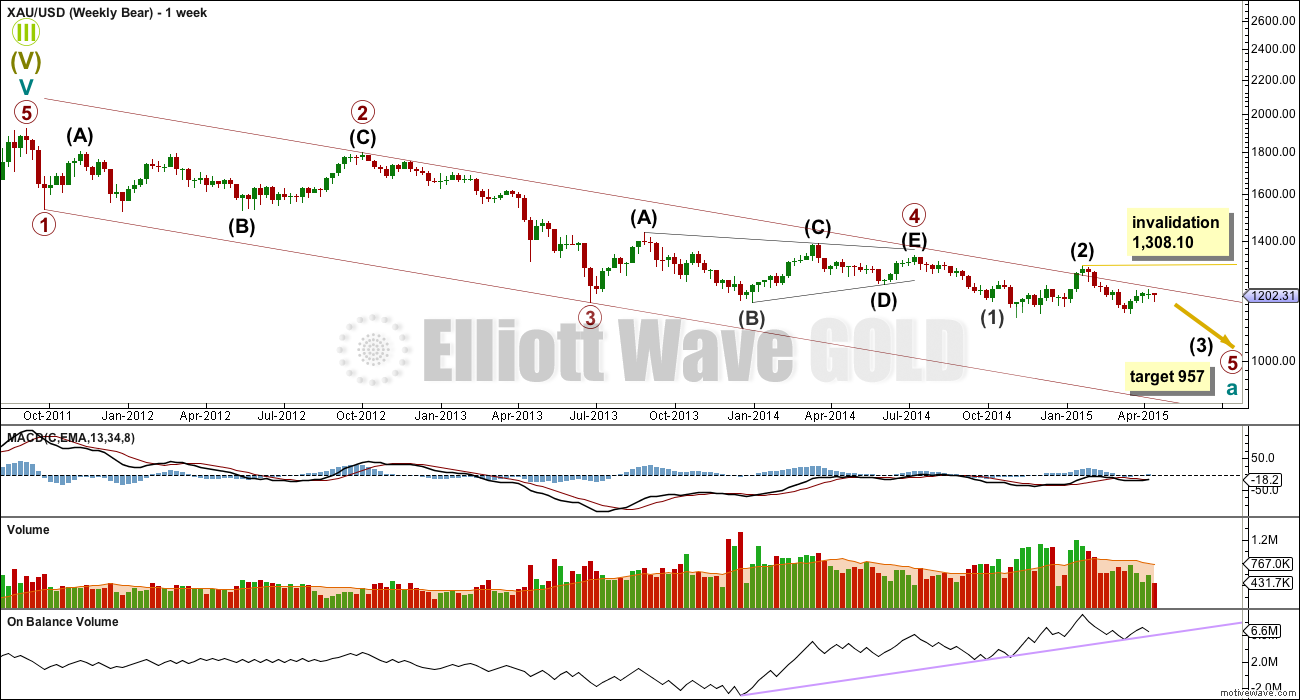
This weekly chart is identical to the first bullish weekly chart up to the end of primary wave 4. Thereafter, it looks at the possibility that primary wave 5 is incomplete. At 957 primary wave 5 would reach equality in length with primary wave 1. That would give this impulse for cycle wave a perfect Elliott wave ratios.
So far within primary wave 5 only intermediate waves (1) and (2) would be complete. Intermediate wave (2) has a small breach of the upper edge of the channel containing cycle wave a. If cycle wave a is incomplete this channel should not be breached. This is the first warning this wave count may be wrong.
Within primary wave 5 intermediate wave (1) subdivides perfectly as an impulse. Intermediate wave (2) subdivides perfectly as a very common expanded flat. Intermediate wave (2) looks too large though, further reducing the probability of this wave count.
If the maroon channel is breached again this wave count should be discarded, before price moves above 1,308.10.
Wave Count #3
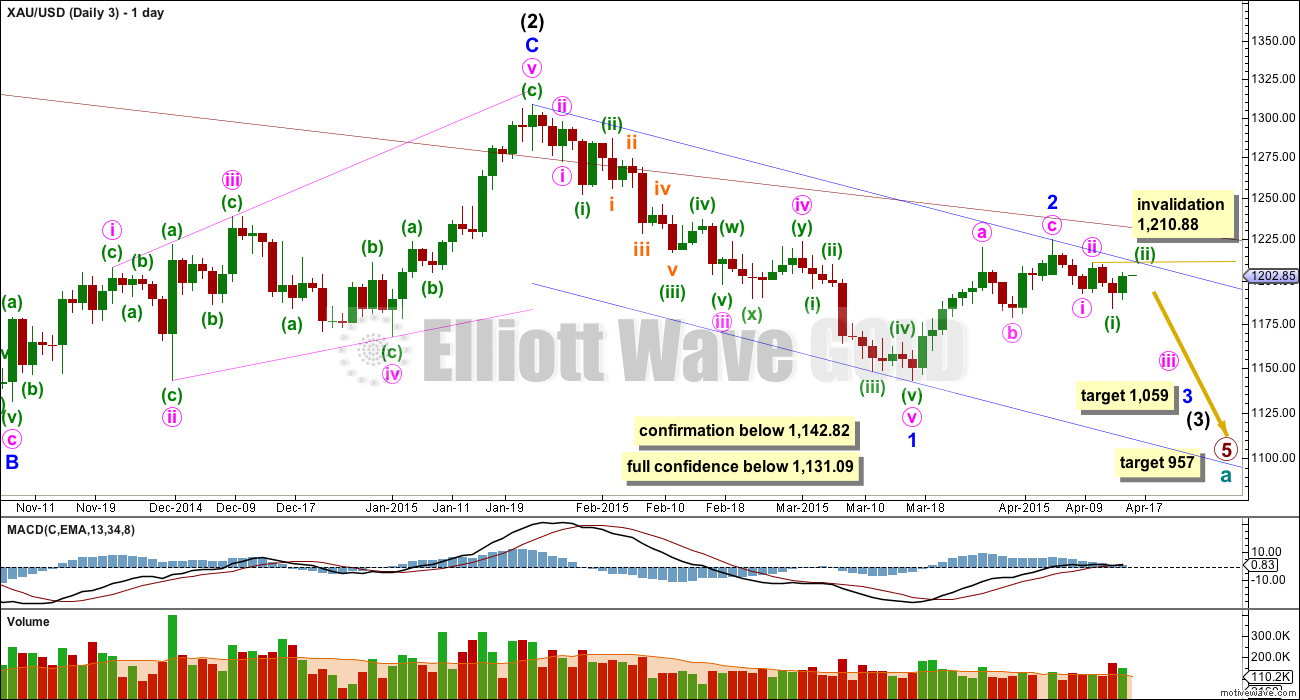
So far within intermediate wave (3) minor waves 1 and now 2 should be over.
At 1,059 minor wave 3 would reach equality in length with minor wave 1. Minor wave 1 is extended, and this target would see minor wave 3 also extended. A short fifth wave would be expected to follow.
Within minor wave 3 minute waves i and ii may be complete. Within minute wave iii minuette wave (ii) may not move beyond the start of minuette wave (i) above 1,210.88.
This wave count expects a strong increase in downwards momentum.
Pros:
1. It is extremely common for third waves to begin with a series of overlapping first and second wave corrections.
Cons:
1. Within minor wave 1 there is gross disproportion between minute waves iv and ii: minute wave iv is more than thirteen times the duration of minute wave ii giving minor wave 1 a three wave look.
2. On the hourly chart minuette wave (ii) breaches the upper edge of a base channel drawn about minute waves i and ii, one degree higher.
A new low below 1,178.59 would invalidate wave count 2. A new low below 1,142.82 would invalidate wave count 1.
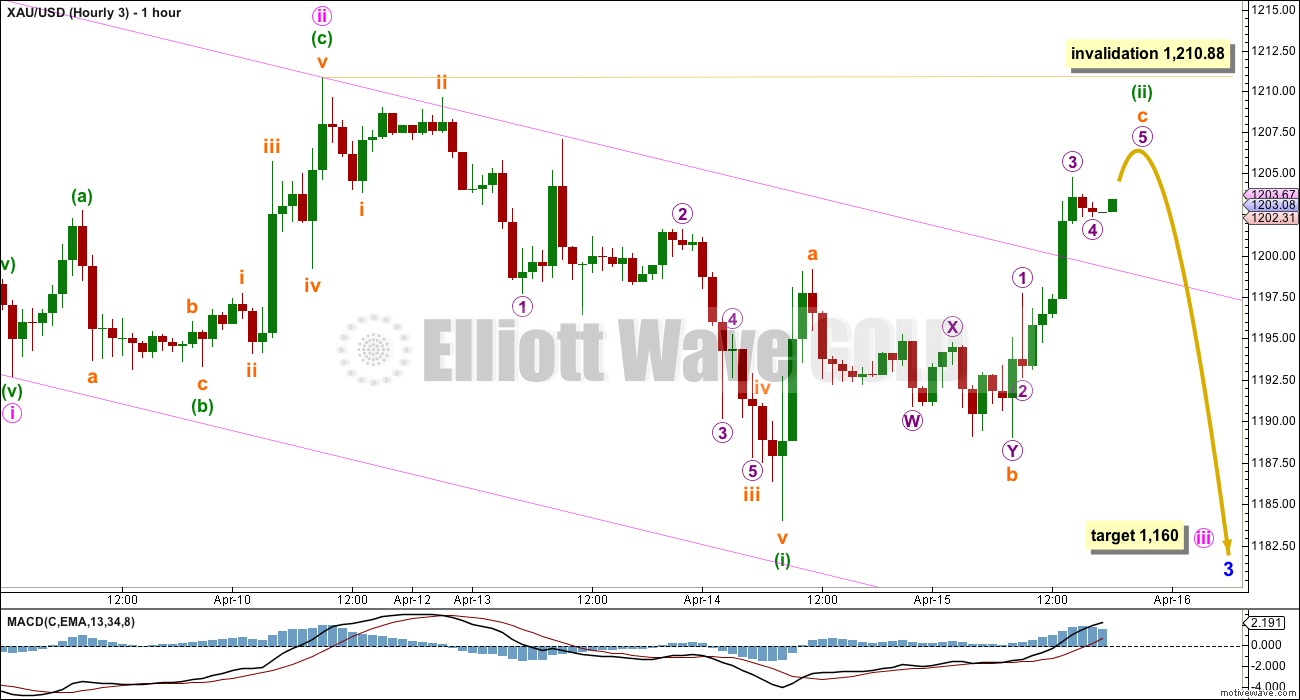
Within minute wave iii minuette wave (i) is complete. Minuette wave (ii) breaches the base channel. Minuette wave (ii) is incomplete.
Within minuette wave (ii) micro wave 5 needs to complete a five wave impulse up for subminuette wave c. When this is done this wave count expects an increase in downwards momentum.
At 1,160 minute wave iii would reach 1.618 the length of minute wave i.
Minuette wave (ii) may not move beyond the start of minuette wave i above 1,210.88.
Wave Count #4
This wave count is identical to wave count 3 up to the low labelled minute wave i within minor wave 3 down.
Minute wave ii may not be over and may be continuing as a very common expanded flat correction. The problem of the breach of the base channel about minute waves i and ii for wave count 3 is resolved.
Pros:
1. Price remains within the base channel about minor waves 1 and 2.
3. The proportion of minute wave ii looks right.
Cons:
1. Within minor wave 1 there is gross disproportion between minute waves iv and ii: minute wave iv is more than thirteen times the duration of minute wave ii giving minor wave 1 a three wave look.
Minute wave ii may not move above the start of minute wave i above 1,224.35.
At 1,059 minor wave 3 would reach equality in length with minor wave 1.
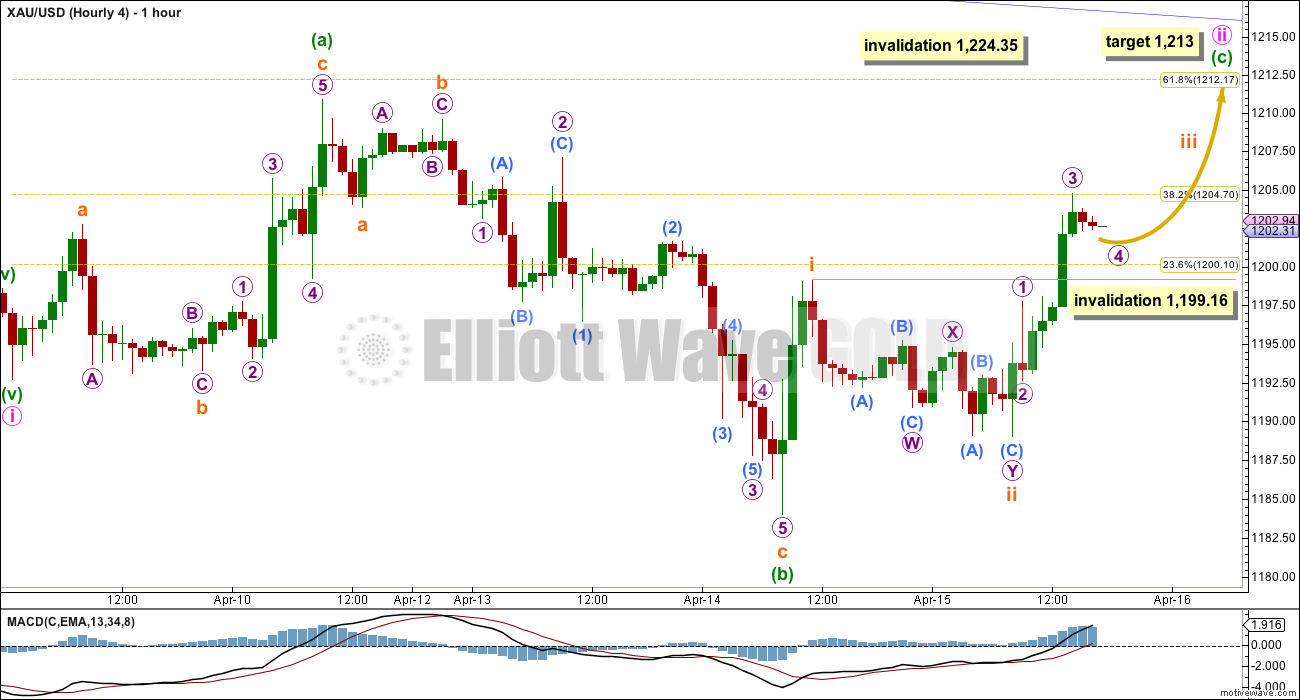
Within minute wave ii expanded flat minuette wave (b) has a slightly better fit as a three than a five.
Minuette wave (b) is a 159% correction of minuette wave (a). At 1,213 minuette wave (c) would reach 1.618 the length of minuette wave (a). This would see minute wave ii end at the 0.618 Fibonacci ratio of minute wave i. Minuette wave (c) is extremely likely to make at least a slight new high above the end of minuette wave (a) at 1,210.88 to avoid a truncation and a very rare running flat.
Minuette wave (c) must subdivide as a five wave structure. So far it looks like an impulse. Within this impulse subminuette wave iii is close to completion. The following correction for subminuette wave iv should be shallow and sideways, because subminuette wave ii was deep. Subminuette wave iv may not move into subminuette wave i price territory below 1,199.16.
If I had to pick a winner it would be this wave count. But it has too many problems for me to have full confidence in it.
This analysis is published about 07:16 p.m. EST.
Lara, you put a tremendous amount of work into 15 April gold and silver analysis. Thanks. Market is crazy, be sure to get outside get some ocean air, keep your mind clear. Feel The Force.
Thank you. Yes, that took almost all day.
No waves for me this week. The pacific ocean is having an identity problem, it thinks it’s a lake.
Analysis is being proofed now, because it’s so huge it was not able to be published before NY closed. Should be published momentarily.
Lara is the preferred still Hourly 4 and next target at 1,059 minor wave 3?
Estimated time to 1,059
It’s my pick, but its got too many problems with it for me to have confidence in it.
They all expect at least a little downwards movement right now. A mid term target for hourly 4 is 1,126.
I’m not siding with a wave count yet, but it sure feels like gold is getting ready to bust through this $1205-$1208 resistance. Massive GLD may call options were traded yesterday and today. The more times you bump up against resistance, the more likely it is to give way. We all know we’ve bumped up against it at least 3 different times. Simple TA and just my thoughts.
Looks like the market is waiting for econ data to be released tomorrow morning before it breaks decisively one way or another. Very tough to divine from the charts whether the numbers will be strong (gold breaks down) or weak (gold shoots up). I vote gold goes down, but I am by no means highly confident of that.
Agreed…looks like gdx, gdxj, and gld are all sitting within 2 cents of their 50 sma.
Dont see why move from nov to jan must be a diagonal..
Bob, maroon line changes because primary 1 and 2 have a new location…
This channel looks pretty good. The overshoot at Intermediate 2 and 3 balance each other out. Thanks for providing the near term target of 1250 as well. I like your work.
Here is how I’ve been trading the GDX (via NUGT & JNUG)…see attached.
And here’s a view from the 30-min GDX chart…classic breakout back test. Someone was asking last night if we’d get the back test and of course I didn’t know. But when it gets served up to you on a silver platter you gotta take it. It’s not that buying back tests are a sure thing…it’s that you know very quickly and with a very tiny loss if you’re wrong. It’s all about picking manageable risk/reward entries and exits from my perspective.
How low do you let gold go before you buy jnug?
If I had wanted to buy more JNUG I would have bought at same time as NUGT.
I am expecting we will be range bound through options expiration tomorrow…giving everyone the weekend to think about what happens next.
And I’m taking opposite approach….just added to NUGT on GLD touch back to channel support.
Then, gold up to 1240?
On the spot gold daily chart I see a bullish flag forming which will break out on a close above 1205 or so. If we get follow on, my fib projection would be about 1243.
Silver is dropping faster than gold, miners really dropping fast…silver was only up about the same as gold in %…an indication to be cautious on the long side…
Cashed out of dslv with a tiny gain…so much uncertainty…holding jdst for now…waiting for the right horse.
likewise.. exited jnug and swapped to dust
We might still have a miner rebound, but I will wait for more clarity…
just exited with small profit. Maybe JNUG again
Good job btw
Thx. Not much profit to be had today, alas.
Horse #4 is out of the race…Invalidated with the drop below 1199.16.
I’m not too sure about that. 1199.16 only invalidates subminuette 4, not beyond. I think subminuette 4 has been passed already with the rise towards 1209.11 earlier today.
Good point. So that count 4 would currently be in wave iv.
That is what I think it is. Good observation.
I have horse #4 still in it actually, but minute ii would have ended as a running flat because minuette wave (c) didn’t quite manage to make it above (a) at 1,210.88. It only got up to 1,209.22.
I have it as a complete five wave impulse for minuette wave (c), the fourth wave ended earlier and was quick. The subdivisions are perfect.
I have horse #4 now in the earliest stages of a third of a third wave down; minute iii within minor 3.
Philly Fed Manufacturing Index Rises To 7.5 In April
By Kitco News Thursday April 16, 2015 10:00 AM
http://www.kitco.com/news/2015-04-16/April-Philly-Fed-Manufacturing-Index.html
The US Dollar spiked up .25% and gold dropped $5 in 6 minutes from the news.
What are the current odds on each horse? I fancied #2 and #4, but now looks like the pullback may be beginning and #1 & #3 could be taking the lead.
The problem with the horse racing analogy is that we are all supposed to hold off wagering until we see which horse wins. Of course that’s not the way it works.
Debbie Downer….
Ok, how about this, maybe its like Nascar, where we are picking a manufacturer to win the race, just not sure which car yet.
I like the horse analogy…someone’s horse just broke a leg 5 minutes ago…can’t tell which one though…just my perspective, but the miners don’t look so strong here.
Horse #4, ‘Kiwi Wave Rider’ appears to have found some mud on the track…lets see if she can pull out of it.
Yes #4 is out. Three left.
No. See my post to MTLSD two hours ago. Horse #4 can only be disqualified with a price rise above 1224.35, and we are nowhere near that.
You can follow my Guide below.
The sure bets are:
(1) If price moves higher than 1224.35, only horse @2 is left in the race. All the others have been disqualified.
(2) If price moves below 1178.59, only horses #1, 3 and 4 are left in the race. At 1142.82. #1 is disqualified but the other two horses are still running strong.
Since we are betting on price, not individual horses, any bet either up or down would not pose a problem. If the price seems to move away from your bet direction, it would return later; it only takes time.
At 6:25 AM EST Gold made high 1211.11.
Invalidation points:
Hourly count (1) : 1210.88
Hourly Bull count (2): 1189.04
Hourly Count (3) : 1210.88
Hourly Bull count (4) L 1199.16
Counts 1 and 3 are invalidated. Only two bull counts are running.
TKL
Now you have only two horses running. Both Bulls
Am I correct?
On pmbull, the highest recorded today is 1209.11. All horses are still in the race according to my Racehorse Guide below.
Lara, really appreciate your insight in making some sense out of the turmoil. We now have a very interesting scenario. MLTSD has given us a very witty analogy. Perhaps I can elaborate the story further — the official Racehorse Guide authored by Lara.
We have a race towards a gold trophy. There are two possible courses, one towards the bull finishing line which horses @1 and #2, having drawn lots, are supposed to race towards. The other is the bear finishing line which #3 and #4 are supposed to head for. In addition, horse #1 has drawn a very difficult route. It is supposed to head towards the bear line first before making a U-turn towards the bull line. The horses are wild and have no sense of direction. It is up the jockeys to steer them. Needless to say, they are confused at the start.
There are 4 checkpoints along the courses which if the wrong horse were to wander past they would be instantly disqualified.
The first checkpoint is the 1210.88 mark. It disqualifies #3 (and #1 initially). #1 has to veer off before the mark and head for the bear line in order to stay in the race. Meanwhile, horses #2 and #4 can cross this mark.
The second checkpoint at 1224.35 is the entry gate to the bull finishing line. Horse #4 cannot cross this mark otherwise it will get a red card. It has to veer off before this mark and head for its final destination. Horse #2 would be left now to navigate past this mark in order to be in the race (to be followed in the later part of the competition by horse #1). It can take its time, but it cannot cross the third checkpoint, 1189.04 / 1178.59. Horses #1, #3 and #4 must cross this mark.
The final checkpoint is 1142.82, the entry gate to the bear finishing line. Horse #1 cannot cross this mark but must turn around and head for the bull line. Horses #3 and #4 must cross this final hurdle.
The betting booths are officially open at 0930 ET, although privileged punters can place their bets earlier. Lara’s favourite is horse #4. I have no pre-race favourite and will place my bets later.
beautiful!
I love it. Makes me laugh.
Yes, it is confusing. I can see more horses… but need to keep the number of charts to a reasonable limit.
Thank you Tham.
This feels like we are calling a horse race…hourly 1 and 3 are pulling away but 2 and 4 are not far behind…
lol. exactly. and i’ve been just sitting on the bleachers watching. nice analogy MTLSD.
Lara,
Do you have a preference?
Yes. 4.
Your horse is still in the race, came within less than $1 of the invalidation of #4.
Was so close to getting this one right yesterday. Oh well. That happens and I’m back on the horse. I just detest chasing and getting whipsawed, but this movement seems very strong indeed. We shall see.
That movement up yesterday at 8:30 ET from 1184 to 1198 looked like it had to be a 3, not an impulse because the 1st and 4th waves within it overlapped per my data. It convinced me the up move was corrective and not the start of something big. It still does, but maybe my data is simply wrong (i use investing.com). I had checked it out at the 5 minute level too. Not fair in my book 🙂
Gold price movement is conflicting to say the least. On a best case optomistic note would expect upward movement to be curtailed by 20weekMA (1209) and 100dma (1210.84) to keep the bearish outlook going for a break below 1197-95 for 1191-90 and possibly lower 1186-83…. A pullback / short term decline / downturn is expecting.
Gold hit about 1207.5…I’m hoping for the 2nd bear wave count–Lara says, though cautiously, that this one may be more likely. If I understand this correctly, I’m guessing that the 3rd wave is complete for it near 1207, and we need sideways movement for the 4th wave not to go below 1199, then a 5th wave target up to near 1213, not to exceed 1224 area. Then to see a rapid decline towards 1059…
Hi Victor: As I can see, the task ahead for gold price is to get below 1204 and then 50dma/20dma (1199-96) before consider lower…. On the upside, would expect upper band at 1216/15 to curtail before seeking 1222/23 limiting… MACD and momentum is bullish, ROC and stochasticis is bearish, can expect a good down move! lol….
I’m seeing some indications on my UUP charts that the $USD may be topping or at least weak/consolidating for a while now. The intraday structure looks bearish. Also my year over year $GOLD:$USD charts are suggesting that a significant gold bottom may be at these general current levels which frankly surprises me because I’ve long believed that this bounce would be corrective only to be followed by a deeper bottoming. Now I’m not so sure but I’ll just let the developing charts guide me.
When Euro or Sterling gold charts are studied they are much more obviously bullish.
Gold USD is heavily manipulated. This Tuesday, 8000 GCM5 contracts were dumped, almost certainly by a central bank prior to the release of poor economic news. This was deliberately done to send price down and mitigate the bullish response of the market to gold.
There is huge physical buying going on at these levels which will make capping price increasingly difficult in the face of increasingly poor economic data. Additionally the dollar index shows a weakening USD. All bullish for the gold price.
GDX chart
Lara, thanks for all the detail. I know we are all trying to figure this out and it’s time consuming. As you stated, would really like to see your updated thoughts on GDX and Silver when you have time. Also would like to get your thoughts on Jaf’s long term Gold count posted the last couple of days showing that P4 may not be over. Thanks again for all your work!
Thank you very much for your patience.
i’m aware of variables…we’ll see