
Downwards movement was expected for wave counts 1, 3 and 4. With price still just above 1,184.04, all Elliott wave counts remain valid and all will be again presented.
Summary: Gold remains in a sideways consolidation phase which began on March 27th. Since price entered the consolidation phase the strongest volume is still on down days, indicating that when the breakout comes it may be more likely to be down than up. Volume continues to decline, which often happens towards the end of a consolidation phase. However, the Elliott wave picture remains unclear.
A new high above 1,209.30 would invalidate wave count 1 at this stage.
A new low below 1,184.04 would invalidate wave counts 1, 2 and 3 at this stage. That would leave only wave count 4 as valid.
A new high above 1,224.35 would invalidate wave counts 1 and 4, leaving wave counts 2 and 3 valid.
I will be looking for an alternate bullish wave count today which sees minor wave 2 continuing lower. The final invalidation point for any alternate for the bull wave count must be at 1,142.82. Only a new low below this point would provide substantial confidence in the bear targets of 1,059 and 957.
Click on charts to enlarge.
To see weekly charts for bull and bear wave counts go here. Wave counts 1 and 2 follow the weekly bull count, wave counts 3 and 4 follow the weekly bear count.
Wave Count #1
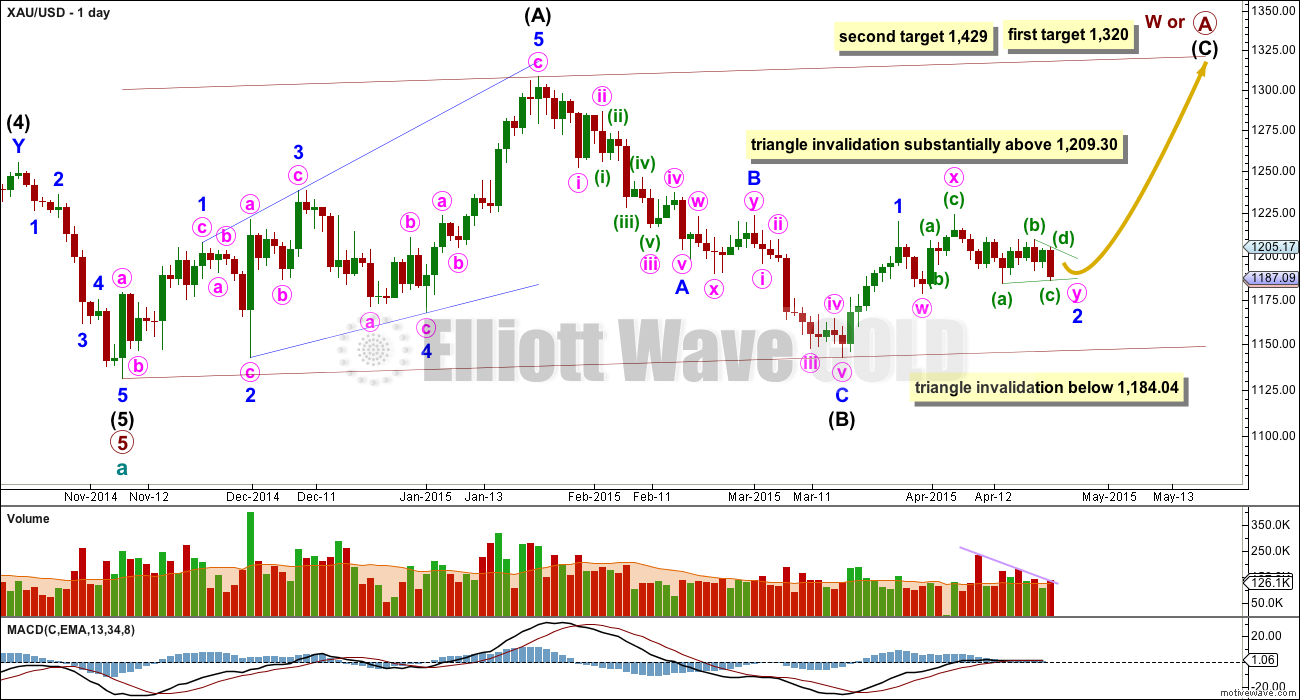
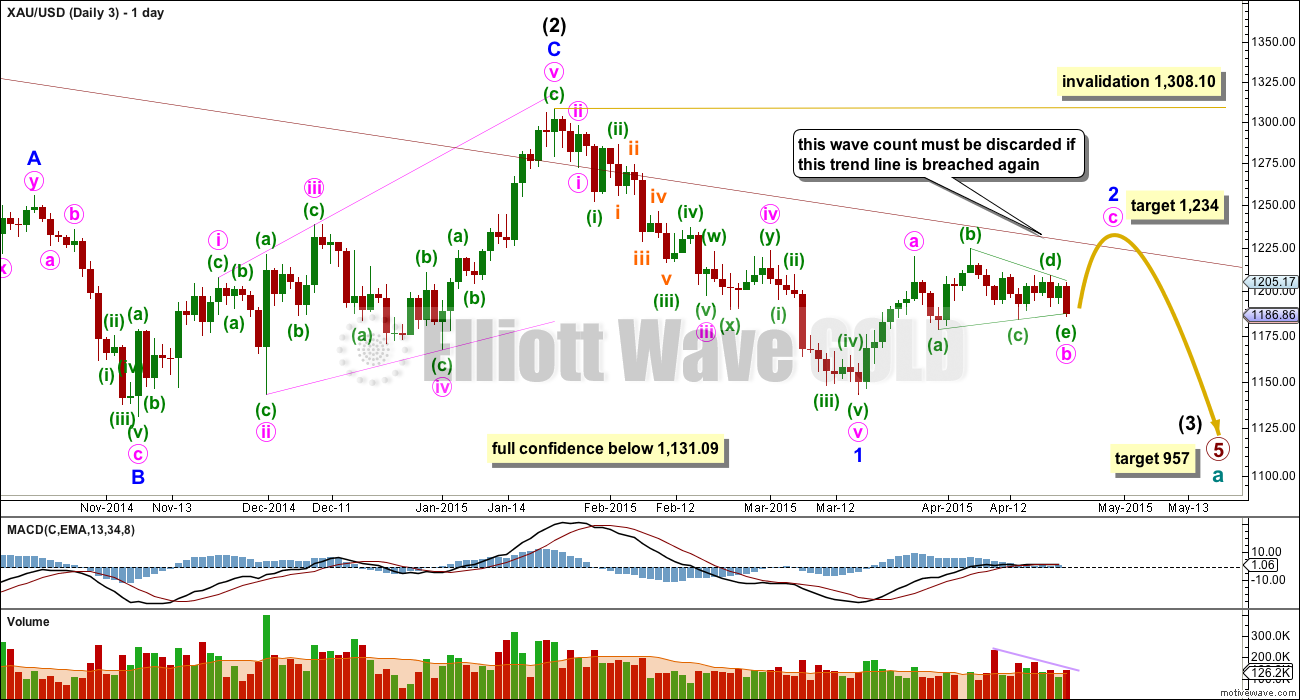
So far within cycle wave b there is a 5-3 and an incomplete 5 up. This may be intermediate waves (A)-(B)-(C) for a zigzag for primary wave A, or may also be intermediate waves (1)-(2)-(3) for an impulse for primary wave A. Within cycle wave b primary wave A may be either a three or a five wave structure.
Intermediate wave (A) subdivides only as a five. I cannot see a solution where this movement subdivides as a three and meets all Elliott wave rules. This means that intermediate wave (B) may not move beyond the start of intermediate wave (A) below 1,131.09. Intermediate wave (B) is a complete zigzag. Because intermediate wave (A) was a leading diagonal it is likely that intermediate wave (C) will subdivide as an impulse to exhibit structural alternation. If this intermediate wave up is intermediate wave (3) it may only subdivide as an impulse.
At 1,320 intermediate wave (C) would reach equality in length with intermediate wave (A), and would probably end at the upper edge of the maroon channel. At 1,429 intermediate wave (C) or (3) would reach 1.618 the length of intermediate wave (A) or (1). If this target is met it would most likely be by a third wave and primary wave A would most likely be subdividing as a five wave impulse.
Within intermediate wave (C) minor wave 2 is seen as a double combination: zigzag – X – triangle. The triangle for minute wave y would be about only halfway through.
Pros:
1. Combinations are reasonably common structures.
2. On the daily chart MACD is hovering at zero. This sideways chop of the last 12 days does look like a possible triangle.
3. The upwards wave labelled minute wave x does look like a three on the daily chart.
Within the triangle of minute wave y minuette wave (c) may not move beyond the end of minuette wave (a) below 1,184.04.
If minute wave y is a contracting triangle then minuette wave (d) may not move beyond the end of minuette wave (b) above 1,209.30.
If minute wave y is a barrier triangle then minuette wave (d) should end about the same level as minuette wave (b) at 1,209.30, as long as the (b)-(d) trend line is essentially flat. In practice this means that minuette wave (d) may end slightly above 1,209.30. This is the only Elliott wave rule which is not black and white.
For this wave count 1 I would expect sideways choppy movement for much of this week. The breakout would be expected to be upwards.
If price moves below 1,184.04, then for the bull wave count, I am trying to see an alternate possibility which allows for minor wave 2 to be continuing lower. At this stage the only possibility I can see would relabel intermediate wave (C) as an ending diagonal with minor wave 1 a zigzag and downward movement a zigzag for minor wave 2. This has an extremely low probability because intermediate wave (A) was a leading diagonal, and is highly unusual for both A and C waves of a zigzag to both be diagonals.
If minor wave 1 ends as labelled here, as an impulse, then minor wave 2 (if it is continuing) may only be a flat or combination. A flat correction would see a five wave structure down for minute wave c unfolding, and there is still too much choppy overlapping movement for this to look right (which is why I discarded it a few days ago).
The invalidation point, if there is any continuation of minor wave 2 as a different structure to that labelled on this daily chart, would be the start of minor wave 1 at 1,142.82. Only a new low below 1,142.82 would finally invalidate alternate ideas for this bull wave count.
Volume continues to decline indicating Gold is still in a consolidation phase which is nearing maturity. If the breakout is upwards is should come with a substantial increase in volume for an up day when it happens.
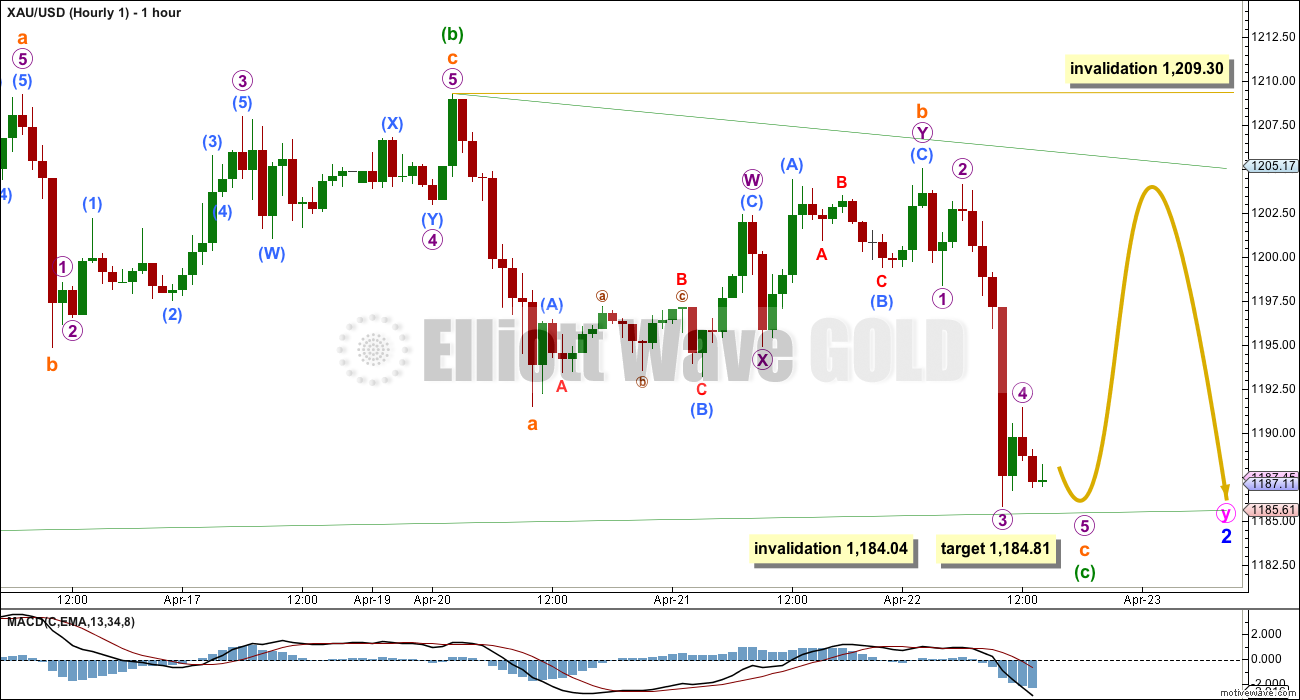
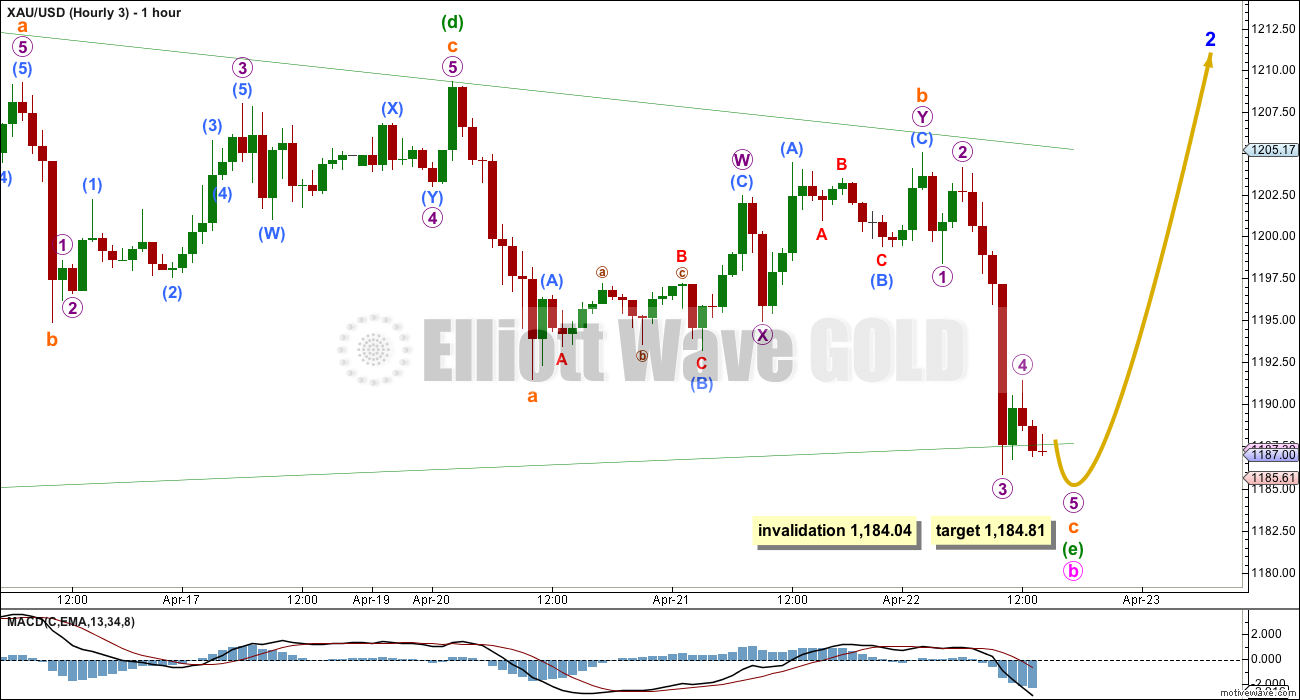
The hourly charts today will all show movement since the high at 1,209.22.
This first wave count sees movement since 7th April as a regular contracting or regular barrier triangle. Only waves (a) and (b) are complete, and both subdivide best as single zigzags. This means that one of the remaining sub waves should subdivide into a more complicated and time consuming double, or possibly a triangle to complete a nine wave triangle.
Minuette wave (c) is an almost complete zigzag. Within it subminuette wave c should be a five wave structure, and the final fifth wave of micro wave 5 is almost complete. At 1,184.81 micro wave 5 would reach equality in length with micro wave 1.
Minuette wave (c) of a contracting or barrier triangle may not move beyond the end of minuette wave (a) below 1,184.04. This invalidation point will remain black and white while the triangle is completing.
When minuette wave (c) is complete then minuette wave (d) upwards of a contracting triangle may not move beyond the end of minuette wave (b) above 1,209.30.
Minuette wave (d) upwards of a barrier triangle should end about the same level as minuette wave (b) so that the (b)-(d) trend line is essentially flat. In practice this means that minuette wave (d) may end slightly above 1,209.30 and so this invalidation point is not black and white.
The final wave of the triangle for minuette wave (e) would be most likely to undershoot the (a)-(c) trend line, and less likely to overshoot the (a)-(c) trend line.
Wave count 1 expects the most sideways movement, and the breakout for this idea may not come until next week.
Wave Count #2
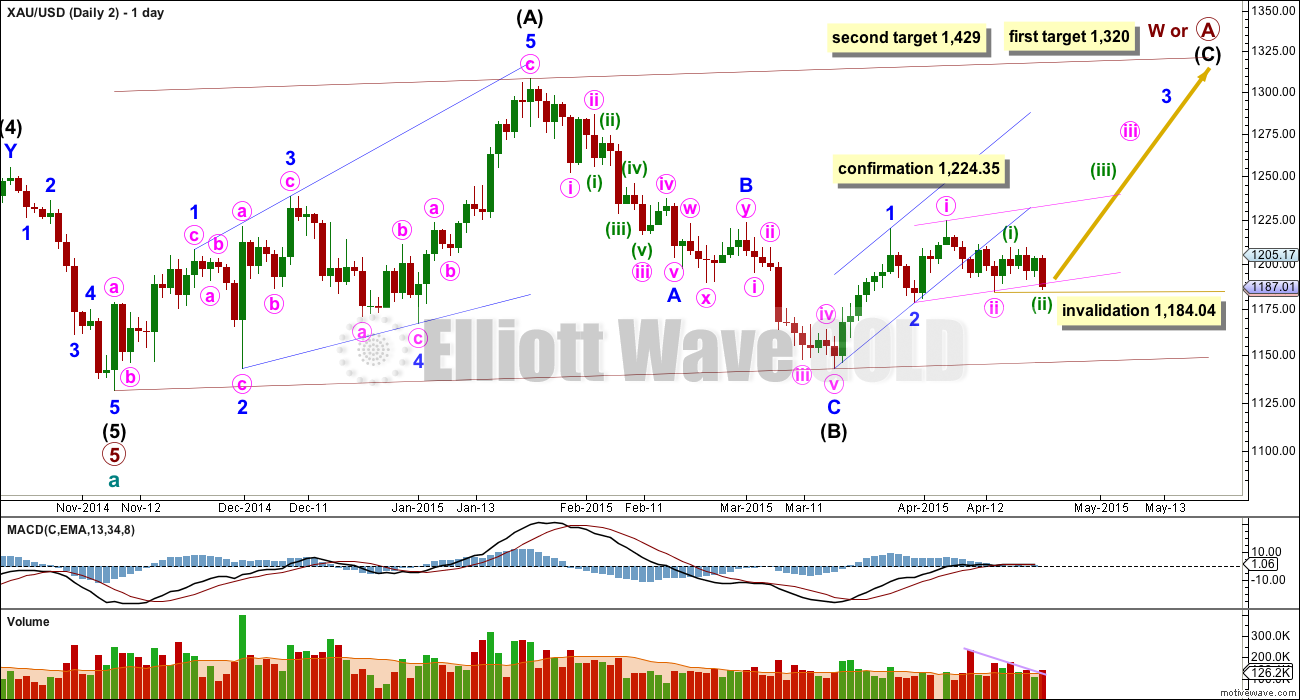
This wave count is identical to wave count #1 up to the high labelled minor wave 1. Thereafter, instead of minor wave 2 continuing it sees minor wave 2 as complete, within minor wave 3 minute waves i and ii complete, and now within minute wave iii minuette waves (i) and (ii) are also complete.
Pros:
1. Minute wave ii looks like a clear three wave movement now on the daily chart.
2. Minor wave 3 should show its corrections for minute waves ii and iv clearly on the daily chart.
Cons:
1. Minute wave ii clearly and strongly breaches the lower edge of a base channel drawn about minor waves 1 and 2, one degree higher.
2. Minute wave ii is twice the duration of minor wave 2 one degree higher.
3. The upwards wave of minute wave i looks like a three on the daily chart, but it should be a five.
4. Minuette wave (ii) has now moved further sideways / lower for this wave count, and overshoots a base channel drawn about minute waves i and ii, as well as the higher degree channel about minor waves 1 and 2. It is four days in duration, longer than minor wave 2 two degrees higher. This looks very wrong now.
Minuette wave (ii) may not move beyond the start of minuette wave (i) below 1,184.04.
For wave count 2 I had left the invalidation point at 1,184.04 to allow for the possibility that minuette wave (ii) could continue. For wave count 2 this is what may have happened.
However, structure does not support this wave count. Minuette wave (ii) subdivides now as a double combination, but the second structure in the double deepens the correction giving the correction a downwards slope, not sideways. This is contrary to the purpose of combinations which is to take up time and move price sideways, so they normally have a sideways trend.
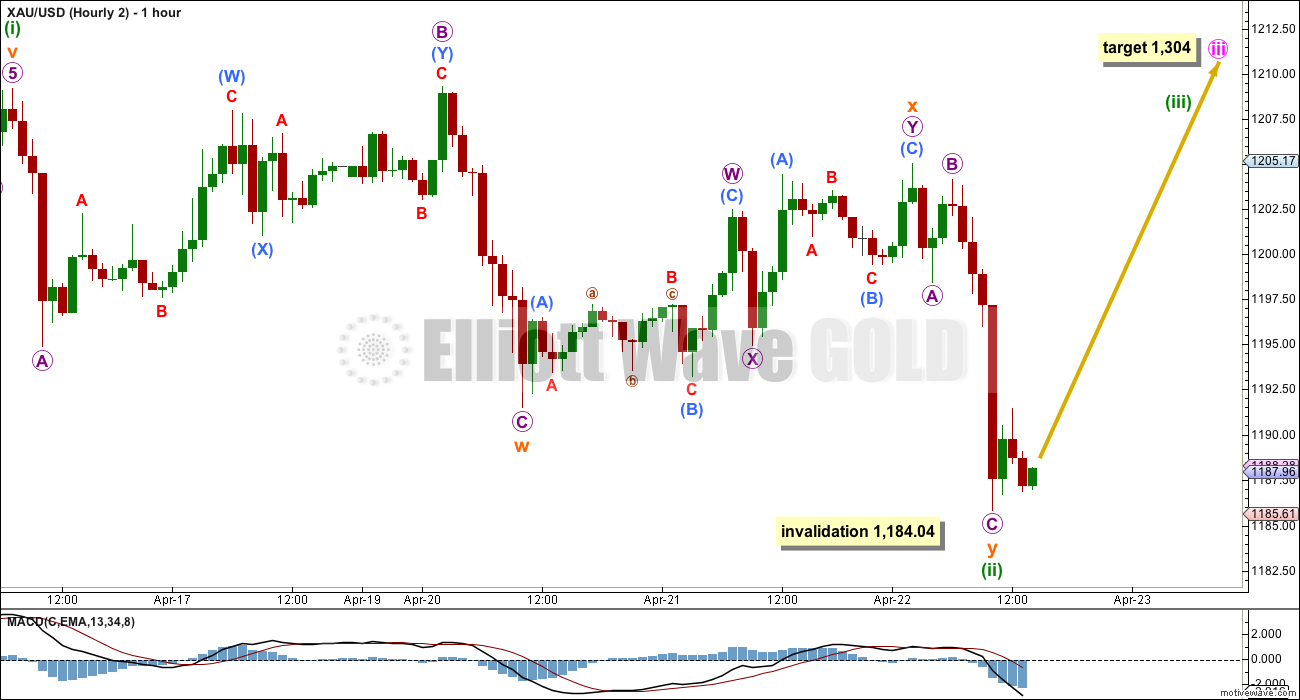
The combination subdivides as a flat – X – zigzag. In the very short term if there is a new low below 1,185.83 this wave count will further reduce in probability because at that stage subminuette wave y would be a clear five wave impulse and not a three wave zigzag. Subminuette wave y must be a three for this wave count to make sense.
At 1,304 minute wave iii would reach 2.618 the length of minute wave i.
Wave Count #3
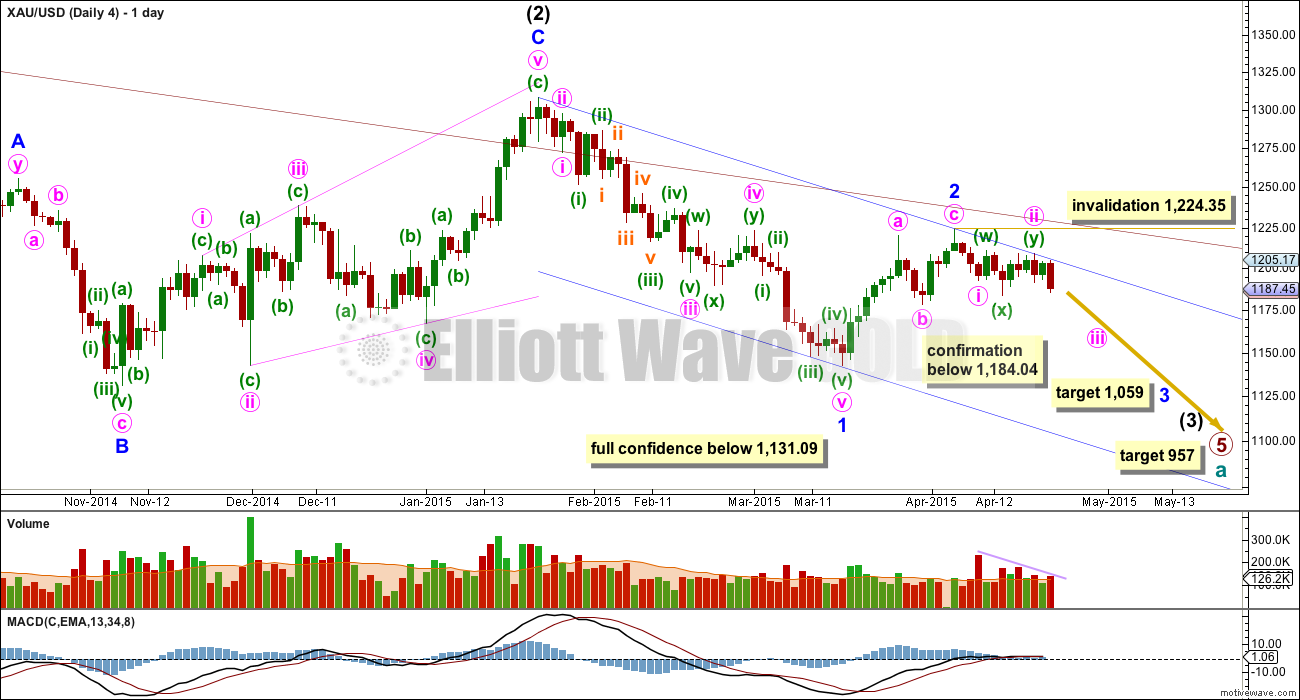
This wave count follows the bear weekly count which sees primary wave 5 within cycle wave a as incomplete. At 957 primary wave 5 would reach equality in length with primary wave 1.
This wave count sees minor wave 2 as an incomplete zigzag, and within it minute wave b a close to complete running contracting triangle. The final wave of the triangle, minuette wave (e), is overshooting the (a)-(c) trend line.
When the triangle is complete then the zigzag for minor wave 2 should end with a small wave up for minute wave c. It should find strong resistance at the upper edge of the maroon channel copied over here from the weekly chart. If this maroon trend line is breached again by a full daily candlestick above it and not touching the maroon trend line then this bear wave count should be discarded.
At this stage the triangle is almost complete. At 1,234 minute wave c would reach 0.618 the length of minute wave a. This target expects an overshoot of the maroon trend line, which would still be acceptable, as long as it is not properly breached. If the target is wrong it would be too high. Minute wave c is extremely likely to make at least a slight new high above minute wave a at 1,219.99 to avoid a truncation.
Pros:
1. The upwards waves of minuette waves (b) and (d) do look like threes on the daily chart. A triangle nicely explains the sideways chop of the last 19 days.
2. MACD supports the idea of a triangle unfolding as it is hovering at the zero line on the daily chart.
3. Volume supports the idea of a triangle (a typical consolidation phase normally sees declining volume towards its end).
Cons:
1. Minor wave 2 would be much longer in duration than a minor degree second wave normally is for gold.
Minor wave 2 may not move beyond the start of minor wave 1 above 1,308.10.
The final wave of the triangle is almost complete. Minuette wave (e) may be a zigzag, and within it subminuette wave c must be a five wave structure. Subminuette wave c is an almost complete impulse.
Within subminuette wave c micro wave 3 is 1.01 longer than 2.618 the length of micro wave 1. At 1,184.81 exactly micro wave 5 would reach equality in length with micro wave 1.
Minuette wave (e) of this contracting triangle may not move below the end of minuette wave (c) at 1,184.04.
Wave Count #4
This wave count is identical to wave count 3 up to the low labelled minor wave 1. Thereafter, it still sees minor wave 2 as a completed zigzag, and minor wave 3 in its very early stages.
Minute wave ii is seen as a completed double combination.
Pros:
1. The proportion of minute wave ii looks right.
2. Upwards movement continues to find resistance at the upper edge of the blue base channel drawn about minor waves 1 and 2.
3. It is very common for a third wave to begin with a series of overlapping first and second waves.
4. If Tuesday’s session is a small correction within a downwards trend then it should have lower volume.
Cons:
1. Minute wave c on the daily chart looks like a three wave structure, but on the hourly chart it does subdivide very nicely as a five. This is only a small detraction.
2. Volume for Wednesday’s session is higher than prior up days, but still not a strong spike. Downwards breakouts do not necessarily have to be associated with volume spikes as the market may fall of its own weight. A volume spike would increase probability of this wave count, but its absence is only a small detraction.
At 1,059 minor wave 3 would reach equality in length with minor wave 1.
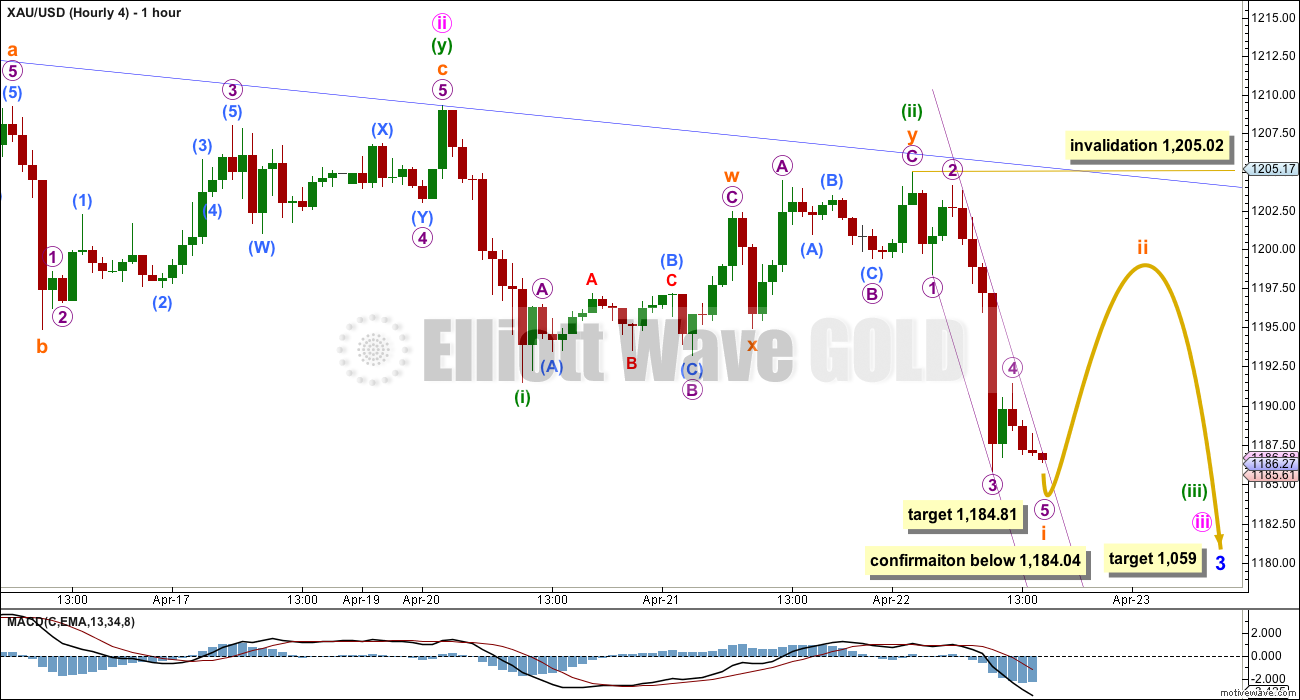
The blue base channel is copied over to the hourly chart. Upwards movement continues to find support right at or just below this blue trend line.
Within minor wave 3 there are now two overlapping first and second waves for minute wave i and ii, and minuette waves (i) and (ii).
Within minuette wave (iii) subminuette wave i is an almost complete impulse. The target for this impulse to end is the same at 1,184.81. When it is done then another second wave correction should be expected which may or may not show up on the daily chart. When the impulse is completed then upwards movement should breach the narrow best fit channel drawn on this hourly chart about subminuette wave i. That would be earliest indication subminuette wave ii has begun.
When subminuette wave ii begins draw a Fiboancci retracement along the length of subminuette wave i. Use the 0.382 and 0.618 Fibonacci ratios as targets for subminuette wave ii to end. Subminuette wave ii may not move beyond the start of subminuette wave i above 1,205.02. If it gets that high (which is very unlikely) it should again find very strong resistance at the upper blue trend line copied over here from the daily chart.
This analysis is published about 03:49 p.m. EST.
This move down (but nor below 1,184.04) and then up looks like exactly what I had expected. With two slightly confusing structures in it.
This comment follows the hourly chart for wave count #4:
Within the downwards impulse of subminuette wave i micro wave 4 looks like a combination, but the second structure in the double ends below the first, not at the same level. This isn’t technically a truncation, but it has the same effect. it gives micro wave 4 an odd look. But that’s okay, sometimes combinations look like that.
The upwards move we are seeing from the low at 1,184.45 looks corrective…. so far. It’s reached to just above the 0.618 Fiboancci ratio of the prior impulse down which is at 1,197.12. If this is a correction then it is extremely likely to be over there. If it moves higher then it should find resistance and end at the blue base channel on wave count 4 if that’s the correct count, but if wave count 2 is correct it should move up strongly from here.
Volume is lower than the prior down day. Volume continues to indicate the breakout is more likely to be down than up.
I still favour wave count 4, but it is vital to patiently wait for price to confirm.
I am still looking for an alternate bullish wave count which would allow for minor wave 2 to continue lower, invalidation point would be 1,142.82. It is still extremely important I continue to consider all possibilities until price finally tells us if bull or bear count is correct.
If wave count 4 is correct then Friday should give us a long red candlestick with increased downwards momentum & increased volume. Short term target 1,144.
I’m off to write that up and prepare your video now. Good luck everyone!
I agree Lara, tomorrow could be down big. I’ve changed my stance. If this was a triangle completing, I would have expected more momentum.
? wouldn’t the completion of a triangle coincide with very low momentum? MACD right on zero?
That’s what I would expect anyway. And declining volume.
I like triangles completing with sharp reversals which then show an increase in momentum. I also don’t like when the e wave comes so close to invalidation. This is just my experience and I could be wrong. Clear best risk/reward was to go short $1196ish which I did.
I think your triangle idea is entirely valid. The tricky thing about triangles is to figure out exactly where they begin, and what the direction of entry was. Direction of entry and exit for EW triangles is always the same.
I agree. Now is perfect time to buy JDST.
thanks. im long since 1186 and covered it with a short near 1197. perfect. thx for the update before market close
Is gold in impulse wave up now? Or wave 5 still in play?
I am sure Lara can update us soon, but this feels impulsive to me.
Dollar is getting crushed.
Dollar is getting crushed, as recent data suggests the fed will not be as aggressive as was assumed.
However, it looks to me as though what would be a third wave up overlapped into first wave territory. Unless it is a part of a series of 1s and 2s, then this would be an ABC correction, and right now reaching into .618 area, it could be a second wave before a third wave down
I have it as a double zigzag which should be either complete or extremely close to completion. Looking at volume today is lower than the prior down day. Volume is still telling us Gold is more likely to break out down than up.
But all four wave counts remain valid. Gold hasn’t broken out of the sideways consolidation phase yet. It’s still range bound, extreme caution is recommended.
Thanks Lara. I might put on a hedge tonight.
How do u hedge?
Take a position in the opposite ETF. I am currently long JNUG, so I might pick up a JDST position before close.
Thanks got it. I thought u may buy option.
Some thoughts on DUST. I think an entry at $14 offers a nice risk/reward point with a stop just below. Here is my viewpoint on both the hourly and daily charts for context.
Started a DUST position long at 14.30.
Seems DUST filled yesterday’s gap at 14.10.
Cross finger this should hold.
Yes, I added to my position at 14.11.
Entered DUST 2 mins ago at 14.07
unfortunately someone broke DUST – its barely moving
I am still long my 75% position. I am watching for the 1184 invalidation point and using that as my sell signal. Until then, I am biased toward bull wave count.
I still like the Gold COT structure trend, and the Silver open interest is at an all time high. The last time that happened was around March 16th.
I can still show some charts that make the bull case as well but there are definitely some weaknesses and inconsistencies popping up. I like feeling fully confident and I don’t right now on the long side. Take a look at the my GG “Canary in the Coal Mine” chart. It has serious problems now and I’m probably going to start a DUST position today.
nice move up…exited with some profit after the a,b,c correction to 1186.15 levels
Looks like 1195 to 1196 zone will act as resistance for today
I agree. That would coincide with where I’d ideally like to exit my NUGT and JNUG.
I’m out…not worth the risk…gdx at 50 ma, gld not there yet, but unpredictable…
I just sold all longs 5 minutes ago as well.
Good job on all your trades…think I’ll wait for Lara’s analysis for my next move…
Me too.
I sold my GDX today from yesterday profitably. Lets see if Lara gives insight before the close worth buying into or else wait for next week.
Thanks. Sold a bit early and it looks like GDX 19.70 did get hit. I think that may be about it for the bounce. I’m looking forward to Lara’s analysis as well as I review my charts too near the EOD.
I saw that, too…its better to be on the safe side, though…
With trend now broken I’m looking to sell my GDX-based longs on this bounce. The structure is disintegrating and momentum is waning. Here’s my 15-min GDX trading chart. Looking for a bounce to about 19.72 to exit long and start looking short.
The current movement may be part of the complex wave that Lara is referring to : “This means that one of the remaining sub waves should subdivide into a more complicated and time consuming double, or possibly a triangle to complete a nine wave triangle. (sic)”
This is because the high at 1192.21 is less than the expected values of the rebound. This will be obviated if price falls below 1184.42, the beginning of this movement. It needs monitoring to determine whether the ensuing move will be up.
Yup. Looks like this is it. We have just completed 3 up (1192.21) and 3 down (1186.34). It couldn’t go lower than 1184.42 hence either a double or a triangle is odds on. The target is possibly 1195. A double will get us there quicker, but if it is a triangle … you can go fishing for the rest of the day.
Wondering it gold will go up from here or down?
Yes Research stockmarket, I do see your great chart thanks.
I already sold half my GDX that I bought at low near close last night and wondering it gold will go up from here or down? The US dollar has an effect.
Lara said when when the wave today completes up then a strong, breakout down.
Richard – If you look at my chart, I believe this is not a straight 3rd wave arrangement. It should be called as a,b,c waves as wave c is 115% of wave a
Has a 3 wave count completed from low of 1184.42 at 9:34 up to high this morning at 1192.21 at 7:39 am?
A high of 1195.91 on daily charts is possible. Not sure if it will happen today but pretty much showing high probability
It just happened the same way just now. It exactly completed 61.8% retracement point (low of wave a & high of wave c). Now we should look for another big wave in progress
My take is with this movement the a,b & c movement gets completed. 115% is a key mark
If the wave retraces at that point with a big red candle then we should wait for it to retrace to entire 61.8% and then look for buying opportunities
Gold just made it to 0.382 Fib level 1192.21 just shy of 1192.29. Is that qualify the move is over??
Lara Is it time to update US oil EW report?????
Thanks.
Yes. It’s in my target zone, but the structure is incomplete. An update would be timely.
Hourly 1 and 4 retrace up is a 3 wave structure as per Lara.
My sentiment: A rise ought to be curtailed by 1197/98 (20dma) if not earlier by pivot/50dma (1192-93); nonetheless, irrespective of an uptick, a drop through 1183-80 (50% retracement and the so known previous triple bottoms) is expecting for 1175 and lower….
Lara putting together all these 8 charts and the detailed video is a clear acknowledgement of your top notch Elliott Wave skills. Wow.
Thank you Richard. I am looking forward to a breakout and only 2-4 charts a day. 8 really is a bit much for members to get through.
Nothing confirmed or invalidated at this point 2:30 am EST
As per http://www.pmbull.com gold the most accurate site I have found and used for over a year and no problem with Lara’s invalidation points.
Gold dropped to 1184.42 at 9:34 pm EST, which is between Lara’s target of 1184.81 and invalidation/confirmation point at 1184.04.
Using Lara’s upper invalidation point of 1205.02 (which is 10 cents off pmbull’s 1204.92)
I come up to retrace targets for subminuette wave ii
1192.29 for .382
1197.15 for .682
1204 for upper blue trend line which Lara says is highly unlikely
1205.02 invalidation/confirmation
Richard
Fib is 0.618 not 0.682
Your gold price needs to be revised.
Thanks you’re correct. Actually I calculated .618 as 1197.15 but did a typo saying it was .682 above.
The lows I have at various sites are: 1184.18, 1184.28, 1183.70, 1184.32….
yes I use MT4 with ICM it also shows only 1184.24, so both wave count 1 & 4 on hourly chart are valid
Lara will you be updating GDX soon?
thanks
I had every intention of doing this last week when I updated Silver, but I am struggling with the wave count for GDX, particularly for the bear count.
This doesn’t mean anything except I can’t see the structure of the current upwards move clearly.
GDX doesn’t show typical looking EW structures, nor does it have many Fibonacci ratios. I’ve concluded there’s not enough volume in that market for reliable EW analysis of GDX.
When I figure it out I’ll publish it.
I certainly hope that I will publish it for you over the weekend. I apologise for the delay.
http://www.pmbull.com has gold low at 1184.42.
Per Lara .382 – .618 from this low should take gold to 1192 to 1197.
What if gold continue to go higher?????
1198 is daily resistance of trendline too. That might not break
Nice chart. That may come in as backtest before dropping ???
What low r u showing on your fata feed?
Yes.. Trendline break can be tested. and Then drop…
1184.24 at Fxcm
1184.03 at ironfx.com
Short it! lol…. 🙂
That is only for #4.
#1 can go up to 1205-1209. Invalidation 1209.30.
#3 may go as high as 1234.
As 5 waves down can be counted, #2 as it stands is invalidated as it has to be a 3-wave structure.
Syed’s advice is sound.
If you are in a trade up, then set trailing stop and prepare to short when it hits that.
If you are waiting to enter a short, then set that as an entry point, and buy when it hits that.
Whether wave 1,2,3 is invalidated or not, I’m betting on a $10-$12 bounce from $1183ish before resuming lower
Gold price is not likely to get to 1200 in a hurry, not today with 1195/98 limiting and is still having an inside week with H1209.30 / L1183.50 range not yet broken…. Downside 1180-75 ought to be breeze and easy pickings…. Not the place to be selling though with price barely above the lower band (risky)…. Gold price does sit deep in a trench and should be back up with a spark with nothing beyond 1206….
Gold printed 1184.03 at ironfx.com
does 1 2 3 wave count invalidates? Only 4th wave count valid now?
Is that the stream Lara uses? I cannot confirm that with pm bull…thanks, Richard for telling us about it, BTW…I show price staying above the invalidation level for now…open to further interpretation…
Lara uses FXCM feed for XAU/USD. The low so far was 1184.45 so all counts still valid.
Trading view’s feed shows 1184.25. little bugger.!
I’ve had some mixed success trying to trade Wolfe Waves….curious of other’s experience. I’ll post a textbook chart for those not familiar and then the structure I see in NUGT right now.
From my perspective, if one of the bull wave counts, or wave count 3 is correct, I can see that happening…hope so, I entered NUGT today…not feeling great about it though…might exit 11.70 area if your theory is correct. Silver was holding up–not down more % than gold…hard to say…regardless, I will exit my position tomorrow…
Victor – With the e wave getting over more than the hourly count 3 I guess it is the count 1 that will play out
Break out can happen only after a slight dip after the movement from current levels
Possible…I’m just looking for the 50 ma to reconnect in gdx near 19.60…then we’ll see how the etfs react…from there, more clarity in the wave count will come.
Yes this is correct Wolfe wave. Target line is the line connecting 1 and 4.
Mark – Can you provide some links to know more about Wolfe waves? I’m an enthusiast of EW analysis
By the way I saw your note couple of days back and I’m really sorry if I have entered into your personal space of providing proactive recommendations. It was only out of an advice mode and may be I went over board
I first read about Wolfe Waves about 15 years ago in one of Linda Raschke’s books about trading techniques. They don’t follow EW theory. Here’s a link that may be helpful. http://www.wolfewave.com/
And no worries about earlier communications. Trading is certainly a passionate topic.
GDXJ had $60M money flow buying on weakness today.
thanks for that – very important
The gold channel that researchstockmarket pointed out to me the other day may be the correct one. At least if I understood it correctly.
Lara, thanks for the early guidance before the close and the early analysis.