
Three of four Elliott wave counts had a short term target at 1,184.81. Price moved lower to reach 1,184.45 then turned up as expected. All four Elliott wave counts remain valid. I am changing wave count 2 substantially.
Summary: Gold remains in a sideways consolidation phase which began on March 27th. Since price entered the consolidation phase volume continues to decline, and it is strongest on down days. This indicates that when the breakout comes it may be more likely to be down than up. However, the Elliott wave picture remains unclear.
Wave count 1 expects overlapping movement for four more days.
Wave count 2 expects downwards movement to below 1,178.59.
Wave count 3 expects upwards movement from here to 1,232.
Wave count 4 expects a third wave down to 1,144.
A new high comfortably above 1,209.30 would invalidate wave count 1.
A new high above 1,224.35 would invalidate wave counts 1 and 4, leaving wave counts 2 and 3 valid.
A new low below 1,184.45 would invalidate wave count 3.
A new low below 1,184.04 would invalidate wave count 1.
A new low below 1,142.82 would invalidate wave count 2.
Click on charts to enlarge.
To see weekly charts for bull and bear wave counts go here. Wave counts 1 and 2 follow the weekly bull count, wave counts 3 and 4 follow the weekly bear count.
Wave Count #1
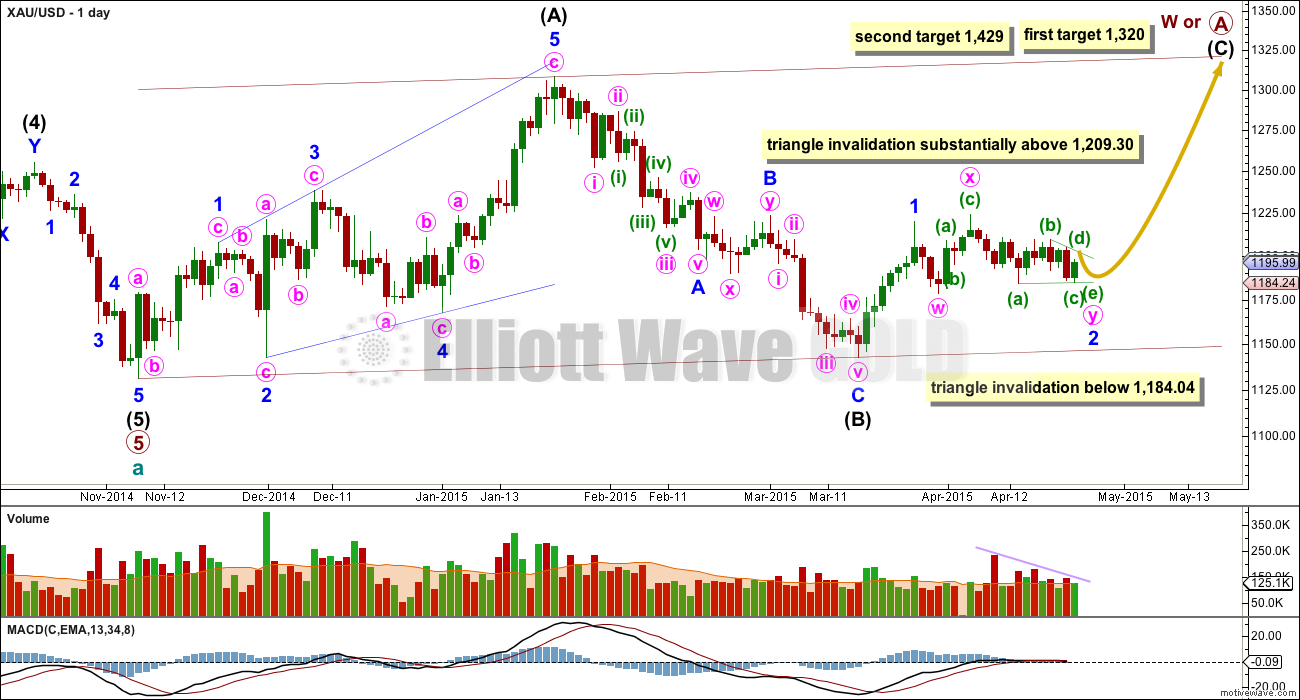
So far within cycle wave b there is a 5-3 and an incomplete 5 up. This may be intermediate waves (A)-(B)-(C) for a zigzag for primary wave A, or may also be intermediate waves (1)-(2)-(3) for an impulse for primary wave A. Within cycle wave b primary wave A may be either a three or a five wave structure.
Intermediate wave (A) subdivides only as a five. I cannot see a solution where this movement subdivides as a three and meets all Elliott wave rules. This means that intermediate wave (B) may not move beyond the start of intermediate wave (A) below 1,131.09. Intermediate wave (B) is a complete zigzag. Because intermediate wave (A) was a leading diagonal it is likely that intermediate wave (C) will subdivide as an impulse to exhibit structural alternation. If this intermediate wave up is intermediate wave (3) it may only subdivide as an impulse.
At 1,320 intermediate wave (C) would reach equality in length with intermediate wave (A), and would probably end at the upper edge of the maroon channel. At 1,429 intermediate wave (C) or (3) would reach 1.618 the length of intermediate wave (A) or (1). If this target is met it would most likely be by a third wave and primary wave A would most likely be subdividing as a five wave impulse.
Within intermediate wave (C) minor wave 2 is seen as a double combination: zigzag – X – triangle. The triangle for minute wave y would be about only halfway through.
Pros:
1. Combinations are reasonably common structures.
2. On the daily chart MACD is hovering at zero. This sideways chop of the last 17 days does look like a possible triangle.
3. The upwards wave labelled minute wave x does look like a three on the daily chart.
Within the triangle of minute wave y minuette wave (c) must now be complete.
If minute wave y is a contracting triangle then minuette wave (d) may not move beyond the end of minuette wave (b) above 1,209.30.
If minute wave y is a barrier triangle then minuette wave (d) should end about the same level as minuette wave (b) at 1,209.30, as long as the (b)-(d) trend line is essentially flat. In practice this means that minuette wave (d) may end slightly above 1,209.30. This is the only Elliott wave rule which is not black and white.
For this wave count 1 I would expect sideways choppy movement for four more days so that minute wave y totals a Fibonacci 21. The breakout would be expected to be upwards.
Volume continues to decline indicating Gold is still in a consolidation phase which is nearing maturity. If the breakout is upwards is should come with a substantial increase in volume for an up day when it happens.
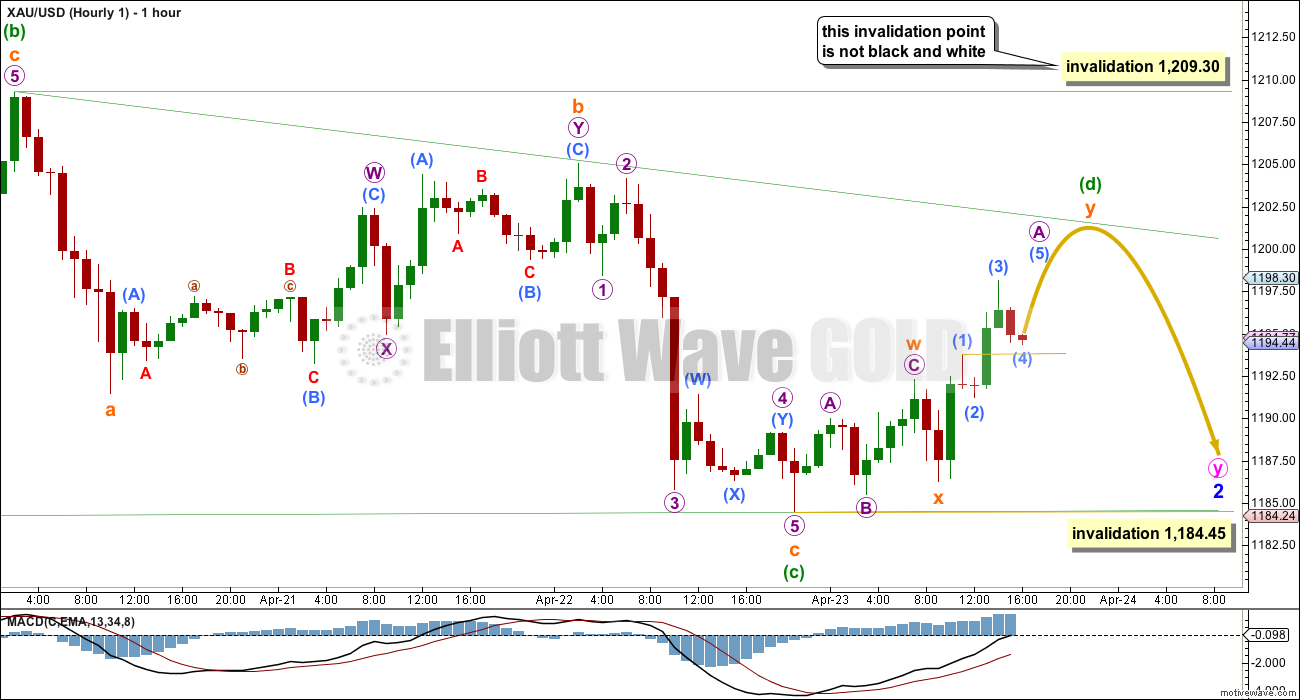
The hourly charts today will all show movement since the high at 1,209.30 today.
This first wave count sees movement since 7th April as a regular contracting or regular barrier triangle. Waves (a), (b) and now (c) are complete, and all subdivide best as single zigzags. This means that one of the remaining sub waves should subdivide into a more complicated and time consuming double, or possibly a triangle to complete a nine wave triangle.
Minuette wave (d) upwards may be an incomplete double zigzag. I expect it would be incomplete because it needs to move higher so that the (b)-(d) trend line is not overshot by prior upwards movement. I have placed the (b)-(d) trend line at its minimum slope for this triangle to have the right look. Triangles normally adhere very well to their trend lines. Sometimes the triangle trend lines are overshot while the triangle is underway, but they are almost never breached. Most commonly triangle trend lines provide extremely strong support and resistance and clearly delineate the triangle area.
Minuette wave (d) of a contracting triangle may not move beyond the end of minuette wave (b) at 1,209.30.
Minuette wave (d) upwards of a barrier triangle should end about the same level as minuette wave (b) so that the (b)-(d) trend line is essentially flat. In practice this means that minuette wave (d) may end slightly above 1,209.30 and so this invalidation point is not black and white.
The final wave of the triangle for minuette wave (e) would be most likely to undershoot the (a)-(c) trend line, and less likely to overshoot the (a)-(c) trend line.
Wave count 1 expects the most sideways movement, and the breakout for this idea may not come for four more days.
Wave Count #2
Wave count 2 has begun to look very wrong over the last two days. I am discarding the idea that minor wave 2 could be over because there is too much choppy sideways movement that breached base channels with declining volume for the middle of a third wave to have begun.
This wave count is identical to wave count #1 up to the high labelled minor wave 1. Thereafter, instead of minor wave 2 continuing it sees minor wave 2 as an incomplete expanded flat correction (or possibly a rare running flat, but that has an extremely low probability).
Within the expanded flat minute wave b is a 111% correction of minute wave a. For this flat I do not think minute wave c will exhibit a Fibonacci ratio to minute wave a. Minute wave c is not unfolding as an impulse because the waves subdivide as threes and not fives. Minute wave c may be unfolding as an ending contracting diagonal, which is a very common structure.
Minute wave c is extremely likely to move at least slightly below the end of minute wave a at 1,178.59 to avoid a truncation and a rare running flat.
The diagonal should remain contained within its trend lines, and these should provide strong support and resistance.
Pros:
1. Minute wave b looks like a clear three wave movement now on the daily chart.
2. An ending diagonal nicely explains the choppy overlapping movement of the last 13 days.
Minor wave 2 may not move below the start of minor wave 1 at 1,142.82.
If the bull wave count is correct then wave count 2 has a higher probability.
Ending diagonals require all sub waves to subdivide as zigzags. Minuette waves (i) and (ii) fit nicely as zigzags and look like threes on the hourly and daily charts.
Within a diagonal the third wave must move beyond the end of the first wave. The fourth wave must overlap back into first wave price territory. Thus diagonals are like triangles, but the difference is they have a slope where triangles are horizontal movements. The traditional technical equivalent is a wedge.
Minuette wave (iii) must move below the end of minuette wave (i) at 1,184.04 to meet that core Elliott wave rule for third waves. Minuette wave (iii) must be a zigzag.
So far within minuette wave (iii) the structure is incomplete. Subminuette wave a may be over, and subminuette wave c may be unfolding as an impulse. Within subminuette wave c micro wave 3 should now be beginning. It must move below the end of micro wave 1 at 1,184.45.
At 1,176 subminuette wave c would reach 1.618 the length of subminuette wave a.
When minuette wave (iii) has a complete corrective count (a corrective count is a wave with 3, 7, 11… and any further multiple of 4) then minuette wave (iv) should move upwards back into minuette wave (i) price territory. Minuette wave (iv) may not move beyond the end of minuette wave (ii) above 1,209.30.
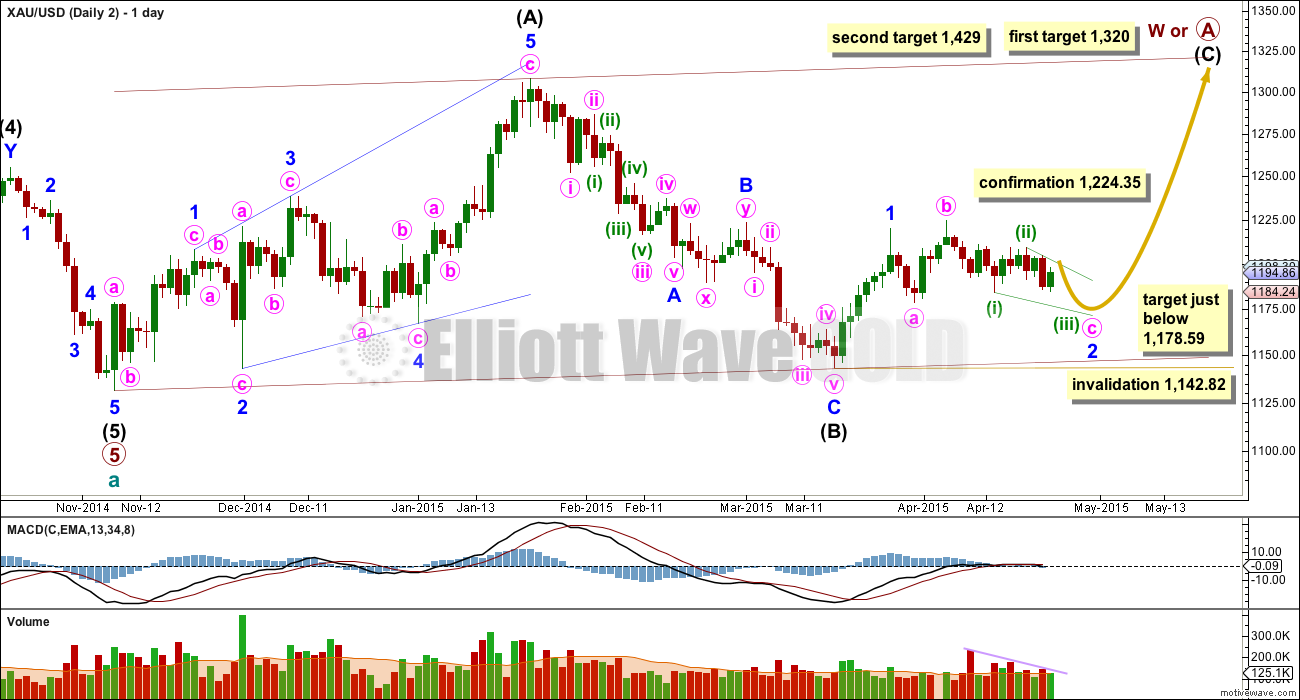
Wave Count #3
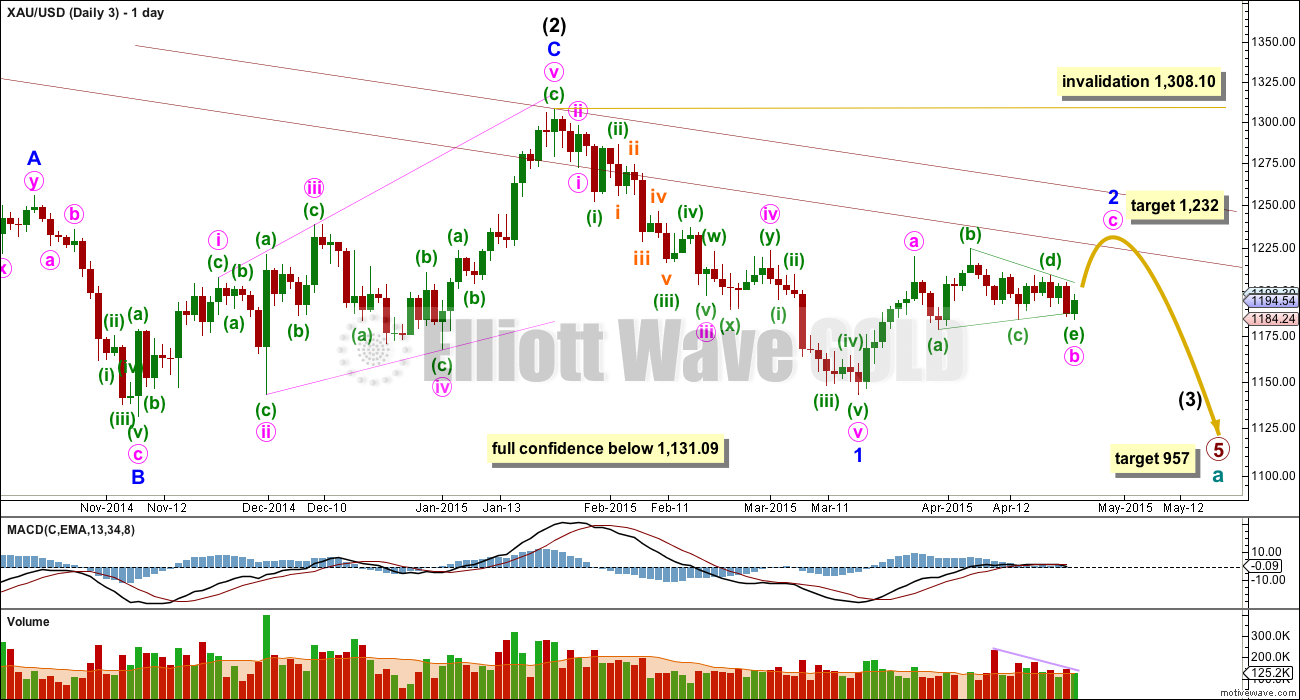
This wave count follows the bear weekly count which sees primary wave 5 within cycle wave a as incomplete. At 957 primary wave 5 would reach equality in length with primary wave 1.
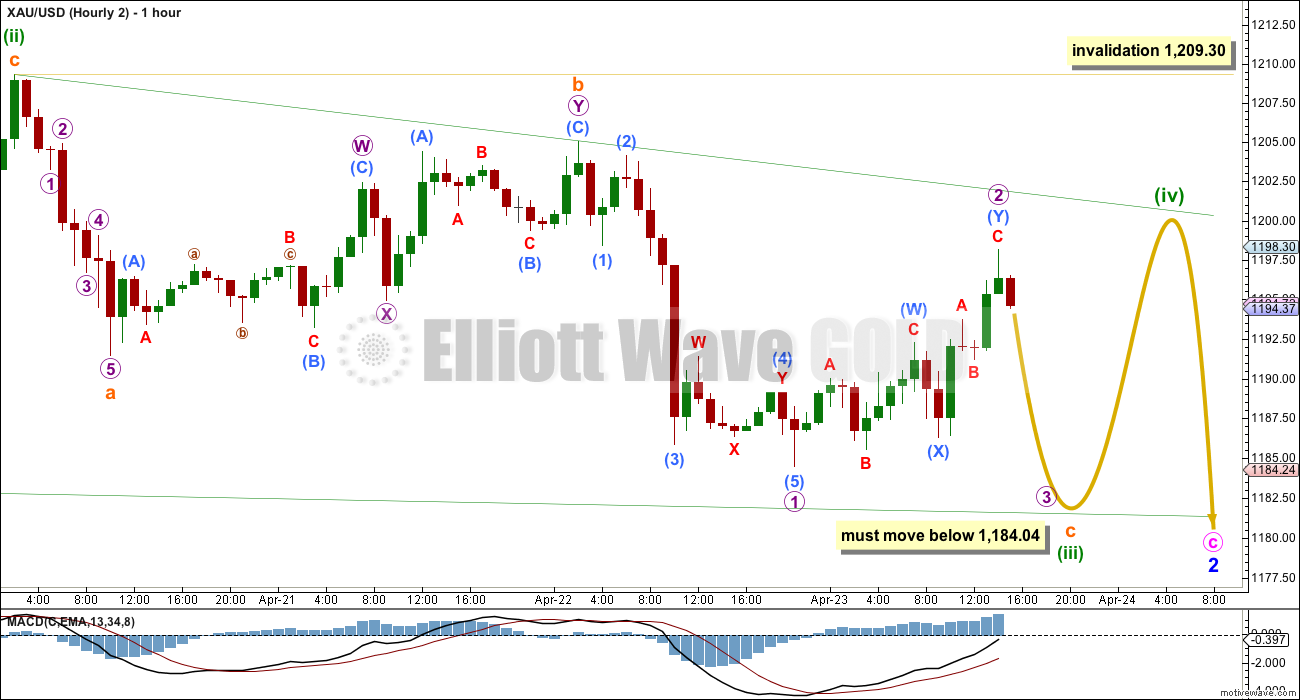
This wave count sees minor wave 2 as an incomplete zigzag, and within it minute wave b now a complete running contracting triangle. The final wave of the triangle, minuette wave (e), has overshot the (a)-(c) trend line.
Minor wave 2 should end with a small wave up for minute wave c. It should find strong resistance at the upper edge of the maroon channel copied over here from the weekly chart. If this maroon trend line is breached again by a full daily candlestick above it and not touching the maroon trend line then this bear wave would substantially reduce in probability to a very unlikely alternate, but I will retain it until price proves it wrong. I have created a parallel copy of the maroon trend line and pushed it up to sit on the high of intermediate wave (2). It is possible that minor wave 2 could find resistance at this line.
At 1,232 minute wave c would reach 0.618 the length of minute wave a. This target expects an overshoot of the maroon trend line. If the target is wrong it would be too high. Minute wave c is extremely likely to make at least a slight new high above minute wave a at 1,219.99 to avoid a truncation.
Pros:
1. The upwards waves of minuette waves (b) and (d) do look like threes on the daily chart. A triangle nicely explains the sideways chop of the last 20 days.
2. MACD supports the idea of a triangle unfolding as it is hovering at the zero line on the daily chart.
3. Volume supports the idea of a triangle (a typical consolidation phase normally sees declining volume towards its end).
Cons:
1. Minor wave 2 would be much longer in duration than a minor degree second wave normally is for gold.
Minor wave 2 may not move beyond the start of minor wave 1 above 1,308.10.
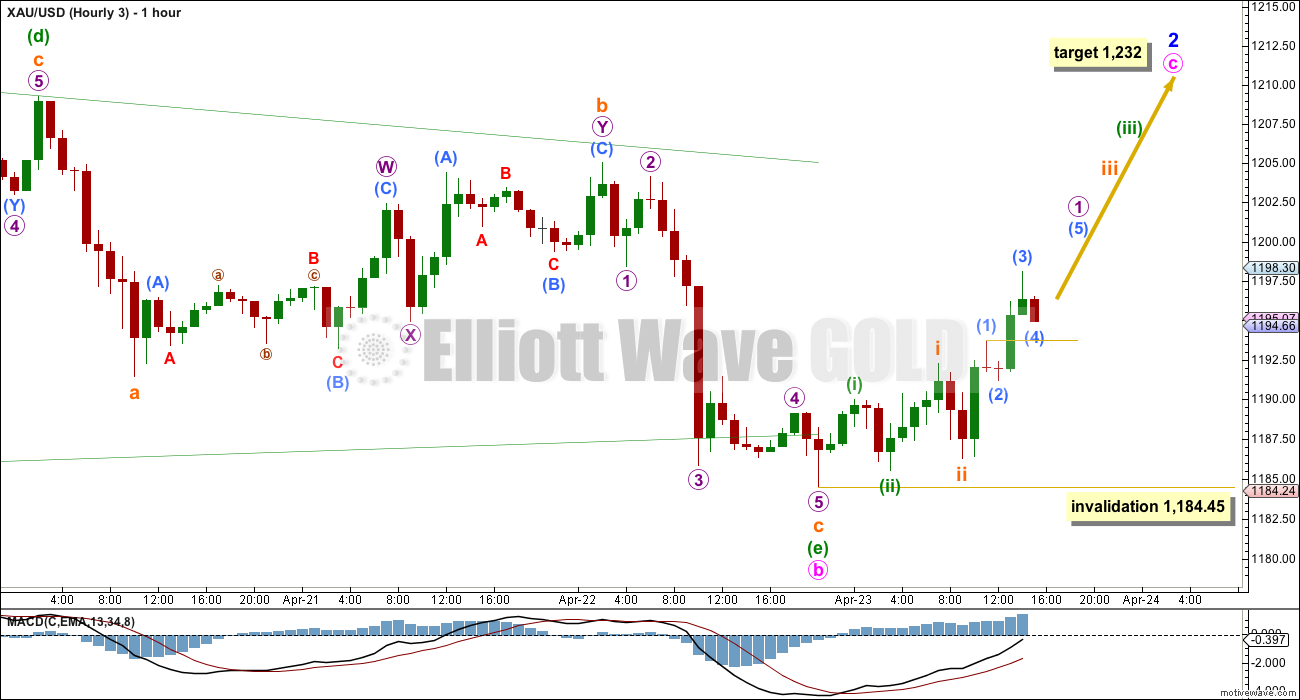
The final wave of the triangle is now complete.
Minute wave c up must subdivide as a five wave structure, most likely an impulse. Within it no second wave correction may move beyond the start of its first wave below 1,184.45. This invalidation point allows for the possibility that my degree of labelling within minute wave c is wrong, that minuette wave (i) within it is incomplete.
Wave Count #4
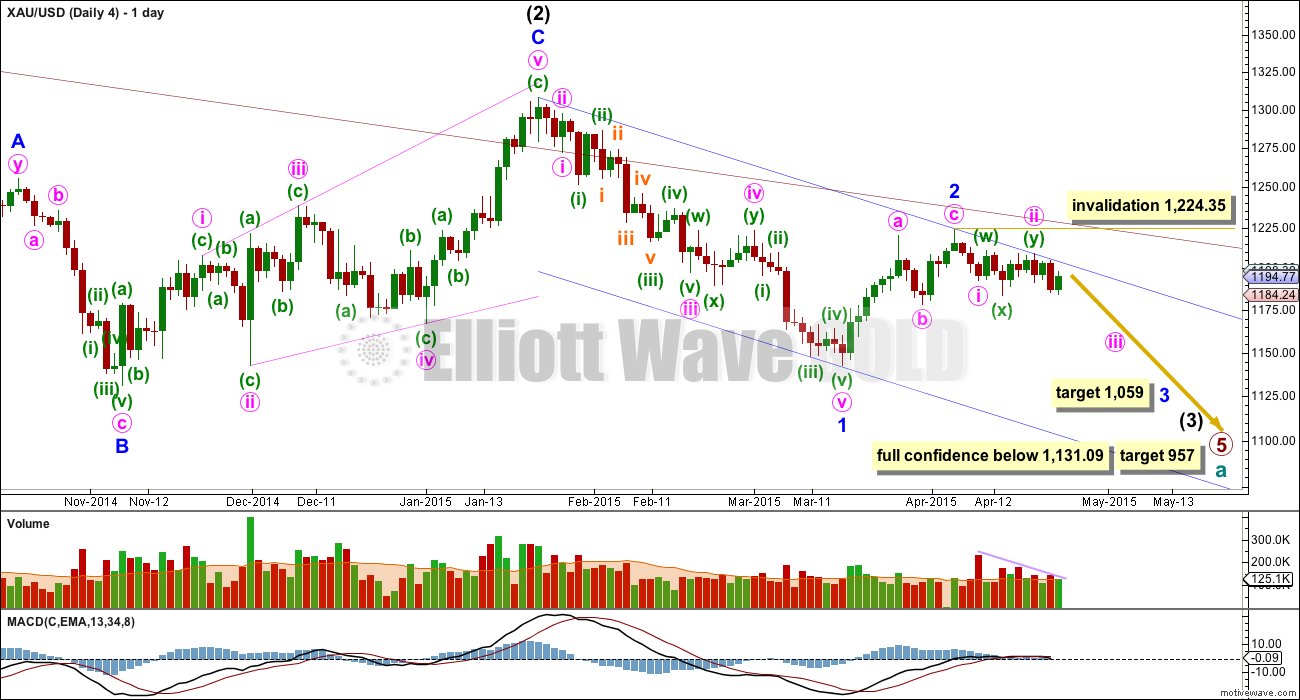
This wave count is identical to wave count 3 up to the low labelled minor wave 1. Thereafter, it still sees minor wave 2 as a completed zigzag, and minor wave 3 in its very early stages.
Minute wave ii is seen as a completed double combination.
Pros:
1. The proportion of minute wave ii looks right.
2. Upwards movement continues to find resistance at the upper edge of the blue base channel drawn about minor waves 1 and 2.
3. It is very common for a third wave to begin with a series of overlapping first and second waves.
4. Up days have lower volume than down days; if the trend is down this is exactly how volume should behave.
Cons:
1. Minute wave c on the daily chart looks like a three wave structure, but on the hourly chart it does subdivide very nicely as a five. This is only a small detraction.
2. Volume for Wednesday’s session is higher than prior up days, but still not a strong spike. Downwards breakouts do not necessarily have to be associated with volume spikes as the market may fall of its own weight. A volume spike would increase probability of this wave count, but its absence is only a small detraction.
At 1,059 minor wave 3 would reach equality in length with minor wave 1.
Minute wave ii may not move beyond the start of minute wave i. This invalidation point on the daily chart allows for the possibility that minute wave ii may continue sideways and higher as a flat correction. However, because that would now need a breach of the blue base channel this possibility is highly unlikely.
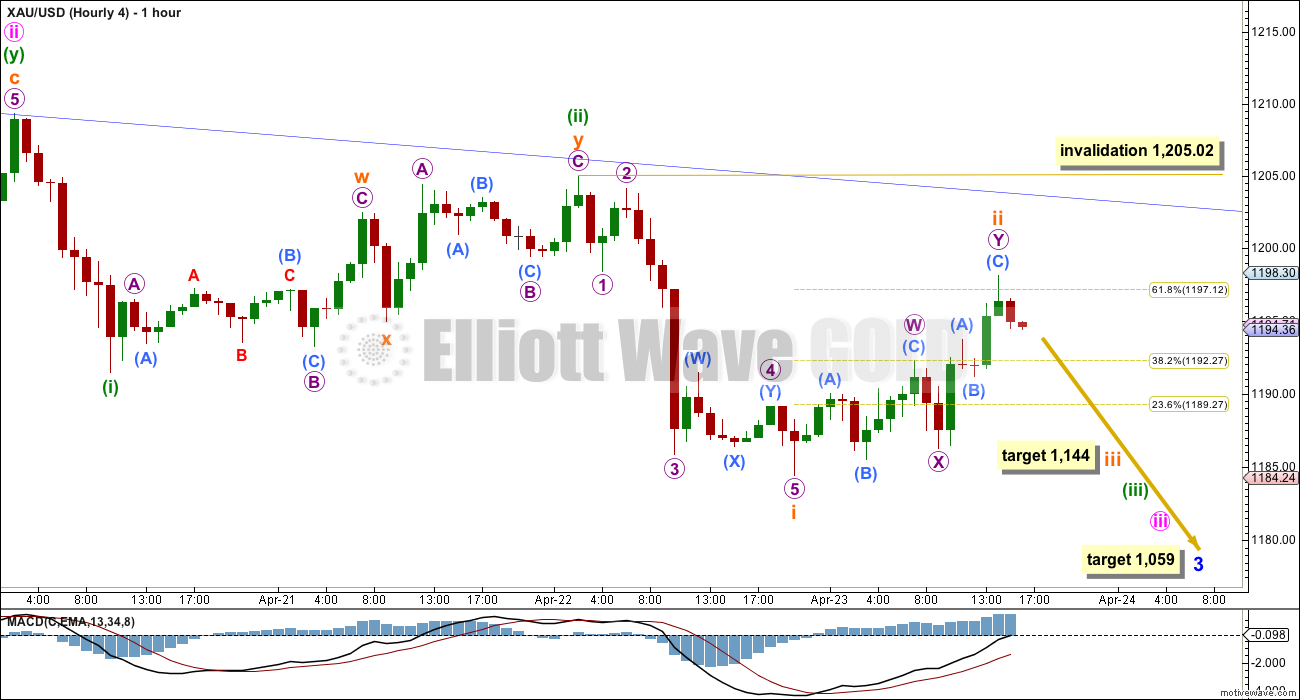
If wave count 4 is correct then it should show itself in the next 24 hours. The middle of a third wave down should show a strong increase in downwards momentum. At 1,144 subminuette wave iii would reach 2.618 the length of subminuette wave i.
If subminuette wave ii is not over and moves higher as a flat or rare triple zigzag then it may not move beyond the start of subminuette wave i above 1,205.02.
If subminuette wave ii does continue it is very likely to again find resistance at the upper edge of the blue base channel. Keep copying this channel over to hourly charts.
This analysis is published about 04:36 p.m. EST.
Judging from what I see, direction is ultimately inconclusive…GLD and GDX are below 50- sma, yet copper is positive and silver is holding up better than gold. The equities, SPX, are threatening to make new all time highs and the VIXs (except for the Russell 2000) are down, yet it appears that the bonds, TLT, has come back near its 50 sma and financials, FAS, are down just a little today…too much indecision, I will wait for direction next week. Have a great weekend! Thanks, Lara.
Some COT analysis updated with today’s report.
A break below 1,184.04 eliminates two wave counts. I now have only two left. I will label them “bull” and “bear”. The bull wave count (#2 yesterday) still needs more downwards movement in the short term. The target of just below 1,178.59 is inadequate. I’m now calculating a target of 1,157 where minute wave c will equal 1.618 the length of minute wave a.
The hourly chart for the bull count sees this now entering a sideways consolidation for a fourth wave which should not move back into wave one price territory above 1,184.45. After that fourth wave is done then minuette wave (iii) within this ending diagonal would be over. The diagonal looks like it will be expanding, not contracting.
When minuette wave (iii) of the diagonal is over then minuette wave (iv) must move back up into minuette wave (i) price territory above 1,184.04.
The bear count (#4 yesterday) sees Gold still in the early stages of a third wave. The middle just cannot be over yet, it needs to be longer than this. The consolidation phase just entered should be more brief, Gold should continue to build downwards momentum from here. The short term invalidation point for the bear count will be higher at 1,198.13 because I expect only another first wave is completing, not the middle of the third wave. The target is still at 1,144. This consolidation should be unlikely to show up on the daily chart for the bear count, but likely to show up for the bull count.
I’m off to write that up now.
Lara, where are we in the 5 min / hrly chart on wave count #4? with micro counts. Trying to figure out if we are in chart #2 or #4. Please help!
I will prefer wave count No 2
I’m going to see it as micro wave 1 within subminuette wave iii completing.
Within micro wave 1it’s in sub micro wave (4).
I would not want to label it in micro wave (4) because then subminuette wave iii would be just too close to completing, and I think it should move lower to 1,144 and take longer than one more day to get there… unless of course it’s about to do a strong extended fifth wave.
Which means it doesn’t matter at this stage how you label it, micro or sub micro, the target and length should be about the same and the number of waves to get there must still be about the same. It needs to have an impulsive count; 5, 9, 13… etc. (add multiples of 4 for each extension)
If wave count 2 is correct, and we are in minuette iv, does anyone have a calculation of when that is likely to end? (must go at least higher than 1184)
4 is correct, not 2.
that’s certainly possible, but I’m betting at the moment that 2 is more likely
what makes you say 4 is correct? can you elaborate? Do you -by any chance- have an current chart you would share?
Sorry, I am not familiar with adding charts. All I can say is that all of my other analysis tells me one thing and that is that gold must still go down substantially. Lara’s 4th count simply compliments that. There is no doubt in my mind that gold will go down to 1000 or below.
Gold should bounce back to the mid 1180 range, but not much further. I personally don’t believe that gold will see 1200 again for many months.
Little Revised Target for gold 1159 in Bullish Bat pattern.
Waseem was it you who posted a chart using Marketscope 2.0 a while back? I have this image loaded in my browser but lost the reference to the original poster
https://a.disquscdn.com/uploads/mediaembed/images/1969/4313/original.jpg
yes
liked the concept. Do you have an updated version to share showing whether price is conforming to this pattern or not?
i will analyze after market close.. But i think it can go to 1159.. then we will get buy signal…
Today it can go to 1172..
It can go to 1172 today and then it can testback 1184
There is a price divergence between the RSI indicator and Wave movement. No guarantees, but its a bullish regular divergence which indicates movement down should be finished and a movement up should be in the works sooner than later.
So far, the miners appear to believe wave count #2.
Also of note, NEM is now up 6.5% today, on top of the 3% gain they had yesterday.
wow. very different from GG.
Dear Lara and Tham Kwok Liang,
what you think about this wavecount?
The movement is very similar to Lara’s #4. The predicted path follows Intermediate 3, very similar to my calculations.
yeah but this count sees another top like laras count number 3 befor hunting down which is now invalid in Lara’s counting? this count has no problem with breaking 1184 before attacking for 1220er to go a bit higher if im right? im no elliottwave expert. i thought maybe it has something to do with Laras bigger picture. if im right this count sees the whole movement as an abc correction since 2011 in a bigger bulltrend which will continue after we are done with this correction.
Hi Tham, you’ve been quiet, any thoughts on today’s movement?
Sorry, Ram. I was out of town. Don’t have good Internet connection to read posts. Will be back early May.
It really does not make sense to see this huge downwards movement as W-X-Y for Gold. In this wave count W is not a clear three. It subdivides as a five so nicely. So why not 1-2-3?
Apart from that it expects the same movement next as my weekly bear count.
I think it’s all about wave count 2. Mainly because market needs to wait for Fed decision next week. Also check out USD. Not exactly breaking out to the upside
Miners (GDX) seem reluctant to follow gold down ?
The main daily bullish wave is incalidated. Gold is going to 956.
Bravo Lara!!! You are the only one calling this move.
Papudi, are you certain that we are going down? Is wave 2 still in play, or are you confident that it is a much lower possibility?
Wave #4 is still alive and kicking.
One way to distinguish between them is to watch the next drop after the small rebound (to around 1189/1190). If price stalls at 1176, then #4 is more likely. Anyways, #2 is invalidated only below 1142.82.
Tham, can you expand on why you think it is more likely? For #2 we are at end of minuette iii so I understand upward correction for minuette 4 on the way, but for # 4 — not sure how long the littler waves within subminuette iii should be.
>> Lara, can U help us out here??
At the moment, both have an equal chance. #2 cannot go beyond 1142.82. #4 does.
I am looking at the near term. #2 is likely to stall at 1176 for minuette 3 wave as it is the 1.618 retrace. Unless the retrace is greater, it is unlikely that minuette 3 can drop further.
#4 on the other hand will have a third wave, micro 3, following the rebound. That would easily take it past 1176.
Thank u Tham. Please keep us updated on your outlook.
You’re welcome. This is my current outlook.
It appears that price has now entered a consolidation sideways phase. So, it is more likely to be micro 4 of sm c. This kind of movement can be rather lengthy compared to the previous wave. If I am correct, then there will be a wee drop to 1176 for #2 to end sm c / minuette 3. Lara said minuette 4 should move back into minuette 1 price territory. I will be entering a very small trade in NUGT for that, and then short it with DUST for 1172.26. If it drops further, it will be #4 and a very welcome bonus indeed (much more gains!).
I thought 4th waves can not move into 1st waves price territory. Was Lara’s statement in her video?
No, in the text above.
Oh, sorry. I was looking at #4. She hasn’t been very detailed on that onse seeing as it has been her preferred. I’m becoming a believer in #2 as time passes.
Yes. That’s exactly what I’ll be doing with today’s analysis.
Now the ?? is gold will follow wave #2 or #4????
Right, I’m watching.
I’m wondering how far “just below 1178.59” Lara means for #2 target. Any idea?
It depends on which point you mean. Minuette 3 targets 1176, 1.618 retrace of sm a. I have Minor 2 / minute c target at 1172.26, the 0.618 retrace of Minor 1. This assumes 1176.58 is the low so far.
Oh yes, thank u
Good morning.
wave #1 and #3 are invalidated.
1189 may now be resistance
ya, seems to have stalled. looks more like we are hammering out a base
Not a lot of momentum downwards so far as price moves slowly lower. What does this all mean? I’m thinking wave count #4 is not panning out and wave count #2 with falling wedge looks best. It’s early, but I’m confident we’ll have a much better idea before trading ends today.
Good call. Thanks for sharing.
A week ago I thought the gold chart was setting up similar to early 2014 with a bullish flag at support. The structure and momentum has fallen apart and resistance appears to now be in control.
Curious, Do you have a public charts list on stock charts?
I used to and I removed it. I now just maintain the notes for myself but don’t post publicly except for here.
They seemed familiar which is why I asked.
SENTIMENT: Tricky trade today. Gold price is bearish whilst upside remains curtailed under 1198/99. It is just a question of if gold price can break below 1187 for projected downside target 1178…. With the lower band at 1184/83, a drop below here though won’t stay down too long…. ADX remains weak for the downside; can expect choppy price movement. A bullish key reversal, decreasing volume, bullish momentum and ROC seem indicate of an upturn / rally. Upside move is expecting. It will then remain to be seen if the upside move can take out 1201-02 for possible 1205+….
And Downward she goes. I surmise that means count #2 or #4. I’m so happy. But I don’t know why,,, my DUST entry didn’t trigger during after hours by .03. Darn it– I have to get up EARLY tomorrow.
Happy Trading all.
Gold options sweet spot is 1200 at the close for this Monday. I am expecting sideways choppy movement until then. I will be surprised if anything breaks one way or another in the meantime. Then Fed meeting next Wednesday also….I am thinking this will be more hurry up and wait until that fib 21 day mark that Lara has been talking about.
Expecting a dollar bounce tomorrow. Quite the bullish consolidation in an uptrend.
Today’s GDX back test of broken channel was textbook. I almost executed perfectly but sold my longs 20 cents too soon and started scaling into DUST just a wee bit too soon but pretty happy with the execution overall. I really didn’t think GDX would manage to make a full back test….gold just seemed so weak today on news that should have launched it this morning if there was going to be a launch. Lots of bearish warning signs on all charts now.
GDX chart
What used to be a simplistically bullish projection has now morphed into a simplistically bearish chart.
Like PM sector uranium has been in bear trend longest. Now many Uranium stocks show trend change with heavy volume.
Lara a quick look at uranium price EW will help. I am planning to get on micro uranium stocks.
Thanks.
There’s nothing quick about a new wave count with Elliott wave theory.
NEM us up 3%+ afterhours after beating earnings.