
A new low below 1,184.04 has invalidated two Elliott wave counts, leaving now only two valid Elliott wave counts.
Summary: Gold is breaking out to the downside. Only wave counts 2 and 4 remain, which I will now label bull and bear respectively. A short term target for the bull count is 1,158 (after some sideways consolidation) and the bear count to 1,144. Both wave counts expect downward movement, but the pathway down is different. The bull count expects it to be choppy and overlapping, and the bear count expects it to be a very strong clear downwards trend.
Click on charts to enlarge.
To see weekly charts for bull and bear wave counts go here.
Bull Wave Count
The bull wave count sees primary wave 5 and so cycle wave a a complete five wave impulse on the weekly chart. At the weekly chart level this has a good look.
The problem with the bull wave count is within the subdivisions of intermediate wave (5). I have not found a solution which avoids running flats and has good proportion between the second and fourth waves of the impulse. The bear wave count has a better fit for this movement.
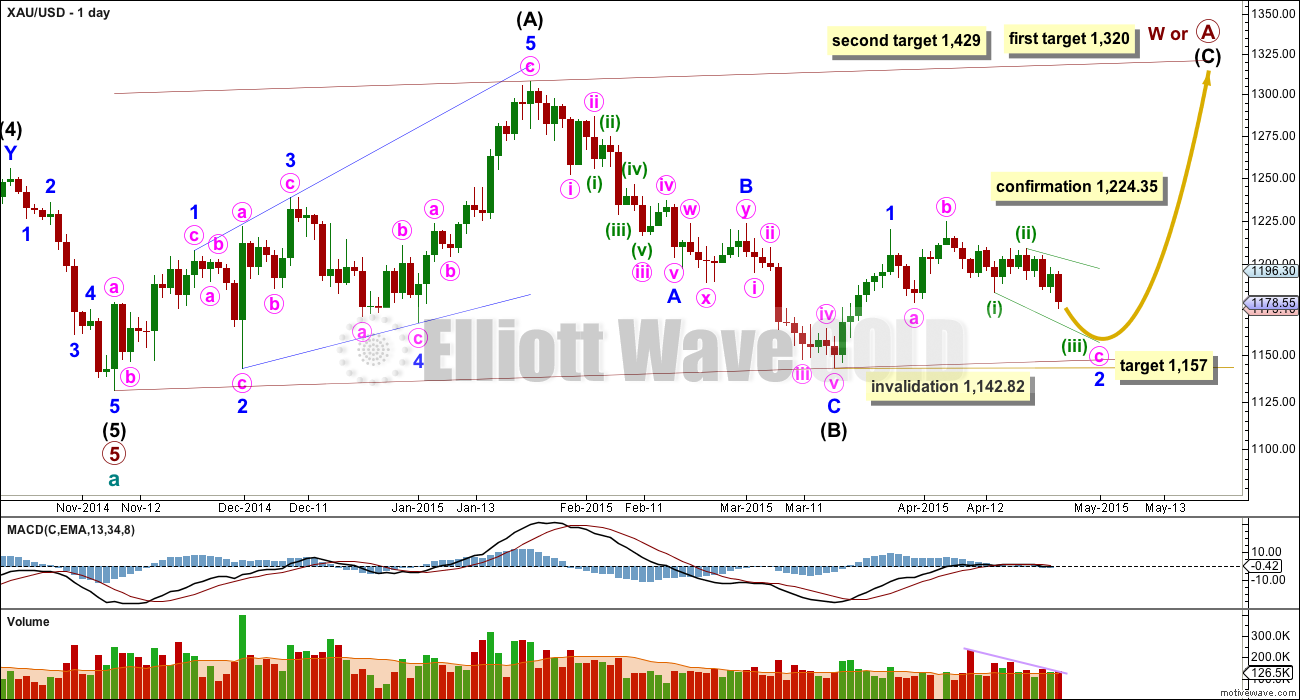
So far within cycle wave b there is a 5-3 and an incomplete 5 up. This may be intermediate waves (A)-(B)-(C) for a zigzag for primary wave A, or may also be intermediate waves (1)-(2)-(3) for an impulse for primary wave A. Within cycle wave b primary wave A may be either a three or a five wave structure.
Intermediate wave (A) subdivides only as a five. I cannot see a solution where this movement subdivides as a three and meets all Elliott wave rules. This means that intermediate wave (B) may not move beyond the start of intermediate wave (A) below 1,131.09. Intermediate wave (B) is a complete zigzag. Because intermediate wave (A) was a leading diagonal it is likely that intermediate wave (C) will subdivide as an impulse to exhibit structural alternation. If this intermediate wave up is intermediate wave (3) it may only subdivide as an impulse.
At 1,320 intermediate wave (C) would reach equality in length with intermediate wave (A), and would probably end at the upper edge of the maroon channel. At 1,429 intermediate wave (C) or (3) would reach 1.618 the length of intermediate wave (A) or (1). If this target is met it would most likely be by a third wave and primary wave A would most likely be subdividing as a five wave impulse.
Within the intermediate degree five up minor wave 1 is complete. Minor wave 2 is unfolding as an expanded flat correction, which are very common structures. Minute wave c has made a new low below the end of minute wave a at 1,178.58 avoiding a truncation and a rare running flat.
Within the expanded flat minute wave b is a 111% correction of minute wave a. Minute wave c is not unfolding as an impulse because the waves subdivide as threes and not fives. Minute wave c may be unfolding as an ending expanding diagonal.
Within ending diagonals all the sub waves must subdivide as zigzags, and the fourth wave must overlap first wave price territory. The diagonal should remain contained within its trend lines, and these should provide strong support and resistance.
The third wave of the diagonal must have a corrective wave count of 3, 7, 11 (etc. add further multiples of 4 for each extension). So far on the daily and hourly charts it has a count of 5. Minuette wave (iii) is incomplete.
An ending diagonal nicely explains the choppy overlapping movement of the last several days.
Minor wave 2 may not move below the start of minor wave 1 at 1,142.82.
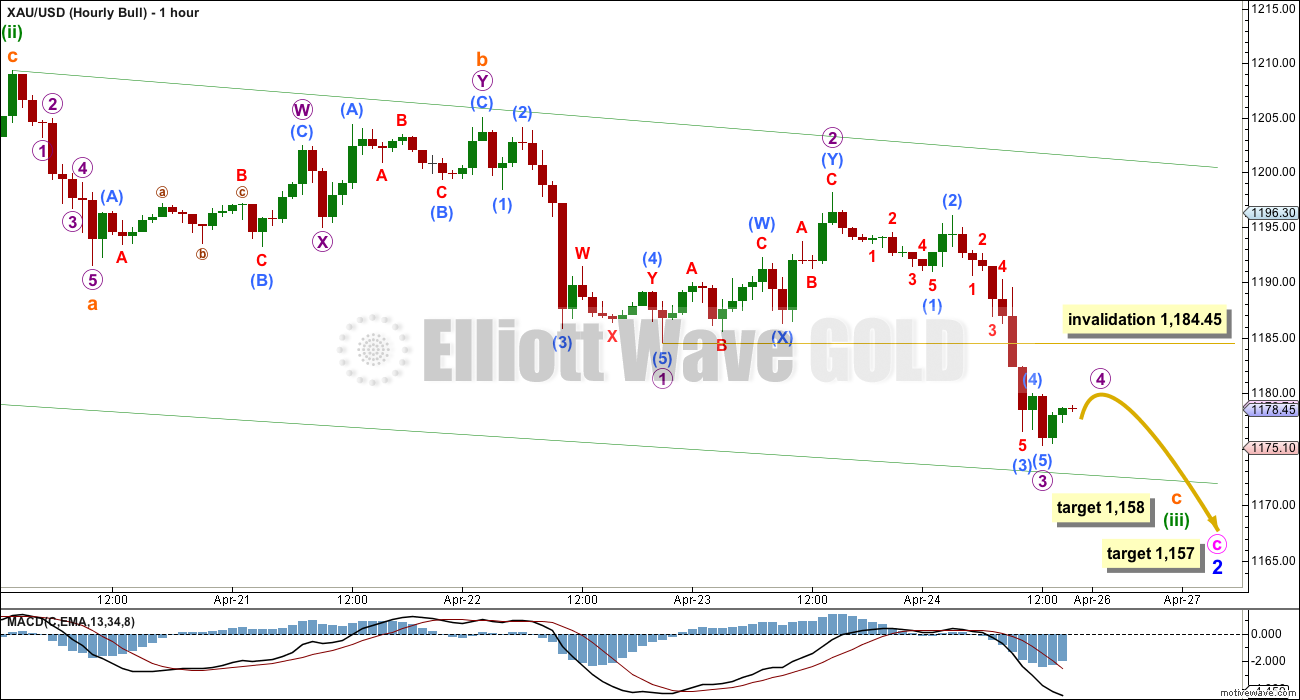
The hourly chart shows all of minuette wave (iii) so far, which does not have a corrective wave count and must be incomplete. It must subdivide as a zigzag because it is a third wave within an ending diagonal.
At 1,158 subminuette wave c would reach 2.618 the length of subminuette wave i.
Within subminuette wave c micro waves 1, 2 and 3 may be complete. If this is correct then the sideways movement that is beginning at the end of Friday’s session is likely to continue on Monday so that it shows up on the daily chart so that minuette wave (iii) looks like a zigzag on the daily chart. Micro wave 4 may not move into micro wave 1 price territory above 1,184.45.
Micro wave 2 was a deep 0.67 double zigzag. Micro wave 4 should show alternation, and may be a sideways type of structure like a flat, combination or triangle. It should be shallow, most likely ending only about the 0.236 Fibonacci ratio at 1,181.
When micro wave 4 is complete then micro wave 5 down would end minuette wave (iii). It is at this point the bull and bear wave counts will substantially diverge again. This bull wave count would then need minuette wave (iv) within the diagonal to move back up into minuette wave (i) price territory as a zigzag, above 1,184.04 but not above the end of minuette wave (ii) at 1,209.30. The bear wave count would expect price to remain well below these points.
Bear Wave Count
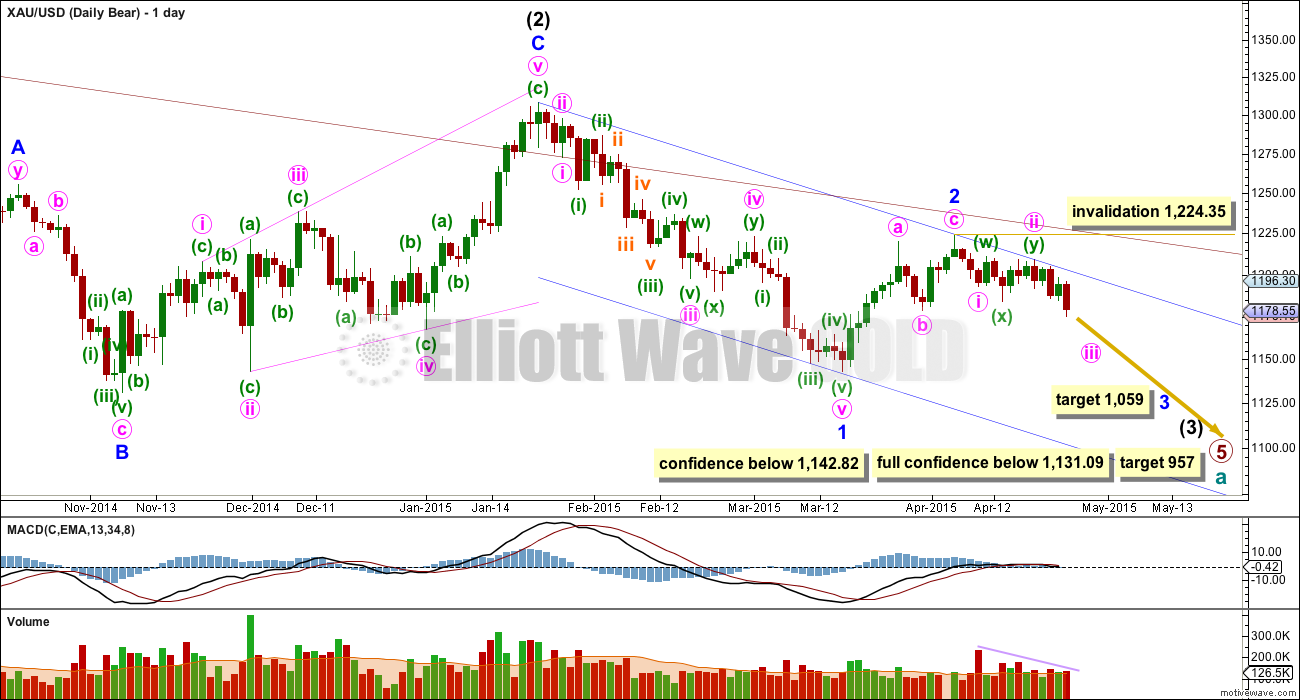
This wave count follows the bear weekly count which sees primary wave 5 within cycle wave a as incomplete. At 957 primary wave 5 would reach equality in length with primary wave 1.
Within primary wave 5 intermediate wave (1) subdivides perfectly as an impulse, and intermediate wave (2) subdivides perfectly as an expanded flat correction. Intermediate wave (3) should have begun.
The problem with the bear wave count is twofold. The channel about cycle wave a (upper maroon trend line, copied over from the weekly chart) is clearly breached. If cycle wave a is incomplete this trend line should not be breached.
The second problem is the duration and size of intermediate wave (2). Although all the subdivisions are perfect it looks too big at the weekly chart level.
This wave count sees minor wave 2 as a completed zigzag, and minor wave 3 in its very early stages.
Minute wave ii is seen as a completed double combination and its proportion looks about right.
Upwards movement continues to find resistance at the upper edge of the blue base channel drawn about minor waves 1 and 2.
The middle of the third wave has not yet passed. This wave count expects to see a strong increase in downwards momentum at the daily chart level, beyond that seen for minor wave 1.
At 1,059 minor wave 3 would reach equality in length with minor wave 1.
Minute wave ii may not move beyond the start of minute wave i. This invalidation point on the daily chart allows for the possibility that minute wave ii may continue sideways and higher as a flat correction. However, because that would now need a breach of the blue base channel this possibility is highly unlikely.
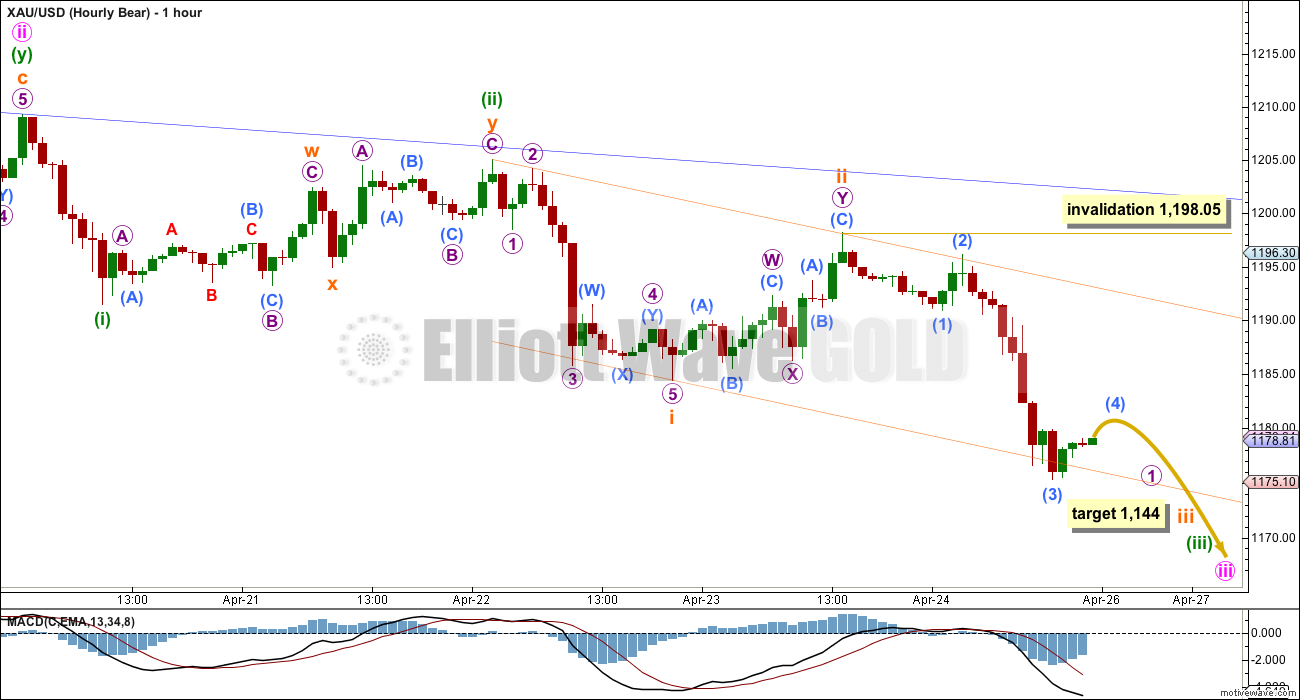
Minor wave 3 may have begun with a series of overlapping first and second waves, and so far there are three of them: minute waves i and ii, minuette waves (i) and (ii), and subminuette waves i and ii.
I expect we may be seeing another first and second wave complete; I would not label the low at 1,175.28 for Friday the end of subminuette wave iii, because it is far too short.
Within subminuette wave iii it may be that now micro wave 1 is almost complete. Micro wave 2, when it arrives, may not show up on the daily chart, should be shallow and brief due to the strong downward pull of the middle of a third wave at four degrees, and may not move beyond the start of micro wave 1 above 1,198.05.
At 1,144 subminuette wave iii would reach 2.618 the length of subminuette wave i.
I am drawing a base channel about subminuette waves i and ii. Subminuette wave iii should have the power to break below support at the lower edge of this orange channel. Along the way down upwards corrections should now find resistance at the upper edge of this channel.
This analysis is published about 04:47 p.m. EST.
Mark F , you know I don’t want to come across as being mean or something but I want to let you know that I totally discount anything you say and your charts give me no faith whatsoever . I know how to do standard TA and I have enough experience to know that it is 50/50 AT BEST . And you personally are currently running at 0% correct . First you were very bearish while market was running up from March low . Then you were bullish while we were chopping down . Then you became bearish around Thursday/Friday which was a fake-out to downside . Then you say you bought DUST over the weekend . Well , good luck with that trade , sorry .
Like I posted earlier, today was all about the close for me and my GDX-related trades. GDX just needed to trade below 19.89 for resistance to be in control. We were left with a bearish candle and resistance is in control. Meanwhile JDST and DUST charts still really look good. Tomorrow will probably close at GDX support around 19.50 ahead of the action of Wed which will finally resolve everything. Today and tomorrow are just noise but I’m still in the bearish camp.
JDST
DUST – check out that bottoming volume today!
so all 4 counts are incorrect??
is that it??
No. The Daily wave counts are still valid for Bull and Bear, however both Hourly wave counts were invalidated today above 1184.45 and 1198.05.
I bought DUST at the close as Lara’s expecting both wave counts to drop to 1,172 or below.
Looking at candlesticks chart pattern in hourly chart gold has bearish engulfing and on daily chart bullish engulfing.
With Lara’s wave count it appears tomorrow will be a big red candle down????? The green candle will be sandwitch between two red candles.
The bullish engulfing candlestick pattern should be ignored because it’s still within a consolidation. A bullish engulfing candlestick pattern should only be taken as a bullish signal after a clear downtrend, not when it turns up within a sideways move.
For the bear count I can see a leading diagonal for a first wave complete, followed by a very deep second wave correction.
The invalidation point is really close by at 1,209.30.
If the bear count is to remain viable and for me to have any confidence in it price must move strongly lower from here. If that doesn’t happen in the next 24-48 hours I will have to relegate that count to a very low probability.
The bull count requires one final fifth wave down to complete minor wave 2 expanded flat to 1,172 or below. I have not yet seen a solution which sees the bull count ready to move up out of this consolidation phase. The invalidation point though is very close by at 1,210.88 for the bull count.
If price breaks above 1,120.88 then the probability that an upwards breakout is looming would increase. I have not yet found a solution which would see it do that in the short term, the only two solutions I can see require downwards movement from here to 1,172 or below.
I’m going to write that up now.
Lara means 1210.88 not 1120.88. above.
“If price breaks above 1,120.88 then the probability”
With an overshoot of the blue base channel for the bear wave count it is looking less likely.
The ending diagonal for the bull count still works, with the first and second wave moved higher. The diagonal would be expanding and still needs one last wave down.
I can see a solution for the bull wave count today which works, but I’m struggling right now to see a solution for the bear wave count.
Volume is higher today but it’s still not higher than prior down days of 16th, 13th and 8th April. Volume in this sideways chop is still higher for down days than today’s up day.
Gold is still within this consolidation phase. The breakout I had thought which was underway was a bear trap.
What is the target for the expanding diagonal on the downside?
1,172 minimum
Thanks. I am still on the bull side of the fence, wave count 2 has been my horse. I am sure we will have an answer by Wednesday afternoon.
I certainly hope so. This sideways chop has been a nightmare to analyse.
Lara, not sure from your replies below. Are you still favoring the bear count?
No. That blue channel is overshot. It’s still valid. I will look to see if there’s a diagonal in there, because that’s the only way that chop can fit. Leading diagonals are often followed by deep second wave corrections.
I took some time after replying to your comment to check 5 and 10 minute time frames. I’m seeing a diagonal structure complete at the last low. The key is the subdivisions of the first, third and fifth waves.
If any of those three are impulses and not zigzags then the diagonal can only be leading, that favours the bear wave count.
But if all of the first, third and fifth waves can be zigzags then the diagonal may be both leading or ending.
I think they actually look and fit better as impulses, so I will slightly favour the bear wave count overall. But only slightly.
Gold is still within a consolidation phase. The breakout has not yet arrived. Volume still indicates it’s more likely to be down than up, but that’s an indicator not a signal. Extreme caution is advised until price tells us which direction the breakout will be.
Analysis is being proofed now, will be published in a few minutes.
Lara wrote in bull hour wave count: “This bull wave count would then need minuette wave (iv) within the
diagonal to move back up into minuette wave (i) price territory as a
zigzag, above 1,184.04 but not above the end of minuette wave (ii) at
1,209.30.”
Gold made it to 1207.32 today. What will be tomorrow or end of the day????
Thinking along the same line at 1207 did gold complete wave Y of ZZ?
EURUSD bearish.
currently completing bearish gartley pattern
https://www.tradingview.com/chart/EURUSD/ui3ABQ0b-EURUSD-confluence-of-many-reasons-to-short-bearish-gartley/
a little off topic, but maybe relevant: EURUSD retrace after bat pattern
https://www.tradingview.com/chart/EURUSD/uwR3Q8dQ-EURUSD-it-s-all-very-logical-really/
Looking at Kimble Charting EURUSD correlation to where gold may go.
3/25/15
“Should the Euro rally, odds are decent that the metals complex (Gold,
Silver and Miners) could be a beneficiary. Stay tuned friends, this
could get interesting. Should the Euro rally, it would surprise a good
number of investors, as 89% of investors are bullish the US$ at this
time (record levels)!” http://blog.kimblechartingsolutions.com/2015/03/euro-time-for-the-crash-to-turn-into-a-rally/
An/yone here subsribe to Kimble’s weekly metals research?
Lara – With both your hourly counts invalidated. Where do you see gold heading to. I’m yet to see the 5 wave structure in the hourly chart. Do you see that yet?
I still cannot see a completed five down for minute wave c for the bull count.
I can move minuette (i) and (ii) higher, to see an ending diagonal, it still needs a fifth wave down to complete it.
GDX 19.89 is my guess for the close. That would frustrate many.
Arrgghh totally taken off guard by this up move, was not expecting such a huge rise basing off 1184…. Bullish only once 1216 is taken out; many hurdles before Gold price gets there; on the downside needs a break below 1202 to seek 1198-96 not looks like happening in a hurry… dang!
We are now over the blue trend channel line on the bear count.
Lara will redraw the blue bear channel. Daily not invalidated until 1224.35
I won’t redraw it, but it’s not breached on the daily chart. A small overshoot is acceptable, a breach is not.
Dear Lara and Tham Kwok Liang,
W-X-Y instead of 1-2-3 was not the reason why i asked you about this count.
i cant understand why we cant move back up to 1220 or a bit higher maybe 1230-1250 levels to make new lows after.
The count i posted would still allow this if im right? please correct me if im wrong.
im sure that both of your counts bull and bear are wrong and we at the same stage as some weeks ago when you said it is make or break time for a 3rd wave up or down. what we got was nothing of both.
at that time i also said that this is not what i see in COT’ s and we are in the same position now.
the COT’ s still clearly signals that we need another upmove to catch more long-speculators if there is any bearscenario in play. And i think it is cause the dynamic the structure the whole manner of manipulation from the last lows 1143 tells me that
so i just want to ask you again if there is no possible count for another move up followed by new lows below 1131? i really was depressed when your count number 3 got invalidated last session from the analysis before only cause of we tested 1175.
Lara will say we finished A-B-C expanded flat .
My question would be :
Why wasn’t low on Friday considered a serious possibility of end of the flat ? That should have been caught as a possibility and not after the fact .
Also I don’t give much credit to the idea that minor 2 has lasted too long although that has been consistently been a distraction .
i fear that she will say that too, thats cause i m asking again for a bearcount.
well, lets see what the next cot reports will show us.
i think the priceactoin today was just covering. longspeculators still in and got another buy signal. they will be slowed down again by manipulaiton over physical market in the rise. the big banks will build up shorts over futuremarket again between 1220 and 1250 i think. so we should see still weak priceaction realtivly to positionchange the next weeks.
well lets see what the next COT reports will tell us.
if she will switch to a bullish scenario only now with new highs above 1307 i fear she will be wrong again.
.
Well , I think if you are expecting 1250 maximum , this W-X-Y scenario can still work . Why not ?
Because both W and Y would be zigzags. Neither as a B wave within them which is 90% or more of the A wave. Which means it can’t be a combination. Which means it would be a double zigzag.
Double zigzags should slope against the trend, not move sideways. Their X waves should not move beyond the start of the first zigzag of W. It makes no sense.
k . Since I am now bullish , looks like there is no EW count to support the bullish stance ?
See my post above yours for reply
OK , but W-X-Y works , no ?
Hard to see expanded flat with no c wave that’s five down. That’s why it was never considered. There was never an impulse down developing from $1225.
that is right Mark, the current levels are 61.8% retracement of the previous correction that started at 1224.1 and ended at 1175.17
Almost all of it in one candle for gold.
Definitely at a GDX key pivot here.
After shaking the last strong bullish person on the Board (Mark F) gold and PM stocks took off this am (looks like some stops were run 1st). I can relate to all the frustration expressed here. I’m sticking with Avi Gilburt and expect a rally that will take GDX to 21.50 (I don’t have a subscription just public updates). Not sure what will happen after that.
I am positioned this way as well. Avi expects GDX to rise to between $23.50 and $25.25 or so. Then he is expecting new lows into the fall/winter.
Despite low probability expectations, this idea continues to explain sideways consolidation movement.
Forget it man , after today I am done with EW . My COT analysis showed we have at least few more weeks to rally but the EW counts convinced me we must be selling off . I am sticking to what I know from now on . It is IMPOSSIBLE to know what form a correction will take . Fridays are fake-outs too .
p.s. the 1215-1218 level should be hard to break through . If it does , opens door for much higher .
Venezuels swaps 1b usd gold with citibank…..
Bullish for gold. and reason why gold is above 1200
http://www.kitco.com/news/2015-04-27/Venezuela-Gold-Swap-Positive-For-The-Market-As-Price-Pushes-To-1200.html
This looks like wave 3 kickoff as volume is strong – minor 2 will be labeled as WXY on daily bull. This is only way I see it as of now.
I am not so certain about this being a bull wave. While volume is an important indicator, it can sometimes swell because of short covering…. like today. There is a lot of anxiety and anticipation before Weds 2pm EST, so expect big swings. I’m still working on an alternate bear count.
Of course there is always a bear count. Should reach 200 dma near $1210-$1215 either way.
Good call.
Very frustrating what happened to me. Was long and strong since friday with a ton of calls. Placed a stop loss this morning. Market came down at around 9:50 and took me out at the low of the day, then rocketed up without me. I know that can happen in small stocks, didn’t think it could happen in something like GLD. How can this be prevented? Any market veterans know how to deal with this? I can’t trade without stops
You can put your stop a little farther away, or beyond the next key point, but that affects your risk-reward calculations for entering the trade. Stop harvesting or demand/supply testing is common just before a significant move in the opposite direction. You can call it a false break, exploiting/harvesting the stops. or, in Wyckoff language, springs and upthrusts. The Wyckoff people attempt to enter the trade after the stops get harvested.
I am on tilt right now. This feeling is almost worse than losing money. It would have been one of the best trades of my career. I guess I should have known that was possible as I was personally around 50% of the open interest in that particular contract
I’m just devastated. Not fit to trade for a while now
You need to take a break until your emotions settle down. Then take a lesson from Reminiscences of a Stock market Operator and review the situation for what to do differently. The insiders (market makers at least) can view the book of where all the stops are. You gave them an invitation and they took it. They do not feel any guilt. There are other players in the market who can guess where the stops will be and gun for those levels to see what fruit might fall from the tree. That is an argument for not using standard stop locations.
dsprospering, fencepost – thank you both. It’s good to let it out and talk about it. I’m already feeling a little better. The only solution i think is to keep stop losses a little wider in this kind of situation. I can’t do the mental ones I wouldn’t pull the trigger enough.
FWIW, i don’t think there will be a big move now from here until fed decision anyway, so no reason to trade now. Actually that was one of the theses for the trade. I was sure the market would not break before wed, and so it should come back to some kind of equilibrium before then
🙂
US FOMC>just hope the big guys didn’t already plump the market so theres nothing left for the rest of us.
Very hard to say how the market will react on Wednesday. But based on a number of factors my guess at this moment is gold will break to the upside. But that could change we have to see how things develop until then
I started placing “triggers” in the brokerage software instead of placing a hard sell order (trail the price, T-stop). That’s the best I can do besides keeping the T-stop out of the computer itself — ahh, but then there’s the ‘can i trust myself to pull the trigger?’
I drink a lot of tea while price hovers my pull out area. And after.
Sorry you had this experience. I’ve had it too, and remember the devastation. Hot tea!
I’m off to a fresh walk. Not in the market for weeks now anticipating the volitility of FOMC. Been tough, but no losses feels good.
That reminds me of some advice from Jim Sinclair years ago. He said use a stop for a round lot or one contract. When it gets triggered, that will wake you up to attend to the rest of your position.
I’m not convinced yet of the bull. GDX is tagging resistance. We will see.
http://schrts.co/AUXegK
Agree, though frustrated…other commodities are down, bonds are down, equities up, though the vixs are up, too…might just be a short squeeze on futures expiration…don’t know for sure…
GDX has crossed the resistance line????
Yes. For me this will be about the close today.
Looks like bull wave has started atleast in indian market with wave 2 taking contracting triangle form.
A triangle is not an option in wave 2 of an impulse.
Hi am new to elliot wave, thought corrective wave can take any form.
Maybe I did not interpret correctly when you said “bull wave”. Wave 2 of a corrective move (that divides as 3 subwaves) can be a triangle. Wave 2 of an impulse move (that divides as 5 subwaves) cannot be a triangle. To make matters confusing, subwaves of a corrective wave can themselves be impulses (example is a zigzag which is 5-3-5.
Looks like the current bear count is invalidated now as well with a high over 1200.
Picked up some JDST at 8.79. Chart looks just as bullish as DUST…..
http://schrts.co/hFC0MC
added at 8.50
that what i think too Matt, 2nd wave right now
Gold may be in a 2nd wave correction to retrace the movement from 1196.30 – 1175.10. It could reach about 1188.20 (0.618) before collapsing again.
….although gold doesn’t have to get all the way up to 1188.20 considering that a strong 3rd wave down is imminent.
pmbull has current spot gold price as $15.87. LOL
Current Gold Spot Price:
$15.87 +0.13 +0.83%
With 1180/79 holding, upside limiting 1189/92; would require a break below 1175 to seek lower….
looks like both hourly wave counts will change as both appear to be invalidated
Just the hourly bull has been invalidated. From what I can see, the hourly bear looks just fine.
….although it is strangely large.
Just the hourly bull correct, but in the bear case this 4th wave is way out of proportion so both counts are going to change a lot IMO
There will be changes – that’s for sure. I am still a bear though. Bear daily is remaining within the blue channel, if I am not mistaken. It was a nasty correction, but I think it is (close to) over.
Never mind about the blue channel comment. I am wrong again today.
At what time gold options expire today?
Rambus public post. Bearish.
http://rambus1.com/?p=36375
On the bear count. What is the target for (5) =1 of iii?
Some updated GDX thoughts…..more evidence that breakout may be down.
Mark, it will be very appreciated if you would include the link each time you post a chart. we can see the chart without subscription. Thanks.
I’m 75/25% favoring the bull count due to it having right look so I’m thinking wave iii of ED bottoms $1173ish before wave iv hits $1191ish using simple key support/resistance. My gut tells me ED ends in the $1160’s not $1157.
Is gold in backwardation?? I notice futures are lower than spot.
SENTIMENT: On a weekly outlook basis, Gold price remains bearish, market trend is down, and price should continue to decline for a while perhaps in to the next cycle turn due around 3May15…. A market rise can be expected in between but see no reason yet to exit shorts…. Still a long way to go, but for the current, the bearish wave count is what I would pick to expect Gold price go lower than a downside target Lara has indicated being 0.786 retracement of 1224/1142 at about 1159…. With weekly H 1208.70 / L 1174.40 and monthly H 1224.30 / L 1174.40, don’t expect either of the highs to be reached or breached until the low/s is done!
DUST has been basing at fork support, forming a nice bullish flag, STO crossover and solid up volume today. Looks poised for a launch and thereby also supporting Bear Count. Lots of room to run to the upside. I’m holding all the DUST I bought yesterday over the weekend. Risk/reward still looks very attractive.
Mark, would you please include the chart link? Thanks.
I think the annotated version will only work if you have a stockcharts subscription.http://schrts.co/66IRqF
I can see annotated version without subscription.
Everybody , you just got confirmation to sell your DUST . Get out now ! LOL .
Based on Lara’s analysis calling for lower prices under either bull or bear scenario, it appears gold would lose fork support on my chart with a close any lower than today. In my view, that means at least a retest of the March lows which seems to favor the bear scenario.
It appears GDX doesn’t have support now until it fills the gap down below 19 and it could drop deeper for support.
Monday and Tuesday should be wild with gold options expiration, expecting lots of volatility. Should be an interesting few days next week for sure. Check out $DJUSPM, up 4% today.