
Upwards movement was unexpected and invalidated both hourly Elliott wave counts. At the daily chart level they both remain valid. I have a new Elliott wave count today.
Summary: The main bull and the bear wave counts both expect downwards movement. The new bullish alternate expects upwards movement. If we see a new high above 1,210.88 then a third wave up should be underway. If we see a new low below 1,175.28 a third wave down may be underway for the bear count, but that requires an increase in downwards momentum and preferably also an increase in volume for a strong down day. After checking subdivisions and structures at the hourly chart level, and despite the surprise of Monday’s upwards day, I will still judge the bear wave count to be slightly more likely than the bull count. However, Gold remains within a consolidation phase, the breakout has not yet arrived, and extreme caution is required until price tells us which wave count is correct.
I am away from home today and I do not have a good enough internet connection to upload video. The text analysis will be thorough, and I will say everything I need to say here.
Click on charts to enlarge.
To see weekly charts for bull and bear wave counts go here.
Main Bull Wave Count
The bull wave count sees primary wave 5 and so cycle wave a a complete five wave impulse on the weekly chart. At the weekly chart level this has a good look.
The problem with the bull wave count is within the subdivisions of intermediate wave (5). I have not found a solution which avoids running flats and has good proportion between the second and fourth waves of the impulse. The bear wave count has a better fit for this movement.
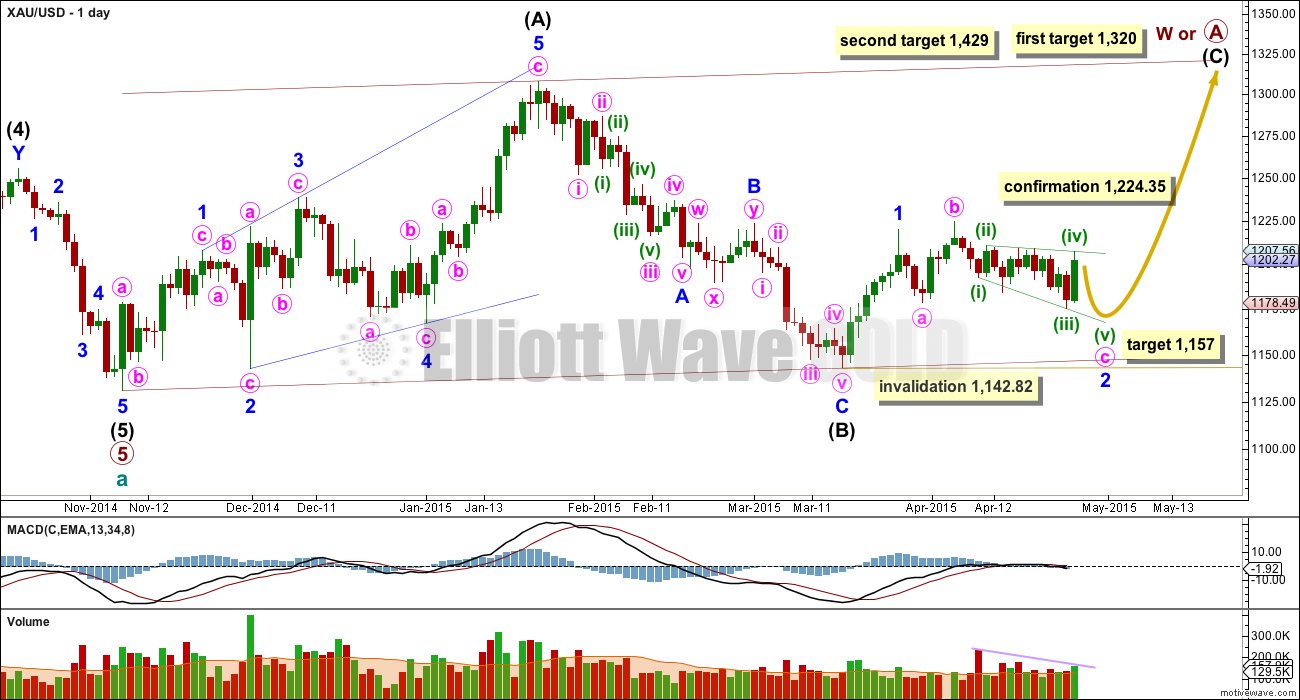
So far within cycle wave b there is a 5-3 and an incomplete 5 up. This may be intermediate waves (A)-(B)-(C) for a zigzag for primary wave A, or may also be intermediate waves (1)-(2)-(3) for an impulse for primary wave A. Within cycle wave b primary wave A may be either a three or a five wave structure.
Intermediate wave (A) subdivides only as a five. I cannot see a solution where this movement subdivides as a three and meets all Elliott wave rules. This means that intermediate wave (B) may not move beyond the start of intermediate wave (A) below 1,131.09. Intermediate wave (B) is a complete zigzag. Because intermediate wave (A) was a leading diagonal it is likely that intermediate wave (C) will subdivide as an impulse to exhibit structural alternation. If this intermediate wave up is intermediate wave (3) it may only subdivide as an impulse.
At 1,320 intermediate wave (C) would reach equality in length with intermediate wave (A), and would probably end at the upper edge of the maroon channel. At 1,429 intermediate wave (C) or (3) would reach 1.618 the length of intermediate wave (A) or (1). If this target is met it would most likely be by a third wave and primary wave A would most likely be subdividing as a five wave impulse.
Within the intermediate degree five up minor wave 1 is complete. Minor wave 2 is still unfolding as an expanded flat correction; these are very common structures. Minute wave c has made a new low below the end of minute wave a at 1,178.58 avoiding a truncation and a rare running flat.
Within the expanded flat minute wave b is a 111% correction of minute wave a. Minute wave c may be unfolding as an ending expanding diagonal. At 1,157 minute wave c would reach 1.618 the length of minute wave a.
Within ending diagonals all the sub waves must subdivide as zigzags, and the fourth wave must overlap first wave price territory. The diagonal should remain contained within its trend lines, and these should provide strong support and resistance. Overshoots are acceptable, breaches are not.
An ending diagonal still nicely explains the choppy overlapping movement of the last several days.
Minor wave 2 may not move below the start of minor wave 1 at 1,142.82.
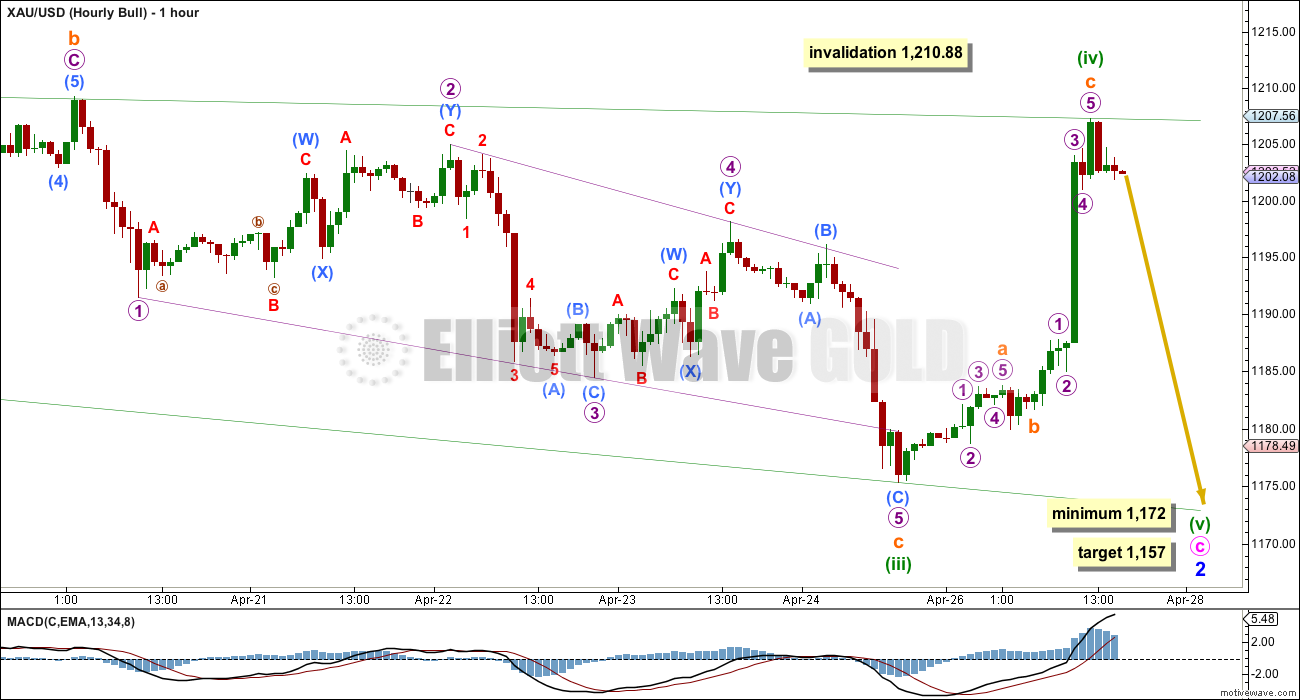
All hourly charts today show the movement since the high of 1,209.30.
For this main bull wave count minute wave c is an ending diagonal. Within the ending diagonal the third wave of minuette wave (iii) is complete. Minuette wave (iii) may only be a zigzag. Within this zigzag subminuette wave c subdivides on the hourly chart as an ending diagonal.
There is a problem with the ending diagonal structure though. The wave lengths all fit the rules for an expanding diagonal: the fifth wave is longer than the third, the third wave is longer than the first, and the fourth wave is longer than the second, but the problem is the trend lines contract instead of diverge. This gives the expanding diagonal a contracting look. It does not violate a rule, but it does not meet the guidelines of how this structure should look. This problem persists for all three wave counts at the hourly chart level and I cannot find a solution which avoids it.
Within diagonals the second and fourth waves are normally very deep, between 0.66 to 0.81 the first and second waves. For minute wave c minuette wave (ii) is 0.57 of minuette wave (i), and now minuette wave (iv) is 0.90 of minuette wave (ii). Neither of these corrections are within the normal length. However, at the daily chart level the expanding diagonal of minute wave c does have a reasonably normal look.
Because the diagonal is expanding minuette wave (v) should be longer than minuette wave (iii). This gives a minimum length to 1,172. The target at 1,157 would pass this minimum length.
Minuette wave (v) must subdivide as a zigzag for the ending diagonal. It may take a few days, and may be longer in duration than minuette wave (iii) which lasted 10 days.
Within a diagonal the fourth wave should overlap first wave price territory (it does). The rule for the fourth wave is it may not move beyond the end of the second wave. Minuette wave (iv) may not move above 1,210.88.
Alternate Bull Wave Count
I have tried to see a wave count which would allow for more upwards movement from this point.
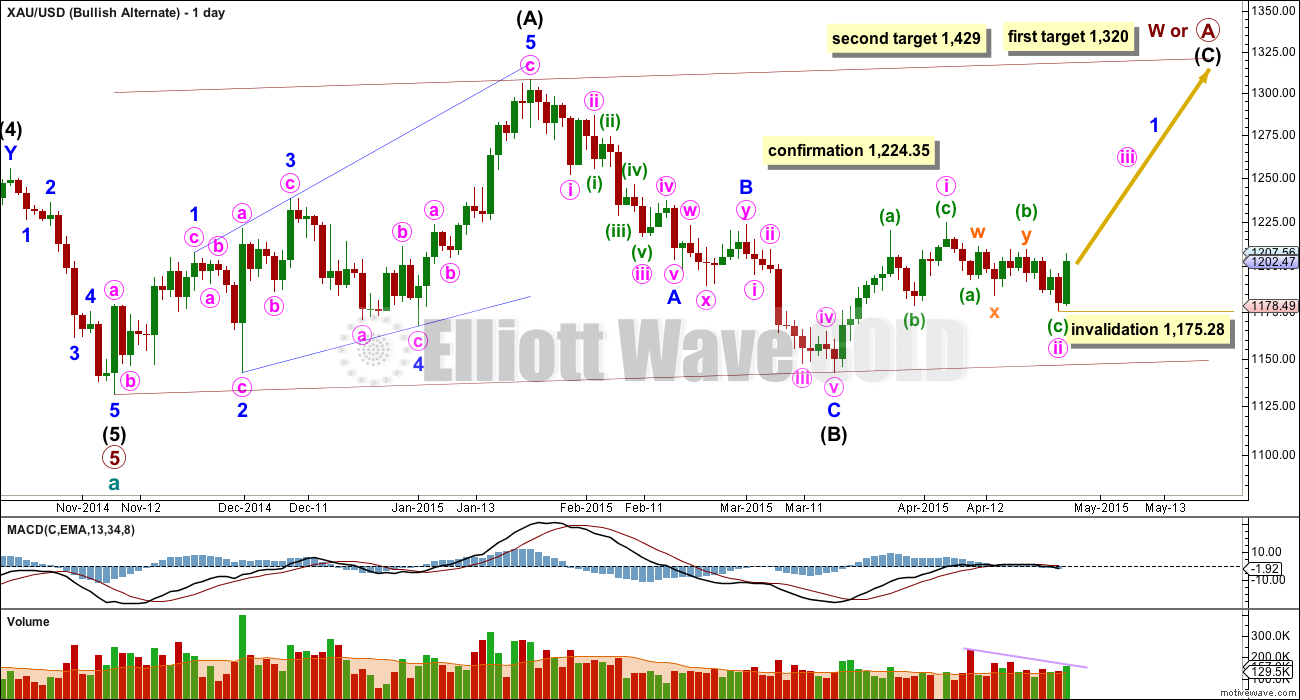
It is possible that the intermediate degree movement up for the bull wave count is beginning with a leading diagonal in the first wave position for minor wave 1.
A leading diagonal must have second and fourth waves which subdivide as zigzags. The first, third and fifth waves are most commonly zigzags but sometimes they are also impulses.
Here, within minor wave 1, minute wave i may be a zigzag, and now minute wave ii also may be a completed zigzag.
Within minute wave ii minuette wave (a) subdivides as a five wave structure, minuette wave (b) subdivides as a double combination (flat – x – zigzag) and minuette wave (c) subdivides as an ending diagonal.
This alternate wave count sees very time consuming first and second waves at minuette degree, but sometimes within diagonals the waves may be longer in duration.
Diagonals don’t normally exhibit Fibonacci ratios between their actionary waves, so a target for minute wave iii cannot be calculated until some structure within it can be used. Minute wave iii must move above the end of minute wave i at 1,224.35.
I would judge this alternate to have a lower probability than the main bullish wave count. A new high above 1,210.88 in the short term would see it substantially increase in probability. At that stage I would expect a third wave up is underway.
Within minute wave iii no second wave correction may move beyond its start below 1,175.28.
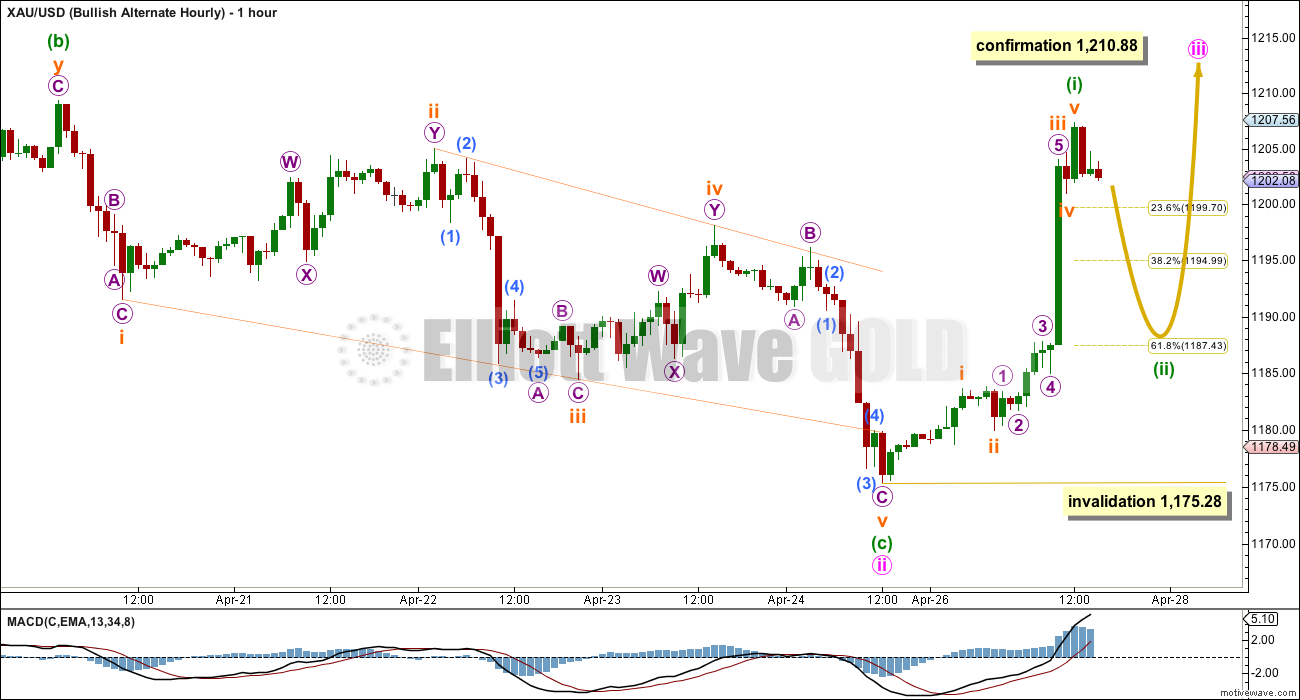
Upwards movement for Monday is ambiguous. I think it looks better as a three than a five, but it can be seen either way.
If this is a five then minuette wave (i) may be complete. Minuette wave (ii) should unfold downwards as a three, and is most likely to end about the 0.618 Fibonacci ratio about 1,187. It may not move beyond the start of minuette wave (i) below 1,175.28.
If the next move down is slow and overlapping, remaining above 1,175.28, then this alternate would be possible.
Bear Wave Count
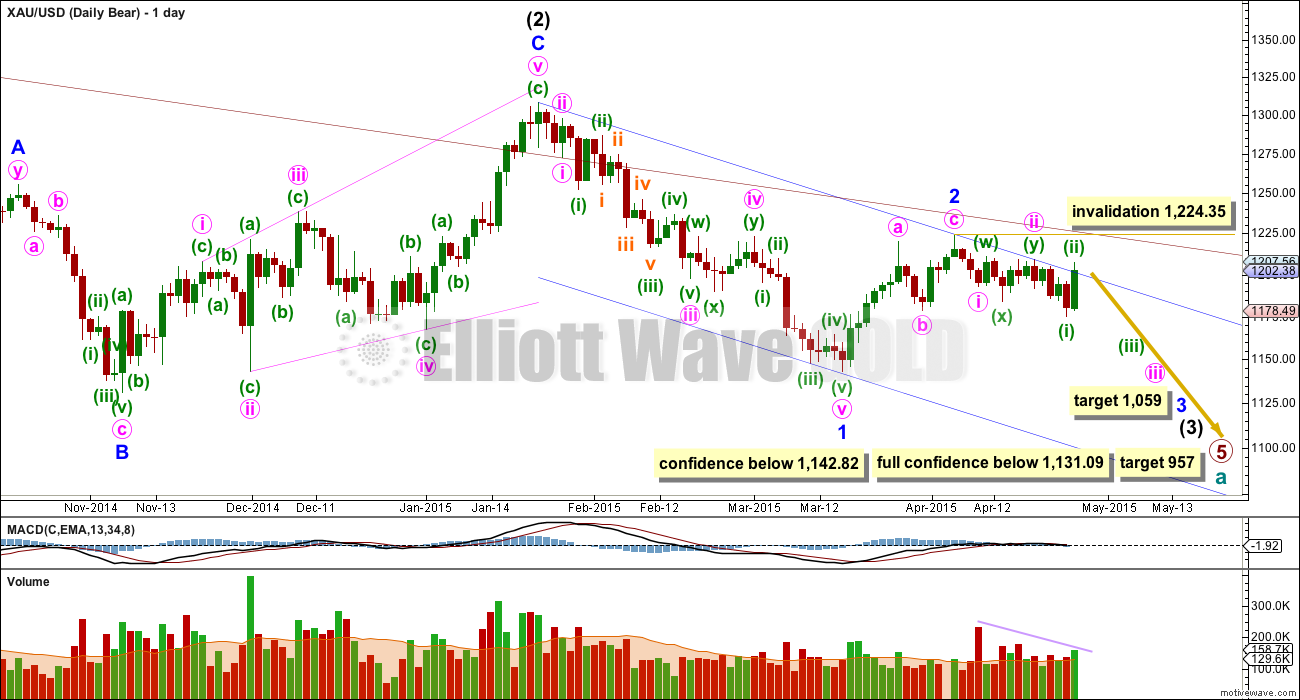
This wave count follows the bear weekly count which sees primary wave 5 within cycle wave a as incomplete. At 957 primary wave 5 would reach equality in length with primary wave 1.
Within primary wave 5 intermediate wave (1) subdivides perfectly as an impulse, and intermediate wave (2) subdivides perfectly as an expanded flat correction. Intermediate wave (3) should have begun.
The problem with the bear wave count is twofold. The channel about cycle wave a (upper maroon trend line, copied over from the weekly chart) is clearly breached. If cycle wave a is incomplete this trend line should not be breached.
The second problem is the duration and size of intermediate wave (2). Although all the subdivisions are perfect it looks too big at the weekly chart level.
This wave count sees minor wave 2 as a completed zigzag, and minor wave 3 in its very early stages.
Minute wave ii is seen as a completed double combination and its proportion looks about right.
Upwards movement continues to find resistance close to the upper edge of the blue base channel drawn about minor waves 1 and 2, although there is a small overshoot today.
The middle of the third wave has not yet passed. This wave count still expects to see a strong increase in downwards momentum at the daily chart level, beyond that seen for minor wave 1.
At 1,059 minor wave 3 would reach equality in length with minor wave 1.
Minute wave ii may not move beyond the start of minute wave i. This invalidation point on the daily chart allows for the possibility that minute wave ii may continue sideways and higher as a flat correction. However, because that would now need a breach of the blue base channel this possibility is highly unlikely.
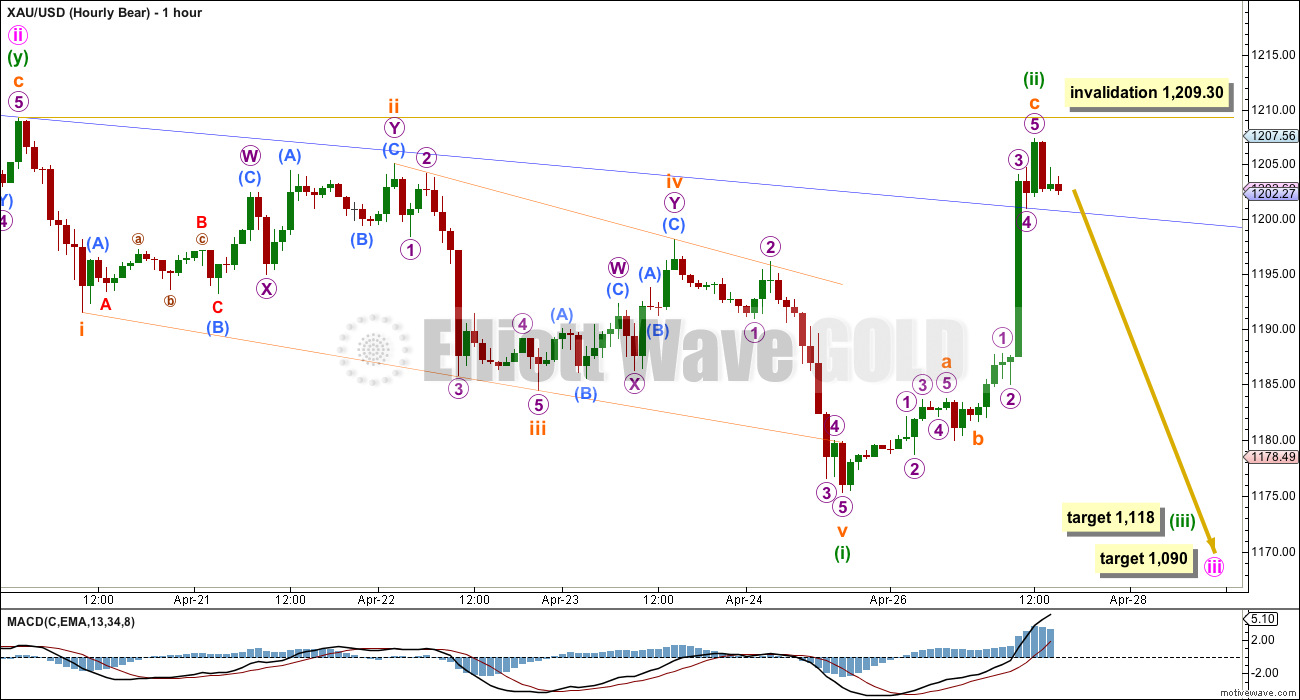
The key to determining which wave count is correct is identifying the sub waves within the diagonal on all hourly charts and here labelled minuette wave (i). If any of the first, third and fifth waves within this diagonal are impulses and not zigzags then the diagonal may only be leading (favouring the bear wave count). I have checked subminuette waves i, iii and v on the ten minute chart. I do think they fit slightly better as impulses, but it is also possible to see them as zigzags. At this stage I would judge the subdivisions to still slightly favour the bear wave count at the hourly chart level.
Leading diagonals in first wave positions are normally followed by very deep second wave corrections. This nicely explains the deep correction of minuette wave (ii).
At 1,118 minuette wave (iii) would reach 2.618 the length of minuette wave (i). Minuette wave (i) lasted four days, so minuette wave (iii) may last longer. A fibonacci eight days would be likely.
At 1,090 minute wave iii would reach 4.236 the length of minute wave i. This fits with the target for the next degree of minor wave 3 at 1,059.
Minuette wave (ii) may not move beyond the start of minuette wave (i) above 1,209.30. If this bear wave count is invalidated by more upwards movement in the next 24 – 48 hours the probability of it will substantially reduce, and it would be relegated to a very unlikely alternate. I would keep it until price tells us finally it is wrong. A new high above 1,224.35 and a breach of the maroon channel again on the daily chart would be required to discard it at this point.
This analysis is published about 05:41 p.m. EST.
Another sign of resistance
More resistance. You can see how significant a gold move over 1215 would be.
Lara
Will Wednesday close with gold having an up day or a down day?
It looks like a 5 wave count peaked today at 1 pm that started Friday at 12:00 pm.
http://www.pmbull.com/gold-price/
We are so close to Wed FED FOMC at 2:00 news release I have all money off the table and will be watching to hit either a bullish or bearish bid at 2:00 EST while watching 1 minute TOS, /GC compare with $DXY.
In less than 60 seconds I’ll see the direction of gold and US dollar and also can click within seconds for a headline news title here.
http://www.marketwatch.com/newsviewer
Though I fully agree with you and will take nearly the same approach, I’m worried of a jump one way or the other without news like what happened the last 2 days…bleh.
That’s the risk we take. One thing that I’m going to add is to listen to Janet Yellen and the Fed Announcement at 2 PM EST on Bloomberg News live, http://www.bloomberg.com/live
I’m sorry Richard, the situation is so unclear I cannot answer your question with confidence.
I think it is more likely to be up than down. Which may fit both bull and bear wave counts at this stage.
But there is a possibility that after a slight new high price could start to move lower very strongly.
I have three wave counts, one of which has two hourly wave counts. So I’m back to four ideas in total. I have to continue to consider all possibilities while Gold is within it’s consolidation phase.
This week and last week have been a nightmare in trying to analyse this sideways chop. Not until price breaks out will I have confidence in my analysis. Until then I’ll have to continue to present multiple possibilities.
“I think it is more likely to be up than down. Which may fit both bull and bear wave counts at this stage.”
This is the polar opposite of what was suggested yesterday Lara.
Personally I would prefer analysis that we could have confidence in. If this means sitting in cash then so be it. In recent weeks we have been caught consistently on the reside of trades and I cannot remember an accurate hourly chart projection.
This may appear overly critical, however I follow daily, read every post and can only post what I see.
Best wishes
The very short term analysis on all hourly charts see at least a little upwards movement. That is where my comment “it is more likely to be up than down” comes from, it’s not a statement on which direction I expect Gold to break out, it’s a statement on what I expect Gold to do tomorrow. That is all. Because that was Richards question.
And yes, I too am frustrated with this analysis. This sideways chop has been a nightmare to analyse.
Every single text I read is clear. Trading range bound markets is for experts only. For those traders who don’t have many years of experience sitting on the sidelines waiting for a breakout and only entering when the market is trending and the direction is known is the advice given repeatedly.
I have repeatedly pointed out Gold remains within a consolidation phase. I have said I expect the breakout to be down more likely than up only because of volume.
This is not EW, this is just simple TA.
I cannot tell members “enter here” or “exit here” or “put your stop here”. I am not a registered financial advisor. And that is not what this analysis is about, it’s purpose is to teach EW and to provide EW analysis as one tool in members tool kits.
If members are not experienced traders and they choose to trade a range bound market, they are exposed to greater risk. I understand the frustration, but anyone who has had this happen over the last two weeks may find some classic TA books such as Magee “Technical Analysis of Stock Trends” valuable. Following the simple advice; don’t trade range bound markets, would preserve capital for when the trend emerges.
This warning ended Monday’s Summary.
“Extreme caution is required until price tells us which wave count is correct.”
Lara gave a very loud and clear warning.
If anyone is investing now thinking it is based on probability and confidence they are mistaken. Lara has clearly stated over and over lately that is not the case. Four then 3 hourly wave counts that is not a confidence forecast for investing. That is not Lara’s fault. That is just the reality of gold’s nightmare sideways chop. I pay for a detailed daily analysis. That is what I receive. I make sure I don’t take out my frustrations on the messenger when they inform me in difficult times that the situation is unclear and dangerous to trade. Or if I invest with unclear probability and a warning and am unsuccessful. How I deal with my frustrations is 100% my problem.
Lara
No apology is necessary. I have inside knowledge of two Legendary GrandMasters in trading gold who also provide seminars and webinars in trading gold and they both are avoiding trading gold lately because the risk factor is not favourable. They can’t even pick a direction. They’ll just let gold made up it’s mind.
If they won’t trade gold, I’m not in a rush to either.
IMO, the wave from $1174 looks better as a 3 which could have topped around $1215 or the 100 dma. I’m expecting a pullback to 50 dma or $1192ish before resuming higher.
Chapstick, how high?
Gold, Silver, HUI charts – Rambus Chartology
Weekend Report…Precious Metals : It’s ALL about the Big Picture After All
Monday April 27, 2015 14:35
http://www.kitco.com/ind/Tablish/2015-04-27-Weekend-Report-Precious-Metals-It-s-ALL-about-the-Big-Picture-After-All.html
Can someone please map the last 30 days of Elliott Wave V Gold Movement.
I would suggest that the waves we are working to are incorrect 75%+ of the time.
SENTIMENT: This has been a horrid start of the week lol…. Gold price ought to be topping soon if it has not done that already….Still favor staying with Sell unless a break above 1216 occurs! Ouch.
Lots of charts like this….path of least resistance is…….
Looks like tagging the line for the 3rd time . 3rd time is the breakout . Just like on the left green part . Very good , I like it !
and consider the HUI monthly. Seriously….does it really look like we’re coming off a bottom that will break through the multi-year downtrend? January’s bearish backtest to the broken neckline and downtrend line appears to be the kiss of death. This looks like we are long ways away from even considering a new uptrend. Discount at your pleasure 😉
Curious, What is your stop on your DUST position? (mental or otherwise).
Mine is $12 – been absolutely hammered.
I feel your pain. Believe it or not, I think DUST could close at 13.11 or better today despite being at 12.52 at the moment.
Not sure I share your optimism Mark, however i am holding regardless.
I no longer share my optimism on the close!…ha
At GDX 20.77 or above my premise of resistance being in control in the intermediate term doesn’t make any sense so that’s my mental stop. Rationale shown on the chart including the 62% retrace off the March lows.
I think sometimes people forget where the 3-yr downtrend line is on the HUI (for example). If you think prices are going to rocket up from here, you’re betting that the multi-year downtrend is broken. As a rule, I buy support and sell resistance….every time.
Very wise of you. Gold is in a multiyear downtrend and doesn’t show signs of reversal yet. Long term trends don’t end so quickly and easily.
Zoom in on that channel please and let’s see if it is drawn correctly .
Here you go…another piece of analysis to discount freely….I’m surprised you were interested.
I am interested because I know you’re wrong . Redraw the line and you will see there is room to run a little higher .
“I am interested because I know you’re wrong. ” Hold that thought……
OK , I drew that upper resistance line on my weekly chart of $HUI and I see room to run more , probably up to 1250 in Gold .
Looks like 5 waves up over at 1213.6 from 1174 low. Expecting correction towards 1200 level.
NUGT finally filled that gap. That took a long time and sure looked corrective.
Lara, despite gold’s movement over the last 2 days, I am simply not convinced that it is headed significantly higher from here. Everything else that I look at tells me that gold is headed down…and fairly soon at that. Are there any other options to plead the bearish case? I thought about a diagonal starting from 1224, and not 1209. However, from what I can tell, the 3rd wave is shorter than the 1st and 5th. So that must be incorrect. How about Bob B’s GDX chart below applied to gold itself?
Gold is still stuck in a $50 range. So, as far as I am concerned, it remains in limbo. Please reevaluate the charts for every possible scenario. I believe there must be a valid bear count here somewhere, but need your help. Thanks.
We need to keep in mind the distinction between “all bear counts are low probability” versus “there is no valid bear count”. If we could know for sure there is no valid bear count, that would be extremely valuable for any trader with the guts to act on it.
The low probability tag given to the bear count is based on Lara’s count from yesterday. I want Lara to go beyond that and take another look. I personally think there is an extremely high probability that gold will move much lower. I just can’t find an EW solution to match my other studies.
I understand what you are doing and I consider it very valuable for this forum even though I am in the bull camp.
I have just finished the analysis, it’s being proofed now. I have four ideas. One expects a small sideways drift, a slight new high (not above 1,224.35) and then a strong downwards breakout to begin.
From an EW perspective it has a low probability, but only because of a base channel breach.
I will continue to consider all possibilities until price breaks out of this consolidation phase.
I completely agree, it’s still range bound. Volume for today is not strongly higher. An upwards breakout should have stronger volume.
It’s been range bound since 27th March. I’ve been trying to see all possible wave counts. Friday I missed a bullish alternate, which is now looking reasonable.
I am constantly looking for every possible scenario. I can see an idea which would allow minor wave 2 to continue higher as a double zigzag for the bear wave count. I’ll publish that today.
I bought a small amount of DUST as close Monday and sold it within minutes of today’s open for a small loss because US dollar getting strong since 5 am today. Glad I did as at 10:00 am news Consumer confidence index falls to 95.2 in April from 101.4 sent gold up $10 confirming alternate bullish count. Since then gold basically going sideways.
DUST only 9 cents off today’s low, GDX 4 cents off todays’ high.
I’m out of everything until Wed 2 pm FED FOMC then will invest instantly on gold’s reaction then. Gold and the US dollar will move opposite directions Fast and Furious. I watch http://www.pmbull.com on the 1 minute time scale and also TOS /GC compare with $DXY.
Here is the site with the fastest headlines to watch then.
http://www.marketwatch.com/newsviewer
Yes I know Elliott Wave is supposed to ignore news. I did that for 18 months then started following main US news events as gold can rocket or drop like a rock within a few minutes so it can float your boat or sink it. I like to be aware.
Do you think Lara will post new counts earlier?
I believe Lara will make comments before close but not new counts, she mentioned this recently. Although when things settle down to less wave possibilities that might change. Also depends on New Zealand DST vs EST DST.
Mark F , you know I don’t want to come across as being mean or something but I want to let you know that I totally discount anything you say and your charts give me no faith whatsoever . I know how to do standard TA and I have enough experience to know that it is 50/50 AT BEST . And you personally are currently running at 0% correct . First you were very bearish while market was running up from March low . Then you were bullish while we were chopping down . Then you became bearish around Thursday/Friday which was a fake-out to downside . Then you say you bought DUST over the weekend . Well , good luck with that trade , sorry
Thanks for the feedback. I hope you feel better now.
Mark – your views are appreciated.
I appreciate different opinions, the market will always judge which opinion was correct.
And by the way, here are my trades over the past month. All of them have been profitable until I hit the drawdown I’m experiencing the past 2 days. I remain long DUST and feel free to discount everything I say….it’s just an opinion that you can do with as you will.
if 1217 gets taken out the next level target is 1235
Is this the bull trap before tomorrow 2PM????
I think the answer is yes but my account balance is making me look stupid at the moment.
lol….you have to be able to laugh at yourself. Very nice.
u r not alone.
Is there a corrective wave down from here?
Yes GOld can goto 1235…
There might not be interest rate hike in FOMC meeting…
I know this almost sounds ridiculous, but as I review many charts I’m not convinced this is THE breakout. Resistance may still be in control and the structure still shows many signs of bearishness which I know seems to be defying price. I will post a GDX hourly chart after 11am to show what I’m looking at.
I’m also in the same camp. I like Bob’s GDX daily below and looks like E could be today’s high of 20.47. The divergences between recent price action to CMF and OBV warrant some caution on the long side.
Here’s what I’m looking at on the GDX hourly.
A view from the daily.
For what it’s worth, Avi isn’t counting this as a breakout until we clear essentially the 1224 mark or so.
that actually makes sense. did you see the GLD chart I posted below a few minutes ago. An argument for resistance.
Yes, that explains the pause we are seeing right now. What this confirms for me is that the bull count is the one to go with, and maybe we see some more corrective action, but for me, I am not trading it. I’ll just sit tight on the long side for a few more weeks I think.
Victor – We should not blame Lara for making mistakes. While we give credit to her when we predicted the lows like wise we should also accept that there is always room for error
I suggest you make your due diligence and not blindly put the blame on Lara. She has now taught you EW analysis by providing educational resources. Suggest that you start counting your waves and validate that with Lara
I’m not blaming Lara, I did do my own research, and I apologize if it came across that I was blaming Lara…I’m upset at the market and I’m venting…
You are fine. You did not blame Lara. Someone else is out of line here.
ok great Victor. It appeared so, just wanted to put in my thoughts. I truly understand your frustration as I’ve been in your shoes earlier and continuing to be so 🙂
Sure thing…time for a nap–I’ll re-attack tomorrow after I get my head straight.
Victor
The market sideways undecided goes on and on.
Very tiring, frustrating, dangerous. I keep any trades humble and small. Best wishes for prosperous trades.
According to Lara’s analysis, this is a breakout…I was short, I’m out now…extremely frustrated and on the sidelines.
yup clear consolidation at 1198 with a spike now. On daily charts 1216-1217 remain as target points basis upper Bollinger band
On weekly charts the top envelope for 30 day MA is also around 1216 to 1217
10:01a
Consumer confidence index falls to 95.2 in April from 101.4 Gold spiked $8 in 1 minute to 1213.37
Both hourly wave counts invalidated.
Hourly Bull 2 is valid, 23.6% retrace to 1199 over night.
Well played. Looks like I should I have stuck to my weekly charts which have been more bullish. I clearly didn’t see a breakout coming ahead of the Fed tomorrow.
The COT data didn’t support the bear count in my opinion. And since I missed the last move off of 1142 trying to trade the smaller waves, I decided to buy into my position and hold it for a while….which has tested my patience…
as you know I was long for quite a few weeks but gave up on the structure. It was getting too long in the tooth and internally seemed to be falling apart. Let’s see how the close looks but GLD still has me a bit conflicted.
Silver is up a higher percentage and gold volatility down…indicates to me that there is more upward movement…how much, I don’t know…only bearish caveat to that is that copper is flat and GDXJ is lagging GDX…gold held up yesterday in the face of other commodities being down…I can’t afford these brisk $10 moves in 5 minutes against my position…going to wait until after fed meeting…
Bullish alt. hourly confirmed
Got it !!! Go long now to 1300
Personally I would wait for further proof, break of 1224.35 would be confirmation
if 1198 doesn’t get taken out then we should see the price reaching 1216
1200/1199 appears to be holding; a drop through here is required to target 1191-90; the longs need to take out 1205 (as yet limiting) to seek higher and expect gold price rise to be curtailed under 1214/15….Not happy with the situation though, keeping it short until 1216 is taken out!….
with a pick up on Mon’s volume count. I strongly believe that this phase is just a correction for the prices to move towards 1240 range. We may see sub 1000 levels like Lara stated. That may come only after this up-move gets done
Let us see how the wave pans out finally
The major issue for me with a $1240 scenario is that would create a major, long-term breakout on the GDX charts and I just cant imagine that happening and then have prices reverse and head to lower lows. I think the highs we saw yesterday are not going to be broken before we see lower lows.
nice charts Mark, difficult to attribute a wave count that makes sense though…
Thanks V. While I’m not very EW literate, without trying to count the waves, doesn’t the HUI chart for example look like it made an impulsive wave down in late Feb-early March, and that action was followed by corrective chop forming a bearish flag to resistance ever since? I identified what I thought was a bearish Gartley back in Feb and the pattern still seems valid to me.
sorry for the chart bombs but here’s one more I couldn’t resist sharing. NUGT.
Nice charts. Thanks!
Mark, great charts, thanks…I am in DUST as well…I was surprised to see bonds hold up so well, TLT got back to the 50 sma…I did see the R2k break down, but its been weak for a long time…the other equities have been holding up, though–DIA, SPY, QQQ…I have to admit that the VIXs have shot up higher and could mean some limited downside–i would prefer to wait until after the fomc for the direction in the equities…but, yes, the metals look very perilous right now…
if we break these trend lines to the upside which by today actions look possible, we’re off!
I agree but I don’t think there is much of a chance at all that prices close above resistance today. Going long intraday today above resistance would be a sucker’s move in my opinion.
There is a massive tussle going on in the gold and silver markets. Physical demand is huge. Prices below 1200 have been a field day for the Indians and Chinese. This gets completely overlooked. The Indians and Chinese simply see sub-1200 as a buying opportunity.
Gold is flooding out of London into the Far East. There is only so much gold and once it is gone the gold price will ignite.
http://screencast.com/t/hpG0OeVnI
http://screencast.com/t/U8m6YfNb
What you are seeing here is the synthetic paper futures market.
Paper can be created in limitless amounts when there is non delivery most of the time.
There has been years of central bank intervention driving the price of gold and silver down. However COTS are taking the long side now. It is out the bag that JP Morgan has amassed a massive silver stash.
If Lara is finding it hard to label the waves it is not surprising.
There are many warning signs if you are long GDX/gold here including many GDX components at resistance, Russell breakdown today, and bond yields ready to launch just to name a few. Here are a few charts for consideration:
HL
NEM – never bet against resistance in a multi-year downtrend.
ABX – similar
RUT – leader dog index broke TL
and finally, bond yields ready to rock.
GDX triangle / wedge. I added some labels to a chart similar to what Mark posted earlier. Looks complete and likely ready for a downward breakout.
Nice chart Bob. Would you consider E complete now at 20.47?