
Upwards movement continued which fits the bullish alternate Elliott wave count. A new high above 1,210.88 indicated a third wave up may be underway.
Summary: Gold is still within the sideways consolidation range it has been in since 27th March. The situation is still unclear and extreme caution is still advised. At this stage a new high above 1,224.35 would not confirm an upwards breakout, but if this point is breached with strong volume an upwards breakout would be indicated. A new low now below 1,175.28 would indicate a downwards breakout which does not necessarily require high volume but that would increase the probability of a bear wave count. At this stage I will favour neither the bull nor bear wave count.
Click on charts to enlarge.
To see weekly charts for bull and bear wave counts go here.
Bull Wave Count
The bull wave count sees primary wave 5 and so cycle wave a a complete five wave impulse on the weekly chart. At the weekly chart level this has a good look.
The problem with the bull wave count is within the subdivisions of intermediate wave (5). I have not found a solution which avoids running flats and has good proportion between the second and fourth waves of the impulse. The bear wave count has a better fit for this movement.
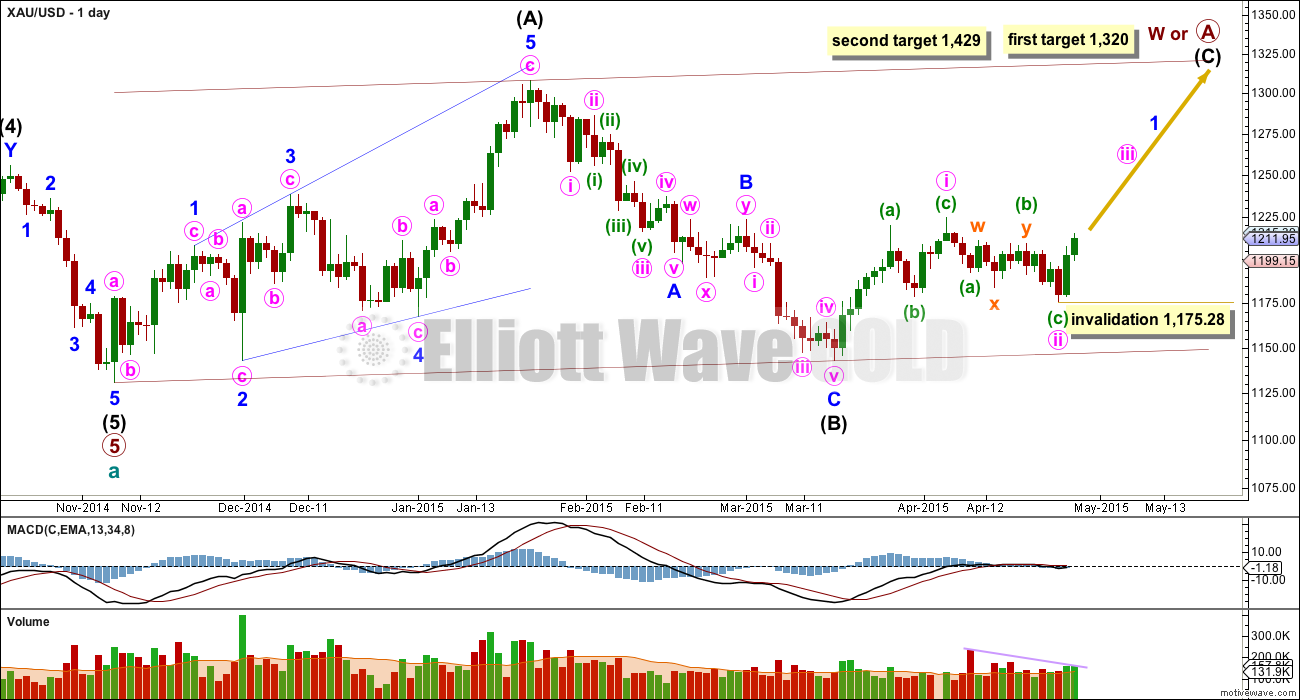
So far within cycle wave b there is a 5-3 and an incomplete 5 up. This may be intermediate waves (A)-(B)-(C) for a zigzag for primary wave A, or may also be intermediate waves (1)-(2)-(3) for an impulse for primary wave A. Within cycle wave b primary wave A may be either a three or a five wave structure.
Intermediate wave (A) subdivides only as a five. I cannot see a solution where this movement subdivides as a three and meets all Elliott wave rules. This means that intermediate wave (B) may not move beyond the start of intermediate wave (A) below 1,131.09. Intermediate wave (B) is a complete zigzag. Because intermediate wave (A) was a leading diagonal it is likely that intermediate wave (C) will subdivide as an impulse to exhibit structural alternation. If this intermediate wave up is intermediate wave (3) it may only subdivide as an impulse.
At 1,320 intermediate wave (C) would reach equality in length with intermediate wave (A), and would probably end at the upper edge of the maroon channel. At 1,429 intermediate wave (C) or (3) would reach 1.618 the length of intermediate wave (A) or (1). If this target is met it would most likely be by a third wave and primary wave A would most likely be subdividing as a five wave impulse.
It is possible that the intermediate degree movement up for the bull wave count is beginning with a leading diagonal in the first wave position for minor wave 1.
A leading diagonal must have second and fourth waves which subdivide as zigzags. The first, third and fifth waves are most commonly zigzags but sometimes they are also impulses.
Here, within minor wave 1, minute wave i may be a zigzag, and now minute wave ii also may be a completed zigzag.
Within minute wave ii minuette wave (a) subdivides as a five wave structure, minuette wave (b) subdivides as a double combination (flat – x – zigzag), and minuette wave (c) subdivides as an ending diagonal.
This alternate wave count sees very time consuming first and second waves at minuette degree, but sometimes within diagonals the waves may be longer in duration. The diagonal is most likely to be contracting so minute wave iii is most likely to be shorter than minute wave i and end before 1,257.
Diagonals don’t normally exhibit Fibonacci ratios between their actionary waves, so a target for minute wave iii cannot be calculated until some structure within it can be used. Minute wave iii must move above the end of minute wave i at 1,224.35.
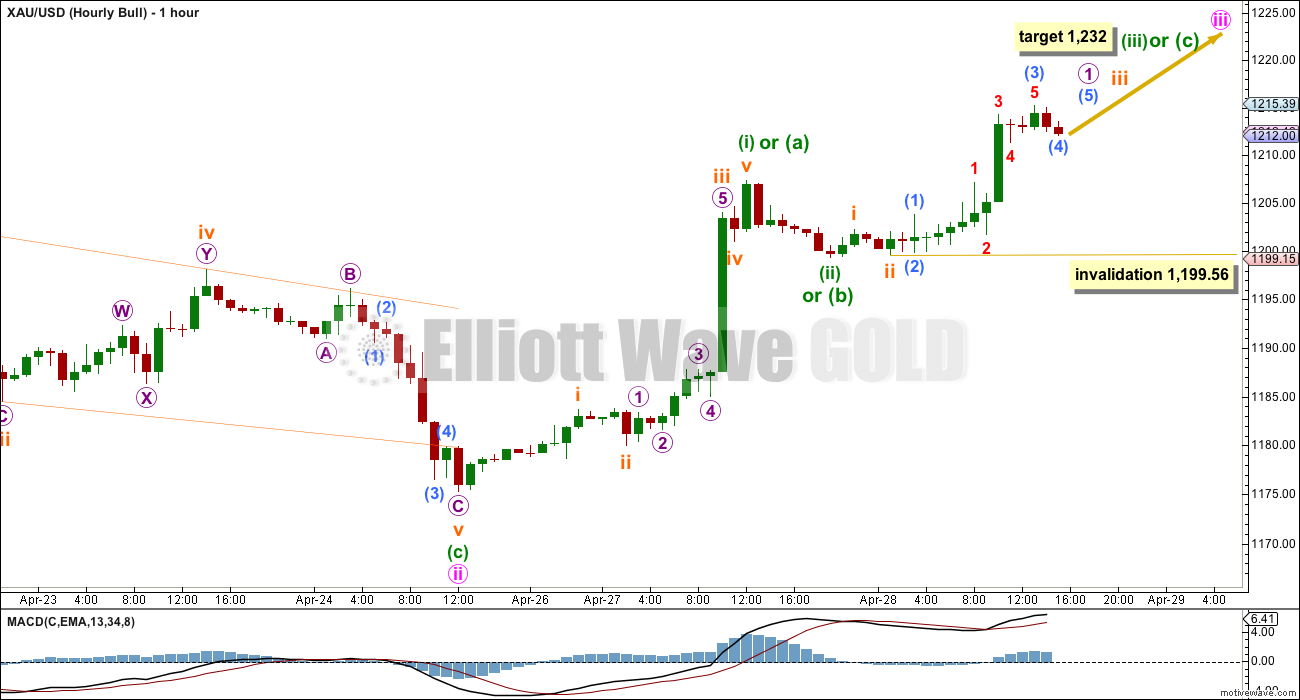
Minute wave iii of a leading diagonal may be either a zigzag or an impulse.
So far neither structure would be complete so more upwards movement is required for this wave count.
At 1,232 minuette wave (iii) would reach equality in length with minuette wave (i). When the next five up is complete I will have an hourly alternate wave count for the bull wave count which looks at the possibility that minute wave iii is a zigzag, and this depends on where the next five up ends. It it takes minute wave iii above the end of minute wave i at 1,224.35 it may be the end of minute wave iii as a zigzag within a contracting leading diagonal.
Within minuette wave (iii) or (c) is complete then how low the next wave down goes will determine if minute wave iii is over as a zigzag or will continue as an impulse.
This bull wave count expects a continuation of overall choppy overlapping movement generally trending upwards. The traditional technical equivalent of this diagonal would be a rising wedge.
Micro wave 2 may not move beyond the start of micro wave 1 below 1,199.56.
Main Bear Wave Count
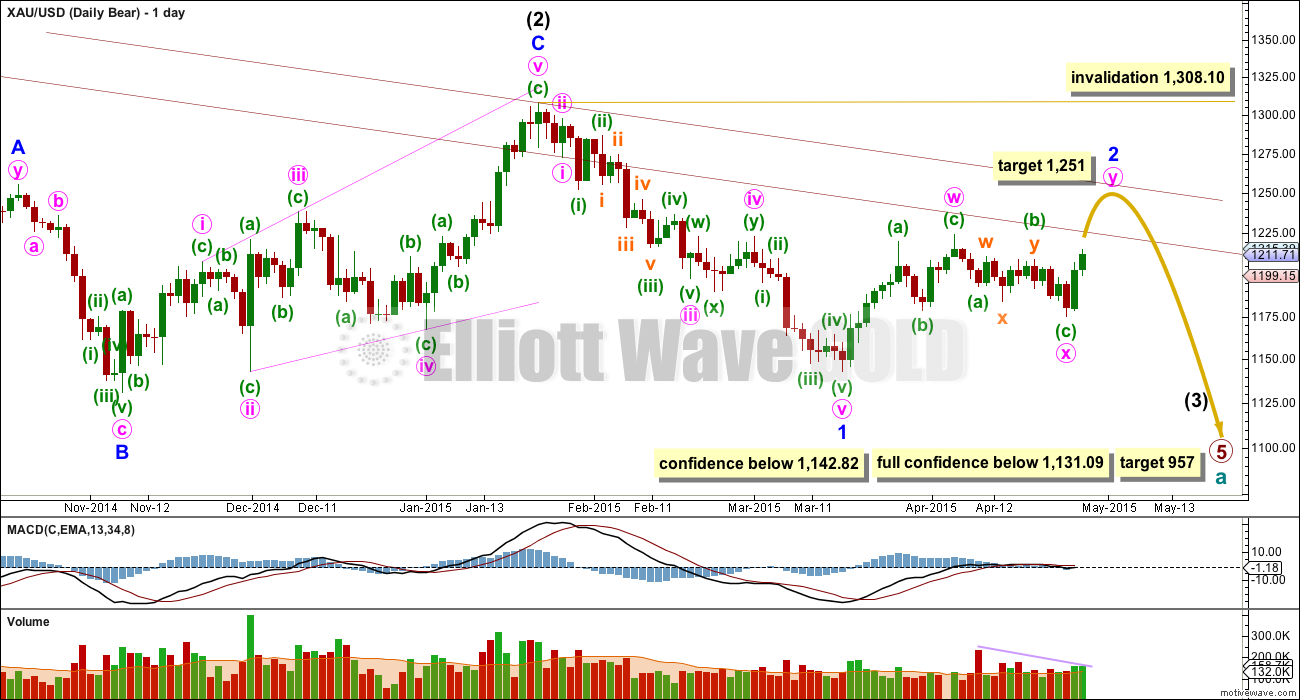
This wave count follows the bear weekly count which sees primary wave 5 within cycle wave a as incomplete. At 957 primary wave 5 would reach equality in length with primary wave 1.
Within primary wave 5 intermediate wave (1) subdivides perfectly as an impulse, and intermediate wave (2) subdivides perfectly as an expanded flat correction. Intermediate wave (3) should have begun.
The problem with the bear wave count is twofold. The channel about cycle wave a (upper maroon trend line, copied over from the weekly chart) is clearly breached. If cycle wave a is incomplete this trend line should not be breached.
The second problem is the duration and size of intermediate wave (2). Although all the subdivisions are perfect it looks too big at the weekly chart level.
Because the base channel on the alternate bear wave count is now clearly breached it has been relegated to an unlikely alternate. This main bear wave count has about an even probability with the bull wave count at this stage.
Minor wave 2 may be continuing as a double zigzag. The only problem with this part of the wave count is the duration of minor wave 2. Now both minor wave 2 and intermediate wave (2) look too big on the weekly chart.
The purpose of a second zigzag is to deepen a correction when the first zigzag does not move price deep enough. Within double zigzags the X wave is normally shallow. The second zigzag may end when price touches the parallel copy of the upper edge of the maroon channel, in line with resistance at the high of intermediate wave (2).
Minor wave 2 may not move beyond the start of minor wave 1 above 1,308.10. Before price reached that point this wave count would substantially reduce in probability.
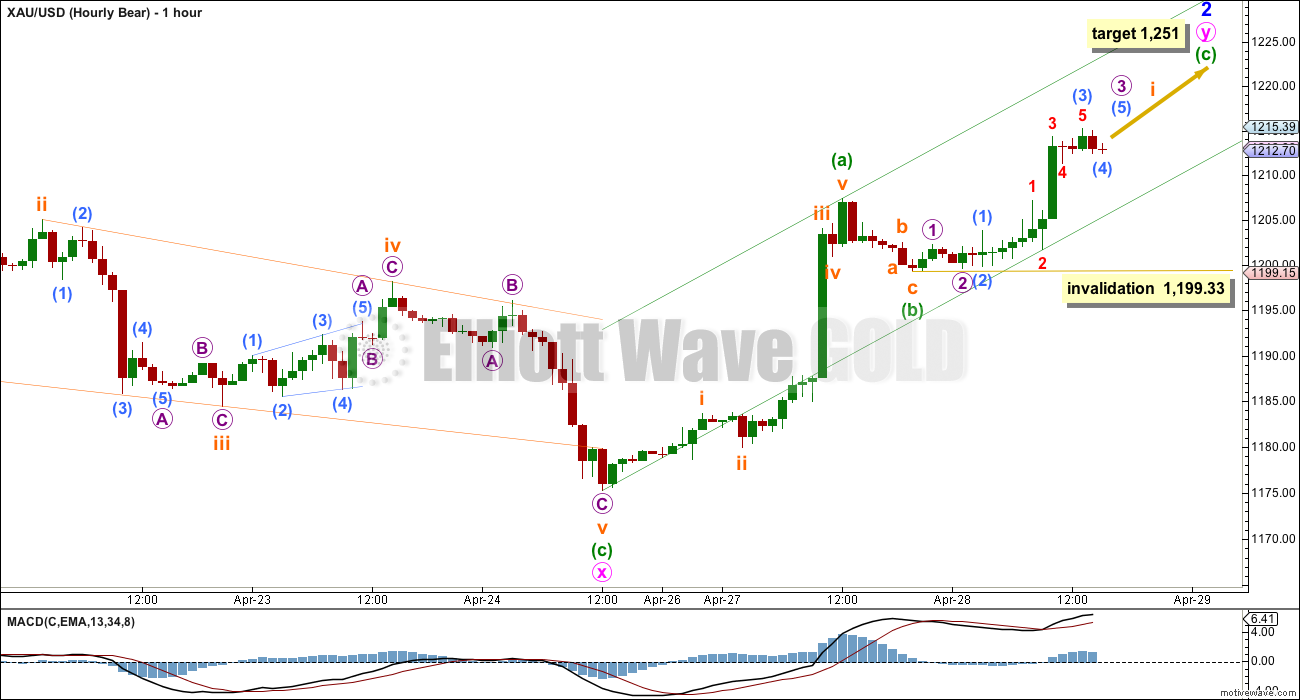
Minute wave y must subdivide as a zigzag. At 1,251 minuette wave (c) within it would reach 1.618 the length of minuette wave (a).
Minuette wave (c) must be a five wave structure. When subminuette wave i is complete then subminuette wave ii may not move beyond the start of subminuette wave i below 1,199.33.
Alternate Bear Wave Count
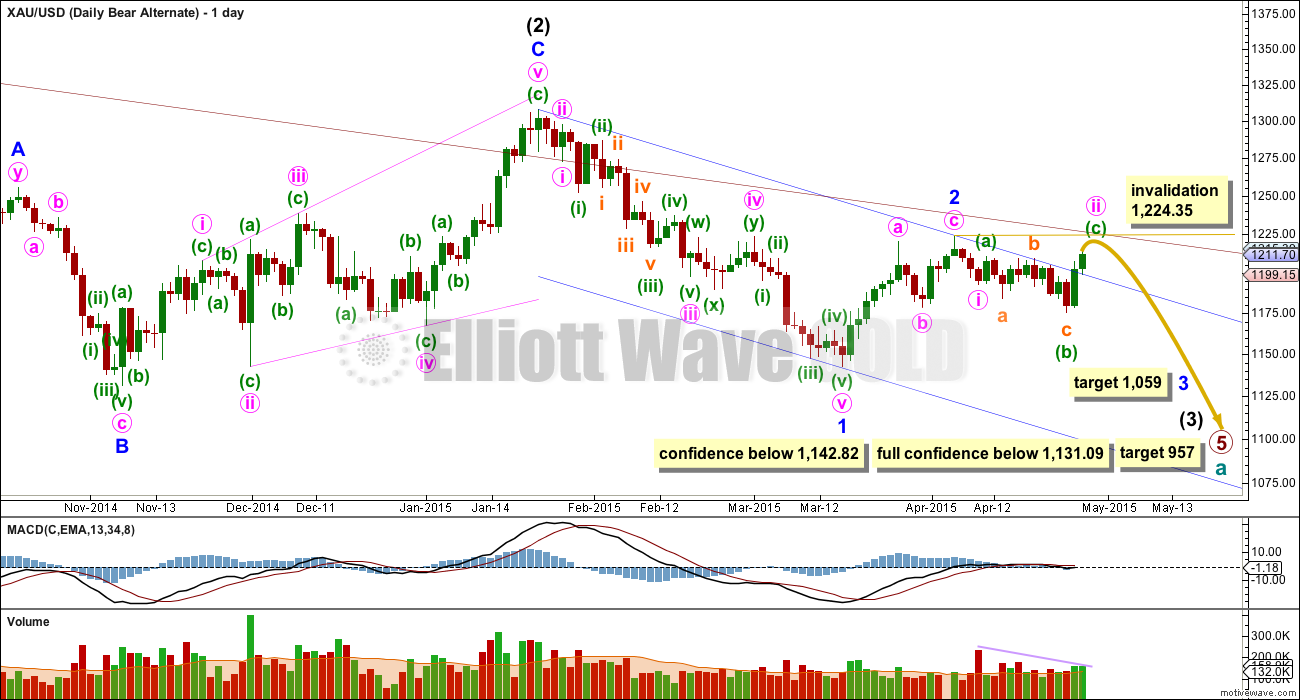
This wave count sees minor wave 2 as a completed zigzag, and minor wave 3 in its very early stages.
Minute wave ii is seen as an incomplete expanded flat correction.
The base channel about minor wave 2 is breached reducing the probability of this wave count. This alternate bear wave count has a lower probability than the main bear wave count.
The middle of the third wave has not yet passed. This wave count still expects to see a strong increase in downwards momentum at the daily chart level, beyond that seen for minor wave 1.
At 1,059 minor wave 3 would reach equality in length with minor wave 1.
Minute wave ii may not move beyond the start of minute wave i. This invalidation point on the daily chart allows for the possibility that minute wave ii may continue sideways and higher as a flat correction. However, because that would now need a breach of the blue base channel this possibility is highly unlikely.
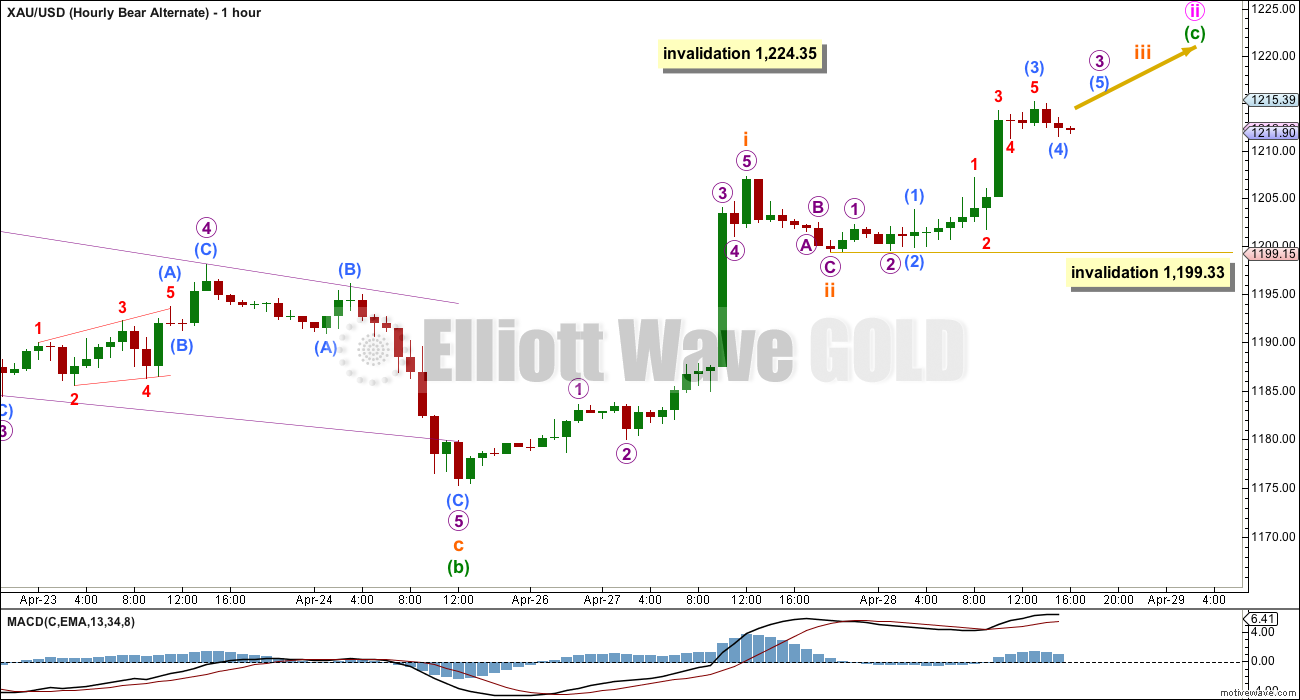
Minuette wave c must complete as a five wave structure. So far the structure would be incomplete.
Not much more upward movement is required; the completion of subminuette wave (iii) followed by sideways movement for subminuette wave (iv), and a short fifth wave for subminuette wave (v).
Within subminuette wave (iii) no second wave correction may move beyond its start below 1,199.33.
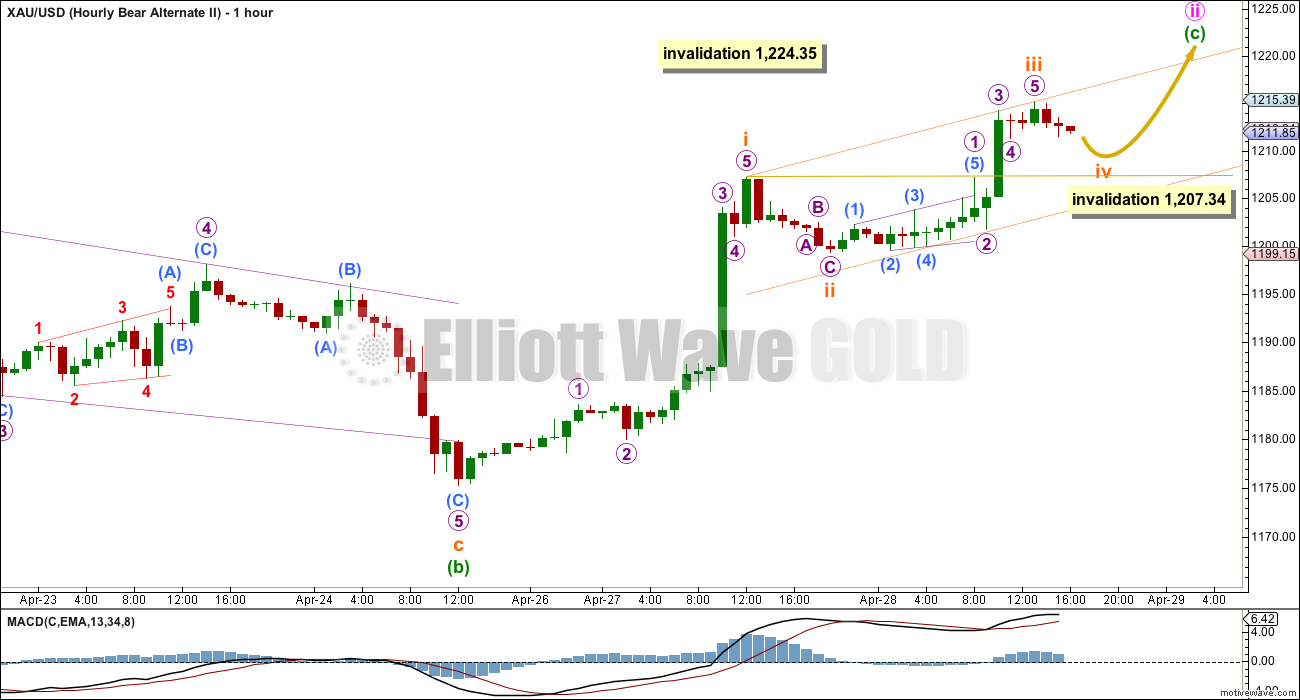
There is more than one way to label this upwards movement. Minuette wave (c) may be closer to completion.
Subminuette wave iv may not move into subminuette wave i price territory below 1,207.34. If we see a drift sideways followed by a short upwards wave which does not move above 1,224.35 then it is possible upwards movement may be over.
Once minuette wave (c) looks like a completed five wave structure minute wave ii could be over. This wave count would then expect a downwards breakout to begin for a third wave down.
This analysis is published about 04:57 p.m. EST.
I think we saw a top in the GDX today. We tagged the midpoint of my fork that Ive been maintaining for months as well as the weekly down channel and the 5-minute charts suggest and ending rising wedge right into resistance which broke down and made a back test. Charts below.
GDX 5-min. Note breakdown and backtest.
Monthly GDX
really good chance that dollar bottomed today.
Mark, this is Lara’s last GDX count. The bear GDX count she had was invalidated (not saying there isn’t a bear count, but that the one she had was invalidated).
Lara,
Any chance we can get an updated GDX count?
Yes, and I will do this today. I did try last week, but that chop for GDX was so hard to analyse, I wanted to wait for a little more information.
Thank you very much.
Thanks for sharing. Isn’t the door always open that 3 down isn’t complete yet or perhaps the current sideways action is wave 4 with 5 down coming next? I also have a hard time betting that trend channel resistance will broken. I realize that all trends have to change at some point but they tend to follow an exhaustive capitulation move which I’m just not seeing in the GDX charts. Lara’s oil charts make more sense to me in this regard and I’ve done very well trading UWTI during this corrective move.
Sure those are possible, in fact, I like the bear count right now that goes up to 1251. I just wanted to present Lara’s last analysis for GDX which has the trend channel being broken in a corrective pattern.
I’m updating it today. The bear wave count is still possible if I see a first wave complete with a truncation.
My GDX analysis will be proofed and published within a few minutes.
GDX does not have great enough volume for it’s waves to have reasonable looking EW structures, so my analysis of GDX will always come with that caveat. Because of lower volume EW analysis will not be reliable for that market. That’s a big reason why I won’t analyse it daily or even weekly. And why any EW analysis of GDX cannot determine a direction for Gold, it has to be the other way around.
Miners look to be breaking out strongly. Yesterdays move through S/R at $20 and breakout from triangle on decent volume needed some follow through. I think the bull case looks stronger based on the miners.
http://schrts.co/td021C
Lara
Is gold expected to overall go down or up the second half of this week?
Today’s 2 pm FED FOMC $9 drop was retraced back up about .618 in half an hour and the miners still strong. I’m looking to decide to buy or short miners.
I’m really sorry Richard, I still cannot answer that question with confidence. I have three ideas at the hourly chart level. I can see three possibilities for the short term.
Because more than one wave count is viable it is not possible for me to say “this will definitely happen” with confidence.
Today’s down day could be a small second wave correction which should now be over, invalidation point 1,199.56. If this first idea is correct then Gold should move into a third wave up. Confirmation point 1,224.35.
Today’s down day could be part of an expanded flat correction which needs to move lower to complete, target 1,194, invalidation point 1,175.28.
Finally, today’s down day may even be the very first day of a big third wave down. Confidence point 1,175.28. Confirmation though must be finally at 1,131.09.
Look at volume today. Again, a smaller price range but higher volume. For a down day. This is another piece of evidence to consider, volume during this sideways consolidation is strongest for down days. I’ve just spent time going back to September 2011 and looking at consolidation phases and what volume did. Sometimes during a sideways move volume is strongest on days which are the opposite to the eventual breakout direction. But more often during a sideways move volume is strongest in the same direction of the eventual breakout. So it’s not definitive, but it is another piece of evidence to consider carefully.
After further work on hourly charts, I will say I think it is more likely (only slightly) that Thursday may see a down day. The short term for all three hourly charts after some adjustment will see at least a little downwards movement.
As for Friday… it’s too early to state with any confidence what will happen on Friday.
It’s still in a sideways chop. No breakout yet. It’s range bound. Extreme caution and careful risk analysis is essential.
Dollar didn’t recover that much. Gold stocks kind of recovered. And gold didn’t touch 1200. Movement down looks pretty corrective. This may be a buyable dip. Tough call. Any thoughts?
Agreed. I am expecting Lara’s updates to reflect the corrective nature in her counts. Based on the counts above that are still valid, movement should be upward after the correction.
Lara can you post the weekly chart for your main bear count so that we can see the bigger picture?
Lara has included the link above under the summary para:
To see weekly charts for bull and bear wave counts go here.
I’m linking to it everyday. Nothing there has changed.
For bull and bear wave counts invalidations :
Bull: 1199.56
Bear:1199.33
Can’t say the market doesn’t have a sense of humor. After all the anticipation, not much happening yet.
With the dollar being destroyed I can’t see how gold is staying down.
At some point this will give and gold will rally strongly.
It’s down to a pop through 1212 or a drop through 1204…. Very frustrating this lack of clarity and clear cut direction!
Syed – All these fluctuations should be expected and my suggestion is if you are trading buy very small lots at every dip
Remember, the dollar is in a powerful uptrend and gold is in a multi-year downtrend. GDX at strong resistance and USD at strong support. If this chart were gold, I suspect most folks here would be clamoring to buy this at 96.
been looking at DXY myself. see monthly chart below. Looks to me like poised for large downturn. Daily has already broken recent lows. Do you still think dollar is going to break thru?
3 out of the last 4 FOMC meeting have smashed gold lower.
Rally is expecting. The most probably course for Gold price today would be a break above 1216 to open up 1220-25, upper band notwithstanding with downside restricted to 1200-1198…. Lets just wait and see how this plays out….
Well that GDP report should have been rocket fuel for gold if you subscribe to the bull case. Meanwhile bonds are in free fall mode. There’s a major disconnect here and I think we are going to reflect back soon and realize bonds were giving us a clue.
The dollar bounced up again. Gold is tracking it tick for tick…inversely, of course.
Makes total sense. $USD is poised to launch.
Soon, but not today. It leaves some room for gold to advance for a few days before it plummets.
I’m not trying to pick an exact day. I’m just saying that conditions are overall favorable for dollar rise, gold fall, and bond fall based on what I’m seeing in terms of support/resistance and oversold/overbought indicators. We’re probably not seeing things differently. I may have a somewhat longer term view than you on my trading….I try to go for moves that last weeks or more.
I trade gold futures and typically hold for weeks at a time. Several indicators tell me that there is room for gold to move up. This is for the short term only – perhaps 5 to 15 days before gold peaks.
what are your thoughts on the huge disconnect right now between gold, bonds, and the dollar?
Gold is enjoying a short term rally within a multiyear bear market. The dollar has more upside to go, but is still in a consolidation phase. Like the dollar, US bonds are benefiting from the fact that other countries are even worse off. The EU just started quantitative easing, while the U.S. is perceived to be a few steps ahead. Gold and the dollar may rise together for a few days only, then gold plummets.
USD may be making a bottom today as shown by this UUP chart.
Dollar is down 1.3% and gold cant get out of its own way. That’s what happens at resistance. Gold market needs some really assuring words from the Fed today to avoid a plunge.
My theory is the bond market is a bit too big to easily manipulate…hence you get cleaner charts compared to gold charts. This is doing exactly what I expected 2 days ago.
Another thing I’m watching is this possible H&S silver pattern. Closed smack at resistance yesterday.
Failure to breach 1209.34 on the 16th and 20th of this month led to substantial sell offs.
The rally in last 2 days was due to a $20 spike on Monday over the course of 15 min and another $15 spike on Tuesday aprox same time. The buying started around 9.55 am and was mostly done at 10.10 am Prior to the last few days the price was drifting down (without momentum though) enough to turn the charts bearish. Looks to me like somebody knows exactly what to do to create maximum impact and confusion. Most of the traders finished the day redrawing their charts and reanalyzing their hypotheses.
It is called painting the chart. Happens all the time specially in Gold.
The market may feel that the dollar is close to bottoming, that’s why gold was dropping too…in anticipation.
A strong dollar move and the mention of interest rates at the FOMC could smash gold…
We’ll be back to last Friday’s wave count.
what time is the FED announcement today?
2pm EST
Does anyone see a case for a technical move south from here?
FOMC usually leads to a strong move in gold. Hoping that Interest Rates are put back on the agenda and then we should see a sell off.
Lara: Both bull and bear wave counts expect gold to rise to 1251-1258 price territory.
For bear count price above 1224 was the point where you had wrote in past that bear count will be discarded.
Is that guidance now changed?
I can see two ideas for the hourly chart for the bull wave count. This may be a small second wave correction ending now or soon, invalidation point 1,199.56. Or… it may be a larger degree second wave correction as a big expanded flat, invalidation point 1,175.28.
For the alternate bear wave count I can see minute wave ii as over, and today’s red candlestick the very first day of a big third wave down.
Look at volume today. It’s relatively high, the highest volume since 9th April. And that high volume is for a down day, and it’s on a day when the price range was smaller than the prior two up days.
Volume just keeps indicating a downwards breakout. The problem of course is this does not always work as expected. Sometimes during a consolidation the strongest volume day is opposite to the eventual breakout direction. More often though the strongest volume day is in the same direction as the eventual breakout. So it’s an indicator, it’s not definitive. It’s another piece of evidence to consider.
The alt2 seems to be in play.
Looks like Bear hourly alt 2 is now invalid.
Not looking good at this point.
Holding both.
I’m pretty sure you and I are the only ones on the planet long DUST/JDST.
Luckily I have only committed £250,000 to this position… Selling a house and trading gold is not advisable.
So for both Bull and bear hourly count gold is completing micro wave 4 and then expect wave 5 upward.
How far gold to retrace fib .382 or .618?
I’m not confident about the wave count anymore..I can’t tell you.
Gold’s seasonality has been in force.
After making high in January (season’s high) gold put in March low (1142). From this low gold will have May high (1251). AND then the final low in Jun-Jul.
Lara’s bear wave count is tracking the seasonal price movement calling for high of 1251 in May and then low in the summer.
During the season gold has not known to make new high after making high early in the season.
Expecting today’s trading level to be between 1209.3 to 1217
I really like the wave count on the main bear. Thanks Lara for continuing to seek alternatives. It fits well with what my analysis is showing me.
Why is it called a bear when it’s going to 1251?
It seems unanimous, gold must go higher from here. There is no Wave count that avoids taking out major multi-year resistance on the GDX and HUI and probably spot silver as well. Nearly everyone here seems to be in the same camp that major resistance is about to be blown away. Meanwhile momentum is in nosebleed territory, bond yields broke out as strong as I thought they would today and the $USD is really close to support. Also DUST volume and chart patterns are consistent with major lows right now. I guess I will believe it when I see it but for now I will continue my mantra of not positioning myself against a major downtrend at resistance even if it “feels” like prices can only move higher.
NUGT hourly illustrates my point well. I cant imagine looking at this chart and thinking “Hmmm….this is a good risk/reward long play at today’s close.”
USD Chart – ready to push up.
Again , your trendline is not accurate enough and there is plenty of room to move . You should decide what timeframe you are trading also .
On my daily chart of NUGT , your downward sloping trendline has already been breached by a mile . I tried log scale and not log scale , same thing .
Agree. Today NUGT candle is above the trendline. Why so bearish now, after being the most convinced bull last week? And what difference does it make if other traders are wrong? I still think GDX is going to at least 21.50
The internal structure of the GDX channel became bearish on the breakdown on Apr 22. I sold the first bounce afterwards and began going short via DUST on bounces. Underwater now for sure but the premise hasn’t changed. I’m just sharing my analysis with no agenda. Thought maybe it’s helpful for some as a free exchange of ideas.
The “internal structure of GDX” is no longer bearish. You have clear breakout of horizontal resistance around 180 for HUI. Retrospectively last week was a bear trap. Somebody hit this market hard yesterday and the short covering rally had follow up today on the upside. I’m not sure how much higher we can go, but the probability of going higher is different than zero.
Of course….nothing is certain. I was just showing what I thought were good technical arguments for the bear case. My hope is that there is a good exchange of ideas bull and bear so that we can be more informed about the positions we take which we all of course decide for ourselves.
I appreciate your charts and thoughts Mark…keep it going.
The technical issue I have with GDX going to 21.50 is that you’d have to believe that this multi-year channel is going to break to the upside. I just don’t subscribe to that without seeing a chart structure that resembles a true bottoming first.
Bill, I think it’s healthy for this board that you express your displeasure with the accuracy and possible directional viewpoint of Mark’s analysis. Whether Mark is right or wrong with his analysis, his charts and commentary are thought provoking and appreciated. That said, I think it would be appreciated and more beneficial to Mark and other members if you would back up your points by posting your own charts to illustrate your view. That would help all members visualize your viewpoint better and then they could make their own decisions.
Ah no I have no obligation to reveal anything . And Mark F’s track record should speak for itself . If I wanted this kind of 50/50 analysis I can just go to the Stockcharts public chartlist and see millions of charts just like it . He offers nothing special to me . Besides that I am checking the standard TA indicators myself , don’t need this .
TLT divergence with GDX often gives us clues a few days ahead of a major inflection.
Wow , that is mega-correlation there . This is the secret behind all GOLD moves . I am sold !
Instead of mocking my analysis I’d rather see yours for comparison. I’m completely open minded and would like to see anything compelling.
Mark, nice chart. Can you provide the link? Thanks.
here are the DUST volume patterns that more consistent with a DUST bottom than top.
and the current 15-min channel showing DUST is more likely to rise from here than fall.
Scott – From a labeling stand point for 1251 wave, Lara has marked the end point as minute wave 2. If that is the minute wave 2 then minute wave 3 will pull gold price downward
So when you visualize it, the chart will not depict that as a 5 wave impulse movement rather a correction
Remember even in a correction there a bear rally and that is what Lara is pointing to
Thx Lara! There’s an apparent bull flag on the daily with a measured target of $1258 which fits well with your main bear count. All significant daily moving averages have been claimed except 100 dma around $1215ish. With FOMC day tomorrow, I think it’s a no brainer to be long gold before the announcement. It would be nice to see a small pullback into tomorrow AM but I’m not banking on it.