
While Gold may be in a consolidation phase and difficult to analyse, US Oil has been behaving exactly as expected.
Summary: The corrective structure is now clearer. The higher target zone of 59.07 – 61.57 is almost reached. The structure is incomplete. The target remains the same.
Click charts to enlarge.
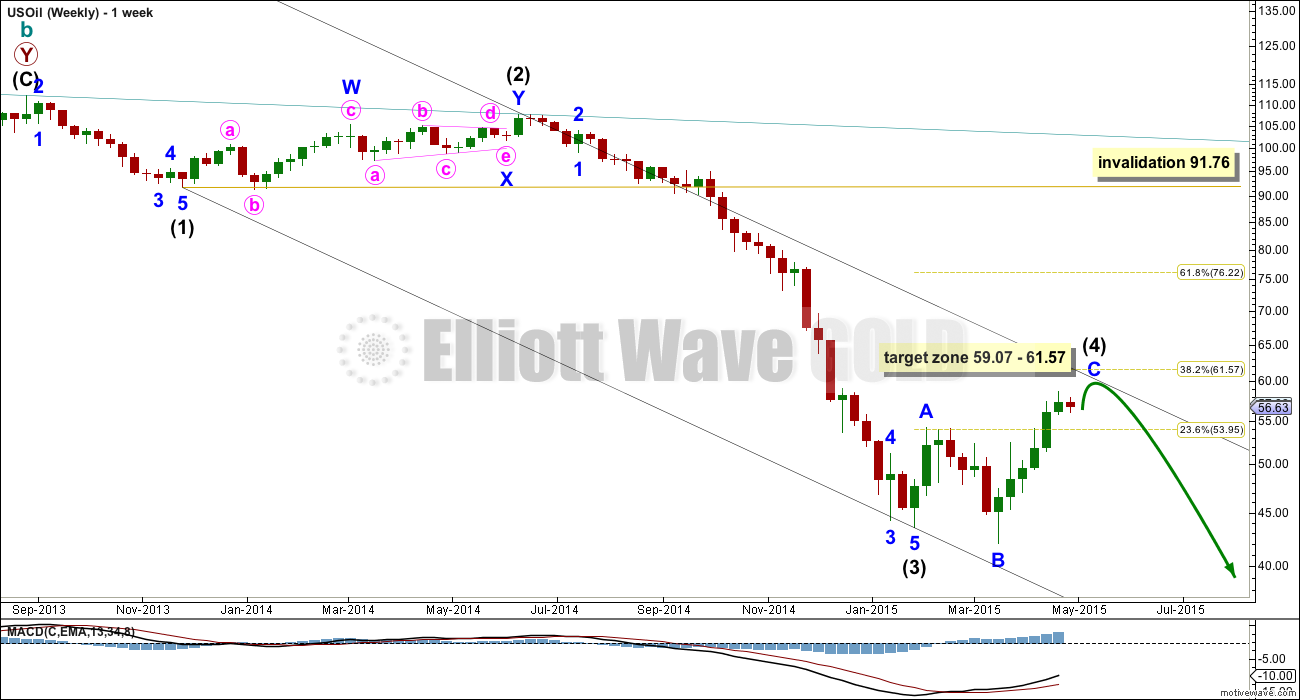
Intermediate wave (4) may not move back into intermediate wave (1) price territory above 91.76.
Draw a channel about this downwards movement using Elliott’s first technique: draw the first trend line from the ends of intermediate waves (1) to (3), then place a parallel copy on the high of intermediate wave (2). I would expect intermediate wave (4) to find resistance at the upper edge of the channel, and it may end there.
Intermediate wave (2) was a deep 78% double combination. Given the guideline of alternation I would expect intermediate wave (4) to be more shallow. It is now an almost complete expanded flat correction.
Intermediate wave (4) would be most likely to end at either the or 0.382 Fibonacci ratio at 61.57 if it gets that high. This is the upper edge of the target zone.
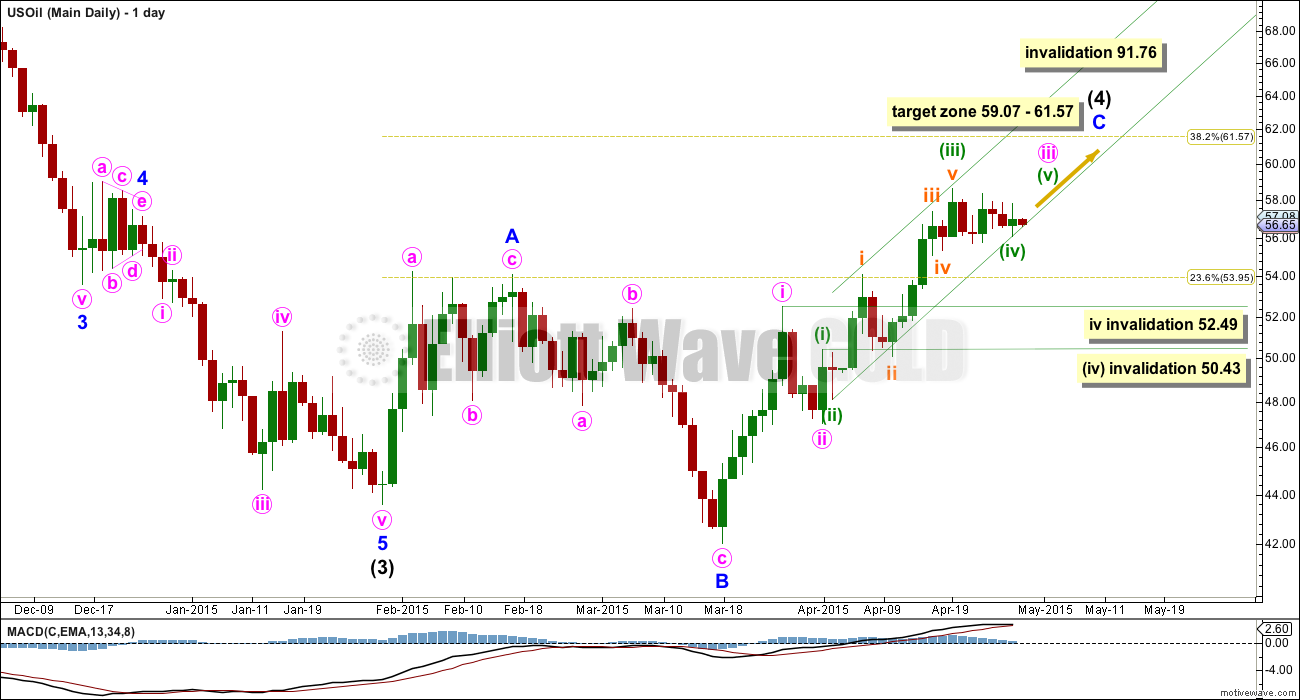
Intermediate wave (4) is unfolding as an expanded flat correction. Minor wave B is a 115% correction of minor wave A. Minor wave C would reach 1.618 the length of minor wave A at 59.07. This is the lower edge of the target zone.
Minor wave C must subdivide as a five wave structure. So far within it minute wave iii is incomplete. Minor wave C needs minute waves iii, iv and v to complete.
Within minute wave iii minuette wave (iv) looks like it is subdividing as a triangle. It may not move into minuette wave (i) price territory below 52.49.
When the triangle is complete for minuette wave (iv) (it may already be complete, if not it should be over very soon) then minuette wave (v) up should complete minute wave iii.
Minute wave iv may not move into minute wave i price territory below 50.43.
When minute wave iii is complete redraw the channel: the first trend line from the high labelled minute wave i to wherever minute wave iii ends, then a parallel copy on the low of minute wave ii. Use this channel to show where minute wave iv may find support, and where minute wave v up may find resistance.
Only after the structure for minor wave C can be seen as a complete impulse, then when that channel is clearly breached by a full daily candlestick below it and not touching the lower trend line, that shall provide earliest confirmation that intermediate wave (4) is finally over and intermediate wave (5) down has begun.
So far intermediate wave (4) is in its twelfth week. It may end in one more week to total a Fibonacci thirteen.
Papudi–as Lara only does oil analysis about once per month who is best source for ongoing oil analysis?
I do not know any one EW analyst for US Oil. Rambus tracks US oil but he is chartist. so am I.
Tomorrow I am going to post WTIC chart superimpose Lara’s wave counts from past same chart below in my earlier post. but updated.
Plus I am soon will take position in SCO post FOMC.
Lara- Pls update as to wave iv completion??
Daily candle appears it is below not touching the TL.
My TA is indicating a new update between 1 to 3 weeks based on historical trends.
US Oil WTIC weekly price hit the upper trend line and bounced below. Need bearish divergence and break below daily channel to enter short : DWTI or SCO.
Hi Lara I am watching US oil w/grear interest to trade from short side. Today I believe atleast on my chart oil breached the bottom line.
An update by a daily chart will be appreciated.
Capstick has same request.
Thanks.
Hi Lara, congrats on passing L2 CMT exam. Oil has breached target zone slightly so probably need to update again.
Lara, can you check your weekly chart for me… My results for fib retrace 38.2% = 68.06 whereas you have 61.57 for black 4 retracement level.
Is this my error or…..?
EDIT: Sorry I found my mistake. I was drawing the line from wave 1 to 3 incorerrect starting point.
Lara I can not duplicate your weekly chart using stockcharts.com for WTIC oil. Over longer period it is completely different.
The chart is shown below.
The tend line well above the price points on your chart. Pls I am not asking to analyze my chart.
It is the data feed difference.
On 19 March my data feed for Stockcharts.com shows:
$WTIC
O 46.61
H 46.81
L 44.77
C 46.6
Yesterday:
O 56.93
H 59.33
L 56.4
C 58.53
Yes wave c of expanded flat is alm0s there. Now need to see reversal candle here.
Lara can it still go much higher?
Thank you Lara.
Re-read her answer.
I believe different data feeds have slightly different data. However, that was a reasonable distance between the open and close; my data for 19th March shows the following:
Open 44.63
Close 45.57
High 46.72
Low 44.61
So the range between open and close for my data is 0.94. Which is a reasonable amount for US Oil.
Different data feeds come from different market centres with different populations trading. The market is global, but I think there are often small regional variations.
Not usually that much though! I cannot tell you definitively why the difference for that day may be greater than usual.
If any other members or readers have a better explanation then please do share.
hi Lara, on my chart i see a Red candle on 19th March. Even online it is showing the same. How come on your chart it is a Green bullish candle?
Hi Lara, i have previously asked this but my doubt is still not clear.
The chart i use or what i see online (on a website) looks different than what you publish here. How could this happen?