
Both bull and bear Elliott wave counts remain valid. Price has not yet told us which one is correct. I am concerned that volume is lower for Monday’s down day.
Summary: In the short term, both wave counts expect downwards movement from here. The short term target for the bull wave count is 1,172, and for the bear wave count the middle of a third wave needs to begin to a possible target at 1,139. The bull wave count expects a new low below 1,169.94 is highly likely to avoid a truncation, so a new low below this point is a minimum expectation for some more downwards movement.
Click on charts to enlarge.
To see weekly charts for bull and bear wave counts go here.
Bear Wave Count
I am concerned that volume for Monday’s down day is lower. For this reason I will judge the bull and bear wave counts to be about even in probability at this stage.
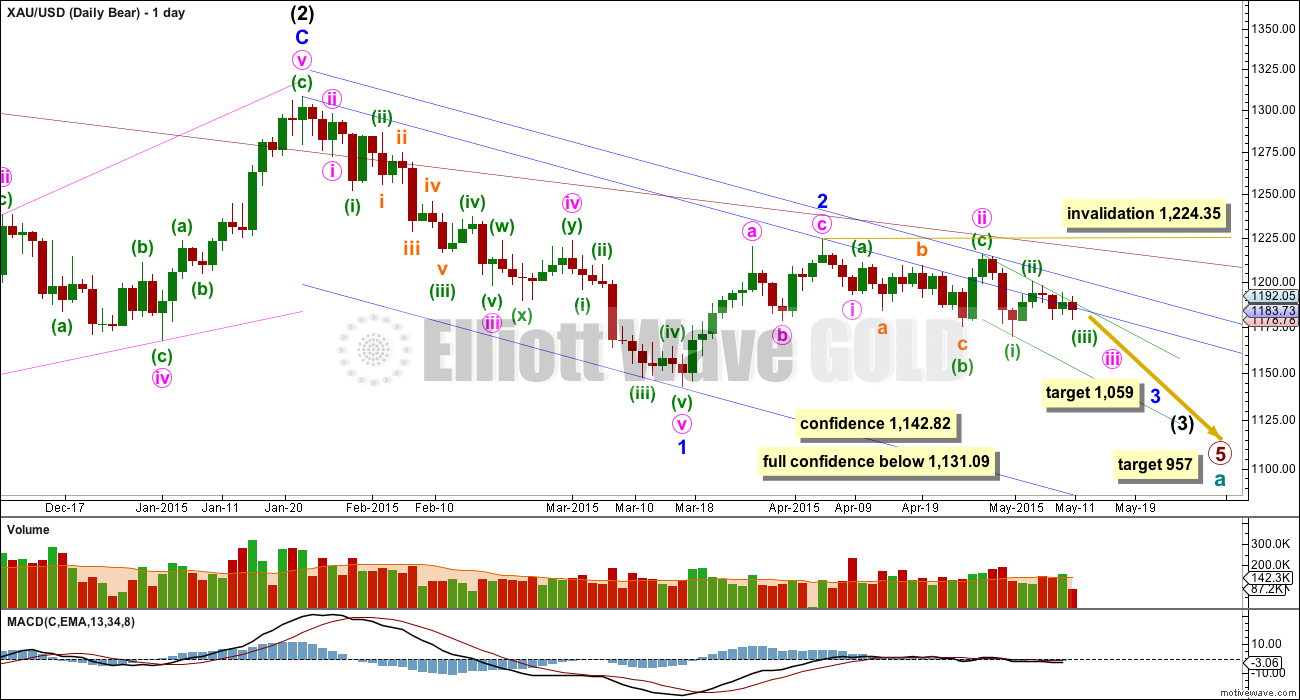
This wave count follows the bear weekly count which sees primary wave 5 within cycle wave a as incomplete. At 957 primary wave 5 would reach equality in length with primary wave 1.
Pros:
1. Intermediate wave (1) (to the left of this chart) subdivides perfectly as a five wave impulse with good Fibonacci ratios in price and time. There is perfect alternation and proportion between minor waves 2 and 4.
2. Intermediate wave (2) is a very common expanded flat correction. This sees minor wave C an ending expanding diagonal which is more common than a leading expanding diagonal.
3. Minor wave B within the expanded flat subdivides perfectly as a zigzag.
Cons:
1. Intermediate wave (2) looks too big on the weekly chart.
2. Intermediate wave (2) has breached the channel from the weekly chart which contains cycle wave a.
3. Minute wave ii breaches a base channel about the first and second wave one degree higher, minor waves 1 and 2. It is deeper and longer lasting than normal for a low degree second wave within a third wave one and two degrees higher.
4. Within minor wave 1 down there is gross disproportion between minute waves iv and ii: minute wave iv is more than 13 times the duration of minute wave i, giving this downwards wave a three wave look.
This wave count now expects to see a strong increase in downwards momentum as a third wave unfolds. At 1,059 minor wave 3 would reach equality in length with minor wave 1, and both would be extended.
Within minor wave 3, if minute wave ii continues further as a double flat or combination then it may not move beyond the start of minute wave i above 1,224.35.
Draw a blue base channel about minor waves 1 and 2. Create a parallel copy and push it up to sit on the high of minute wave ii, then copy these trend lines over to the hourly chart. Look for upwards movement to find resistance at the blue trend lines.
Gold remains range bound. Although volume for Monday is lower than the prior up day, overall volume within this range is still highest on down days. This may indicate that the breakout when it finally comes is more likely to be down than up, but today that is not as clear as it was a few days ago.
Within the bear wave count there are now seven overlapping first and second waves. This indicates explosive downwards movement ahead, but it keeps failing to materialise. The bull wave count must be taken seriously while the bear wave count is failing to prove itself.
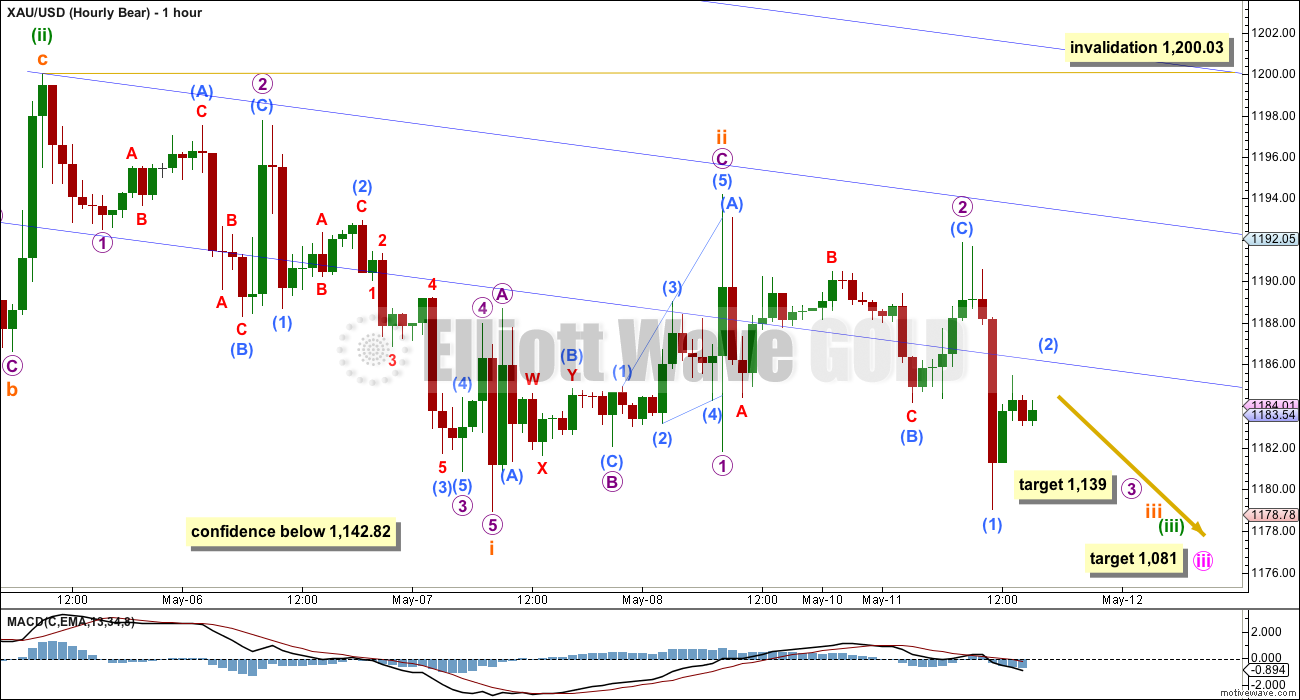
Only a new low below 1,142.82 would provide price confirmation of the bear wave count. While price is above that point both wave counts will be valid.
For the bear wave count the middle of the third wave is likely to be very extended. At 1,139 micro wave 3 would reach 4.236 the length of micro wave 1.
This target fits nicely with the lower target for minute wave iii to reach 4.236 the length of minute wave i at 1,081.
In the very short term submicro wave (2) may not move beyond the start of submicro wave (1) above 1,191.84.
However, I will leave the invalidation point for the bear wave count at the hourly chart level at 1,200.03 today. It is possible that subminuette wave ii is not over and is continuing to drift sideways. This may explain lower volume for Monday if it is still within a small correction.
Bull Wave Count
This new bull wave count was presented as an update over the weekend. It has a much better fit and higher probability than the prior bull wave count.
The bull wave count sees primary wave 5 and so cycle wave a as a complete five wave impulse on the weekly chart. In order for members to judge for themselves I will list all points for and against for bull and bear wave counts.
Pros:
1. The size of the upwards move labelled here intermediate wave (A) looks right for a new bull trend at the weekly chart level.
2. The downwards wave labelled intermediate wave (B) looks best as a three.
3. The small breach of the channel about cycle wave a on the weekly chart would be the first indication that cycle wave a is over and cycle wave b has begun.
Cons:
1. Within intermediate wave (3) of primary wave 5 (now off to the left of this chart), to see this as a five wave impulse requires either gross disproportion and lack of alternation between minor waves 2 and 4 or a very rare running flat which does not subdivide well.
2. Intermediate wave (5) of primary wave 5 (now off to the left of the chart) has a count of seven which means either minor wave 3 or 5 looks like a three on the daily chart.
3. Expanding leading diagonals are are not very common (the contracting variety is more common).
4. Minor wave 2 is now much longer in duration than minor degree corrections within impulses normally are for Gold.
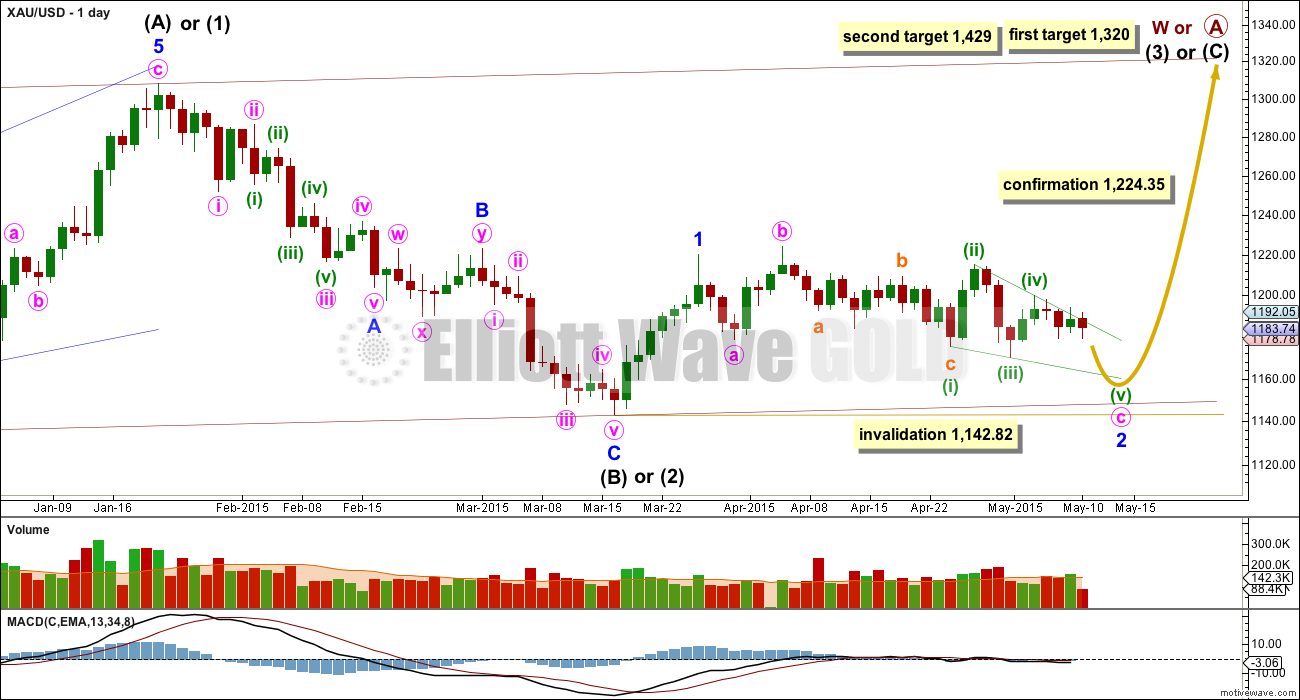
Within cycle wave b primary wave A may be either a three or a five wave structure. So far within cycle wave b there is a 5-3 and an incomplete 5 up. This may be intermediate waves (A)-(B)-(C) for a zigzag for primary wave A, or may also be intermediate waves (1)-(2)-(3) for an impulse for primary wave A.
Intermediate wave (A) subdivides only as a five. I cannot see a solution where this movement subdivides as a three and meets all Elliott wave rules (with the sole exception of a very rare triple zigzag which does not look right). This means that intermediate wave (B) may not move beyond the start of intermediate wave (A) below 1,131.09. That is why 1,131.09 is final confirmation for the bear wave count at the daily and weekly chart level.
Intermediate wave (B) is a complete zigzag. Because intermediate wave (A) was a leading diagonal it is likely that intermediate wave (C) will subdivide as an impulse to exhibit structural alternation. If this intermediate wave up is intermediate wave (3) it may only subdivide as an impulse.
At 1,320 intermediate wave (C) would reach equality in length with intermediate wave (A), and would probably end at the upper edge of the maroon channel. At 1,429 intermediate wave (C) or (3) would reach 1.618 the length of intermediate wave (A) or (1). If this target is met it would most likely be by a third wave and intermediate wave (C) would most likely be subdividing as a five wave impulse.
This new bull wave count now sees minor wave 1 as a short impulse, and intermediate wave (C) or (3) as an impulse.
Minor wave 2 is an incomplete expanded flat correction. Minute wave b is a zigzag, which looks right on the daily chart. Minute wave c is an ending contracting diagonal. Contracting diagonals most often end with an overshoot of the 1-3 trend line, so I will look out for downwards movement to overshoot that lower green (i)-(iii) trend line before expecting that minor wave 2 may be complete.
Minor wave 2 may not move beyond the start of minor wave 1 below 1,142.82.
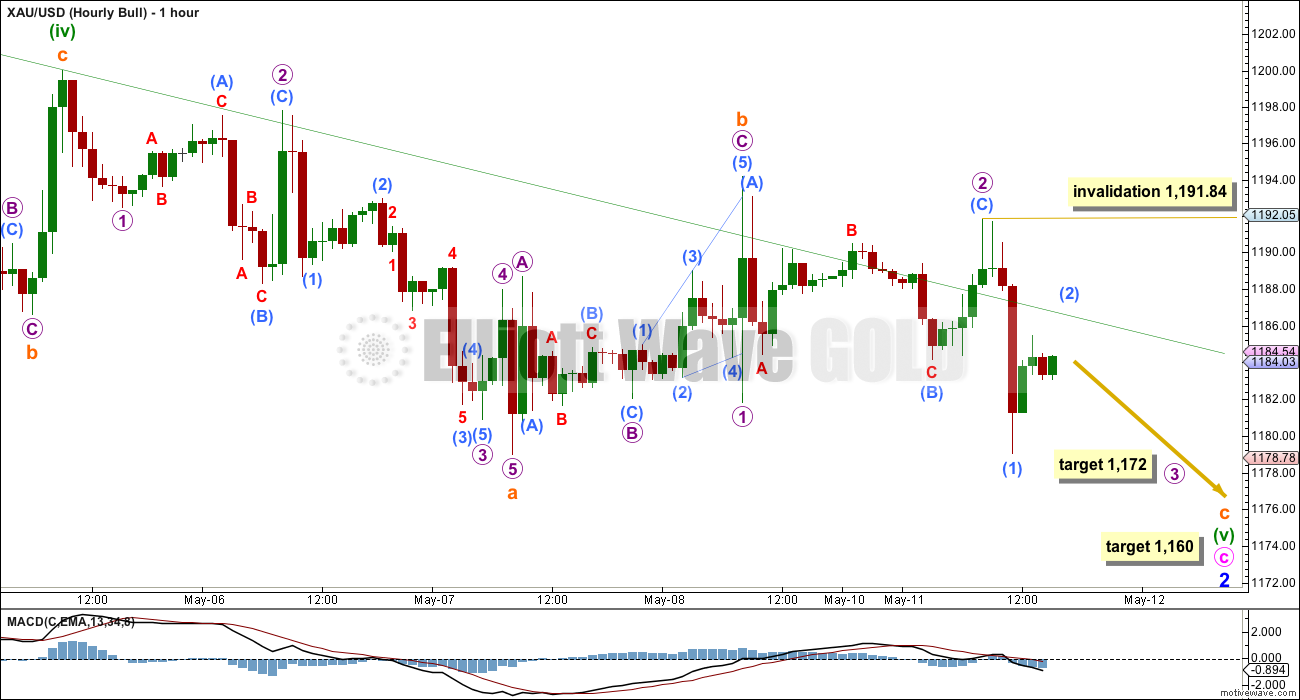
Minuette wave (v) must subdivide as a zigzag because this fifth wave is within an ending diagonal. So far subminuette waves a and b are most likely over.
Diagonals normally adhere well to their trend lines. For this bull wave count I wouldn’t expect more than a few overshoots of the upper green (ii)-(iv) trend line.
The wave count in the short term sees the subdivisions mostly the same. For this bull wave count subminuette wave c must subdivide as a five wave structure. Within it at 1,172 micro wave 3 would reach 1.618 the length of micro wave 1. When micro wave 3 is complete then the following correction for micro wave 4 may not move back up into micro wave 1 price territory above 1,181.80.
At the time preparation for this analysis both wave counts see submicro wave (2) as incomplete. It may not move beyond the start of submicro wave (1) above 1,191.84. I will put the invalidation point here on the hourly chart for this bull wave count because movement above 1,191.84 would see a big breach of the diagonal (ii)-(iv) trend line which would give this structure the wrong look.
The target for downwards movement to end for this bull wave count remains the same at 1,160 where subminuette wave c would reach 1.618 the length of subminuette wave a. This target may be met in four days if minuette wave (v) totals a Fibonacci eight days, if this expectation is wrong it may be too long. Minuette wave (v) may end more quickly than that.
The target for minor wave 2 to end at 1,160 would see minuette wave (v) move beyond the end of minuette wave (iii) at 1,169.94 avoiding a truncation. It would also see minuette wave (v) of this contracting diagonal overshoot the (i)-(iii) trend line, this is the most common look for a contracting diagonal.
This analysis is published about 04:16 p.m. EST.
After more work I’m going to keep the bull wave count above as an alternate. Minor wave 2 could continue lower with an ending diagonal for minute wave c, if minuette wave (iv) is moved to today’s high… and may yet move a little higher.
The upper limit for minuette wave (iv) is no longer than equality in length with minuette wave (ii) because the diagonal would be contracting. That limit is at 1,209.86. The diagonal trend lines must work; they must converge and they cannot be breached, the diagonal must adhere well to its trend lines.
Lara comments – bullish maybe heading up and bearish should have a small final fifth wave up to complete the five wave impulse.
Not good for bearish, I definitely won’t buy anything and if DUST goes up before the close I may sell it so no overnight surprise.
I decided to keep my DUST as DUST didn’t go up before the close and was only 13 cents off the day’s low, and Lara quickly decided that the bull wave count will stay as an alternate, and the super indicator guy is keeping his large quantity of JDST overnight, also I don’t have a lot of DUST so will keep it overnight.
The bear count remains the same, the mid term target remains the same at 1,081. However, volume is not currently supporting the bear wave count. For the last three days it is up days which have the strongest volume. Overall in this sideways chop though it is still down days with the strongest volume, particularly on 29th and 30th April.
For the bull wave count I must revert to the prior idea of a leading diagonal. To see minor wave 1 complete as labelled in the chart above (at 1,220 on 26th March) means that minor wave 2 no longer makes sense. I can no longer find any corrective structure (even a rare triple) which will fit in that chop and meet all EW rules.
For the bull count the only wave count I have left now is a leading diagonal in a first wave position, within it a third wave up should be beginning. Minute wave iii must move beyond the end of minute wave i above 1,224.35. The invalidation point (short term, hourly) will be at 1,169.94.
So now I’m back to where I was a few days ago, waiting for the breakout either above 1,224 or below 1,169 and looking at volume and other indicators to tell which direction is most likely.
One possible explanation for volume
Re:Apr 29th – FOMC announcement aftermarket,Apr 30th
Lara
Has the bearish targets changed because of today. Has gold likely already peaked during market hours at 1195.50 at 11:47 am so minimal change of exceeding 1200.03? So from here on may gold be trending down again for perhaps a few days to either 1160 or 1139? Because the hourly bull wave count was invalidated would it still be near term bearish or might it have changed to more bullish? Some bearish investors are torn between selling or buying more bearish ETFs.
The mid term bear target at 1,081 remains the same.
For the bear count I have subminuette wave ii continuing as an expanded flat, and now it’s within the C wave up which should have a small final fifth wave up to complete the five wave impulse.
For the bull wave count I’m working on it. That diagonal now looks all wrong. When I have found a solution I’ll let you know.
Even if one think bull wave count s the way.
Above Lara wrote: The bull wave count expects a new low below 1,169.94 is highly
likely to avoid a truncation, so a new low below this point is a minimum
expectation for some more downwards movement.
Any one what is the daily volume today? May be higher than yesterday???
It’s higher than yesterday. I have it at 151.1, yesterday at 90.2 (down day) and the day before (up day) 157.2.
ouch!!!!
The reality of the Gold and US dollar relationship or correlation.
Those that don’t believe there is any won’t change their minds.
Those that do believe that it exists won’t change their minds.
Unless there is a life changing event that alters their perception and belief.
For two years I would 100% deny there was any relationship or correlation.
Until on my TOS trading platform with /GC (gold) I added compare with $DXY, (US dollar index). Then the FOMC news or minutes is released at 2:00 pm and I instantly see /GC and $DXY head off at high speed in opposite directions like magnetic opposites.
$DXY is down 2% in 10 minutes and gold is up $20 in 10 minutes.
This inverse effect is most noticeble at big US news releases and still noticable all day long of all trading days.
There is no exact fixed % and may be a delay in the inverse movements.
However in 10 minutes that clearly changed me into a 100% believer in gold/US dollar inverse effect. It is important and ignored at one’s own peril.
On days when the US dollar is climbing with strength I know enough not to be bullish in Gold unless it might be buying gold at a near term bottom with gold expected to head down.
I’m not looking to change even 1 person’s mind, I’m just sharing my experience.
Super indicator guy bought JDST at it’s low of today.
Thanks for sharing. What is yr opinion??? I am sticking w/shorts one more day pending Lara’s a note before market close.
I agree
Does he deal w/ PM shorts only or analyses Gold and other????
In gold only GLD, GDX, GDXJ and their 3 x.
He does many other aspects of the market like oil, and even some wild company jumping 100% in a day that his indicator might pick up. He made 200% in a four day trade from one company that he watching and finally took off so he jumped in.
I still think the GDX is making a corrective bearish backtest move in progress ahead of an impulsive move down shortly. Patience….nothing in this structure has become bullish in my opinion.
fractal shows up well on HUI.
back to the parade of bearish flags at resistance on the hourly GDX. Again, I’m settled into my position and just being patient.
Richard
Gold overshot fib .618 and now down below that level to 1192.58
MAY be sm wave 3 has begun.
Do you think to unload shorts her before close????
Looks to me like gold is heading lower since 1195.50 at 11:47 am and US dollar is moving up since 12:20 pm and bear counts not invalidated, and my super indicator guy said this morning he was looking to bargain hunt and buy JDST today but no word yet, giving me 4 big signs of relief about my DUST.
I’ll wait for Lara comments before close before making any trading decision. Otherwise if I sold DUST here it would be close to it’s 3 day low but the bearish target are still in effect.
GDXJ is on its third attempt to deal with this Andrew’s Pitchfork:
https://www.dropbox.com/s/i07ecnvhrvfv1z6/GDXJ.jpg?dl=0
I am going to go out on a limb here and say that upward corrections are now over. Look out below!
I am thinking one more move above 1200 is coming .
If that is true, then we would need to scrap everything and start over.
Yeah well , it is not a big deal . I don’t trust EW to correctly predict the format of a correction .
Either way, this upward movement is pretty unconvincing and weak. Gold is just (inversely) tracking the dollar today, nothing more. There is no power behind it.
I told you on friday I guess
Unconvincingly . Plus you don’t clarify how long it will last .
Right.. But i told you its gonna buy.. Now if structure in 4h is broken and support tested. we could see testing of 1209-1215 again…
Last week closed at 1189 . Is now 1193 . So far you have successfully predicted a 4 point move .
This might be in play
I hope 30 point move is enough for buy call
Odds are it won’t. I am dreading that possibility and will sell my DUST if gold goes above 1200.03 invalidation point, which I hope doesn’t happen. Thankfully I only have a little DUST.
I would agree with you fibonacci retracement wise.
However the US dollar index $DXY .94317 is near it’s low of the day during market hours, not a good sign if good needs to drop. Oil is also up today which moves gold up as well. I think we need some fresh analysis from Lara.
….and here comes the dollar again!
Agree reluctantly!!!!!
1197.23 high at 6:10 am
1188.19 low at 9:22 am
1197.23 – 1188.19 = 9.04 x .618 = 5.59 + 1188.19 = 1193.78 is .618 target
Then gold may drop?
Yes. Drop in submicro 3 of micro 1 of subminuette 3. First “larger” drop!
Thanks Tham.
Richard
Your friend was 100% correct getting out of shorts. I thought I will weather the bounce of min wave 2.
Tham
Per your plan for bear min wave 2 is wxy. Y at 1197.23. Now sm 1 down to 1188.19 and sm 2 upto 1191??? Then the sm 3 begins to Lara’ low 1160 or 1139 ,
Thats how I read your comment.
LARA: I will leave the invalidation point for the bear wave count at the
hourly chart level at 1,200.03 today. It is possible that subminuette
wave ii is not over and is continuing to drift sideways.
Hi papudi.
Not yet. I expect the downside move to take a longer time. 1188.19 may only be the third (more likely, or the first as you say) wave of a lower degree. My initial expectation is for the bear to move down to 1174 for the first wave, and 1183 for the bull. Both are 5-wave affairs, the second “5” of 5-3-5 for the bear, and wave 3 (must be 5-wave impulse) for the bull.
I would think subminuette 2 is over at 1197.23. (Sigh of relief!). I can’t see what would happen if otherwise. It would probably be a complete overhaul of both counts (and back to the drawing board, ugh).
Update: I think you are right. It is the first wave of one degree lower. Somehow, I failed to notice the bullish hammer at 1188.19.
So sm 3 should begin here some where below 1193 a fib ret .618 from 1188.
I agree.
Yes it began at 1195.50 at 11:47 am EST gold market high of the day.
US dollar finally began it’s ascent at 12:20 pm.
Tham, thank you.
I’m seeing the USD$ returning to its downward channel. If the dollar keeps moving downward toward the .382 retrace of last year’s rise, how could gold continue downward is my concern at this time. You are so good at the analysis, do you have a belief in the dollar/gold correlation?
ok whipsaw song time
This is my view of the spike to 1197.23.
Provided price does not move higher than 1200.03, both bear and bull counts are still valid.
For the bear count, subminuette 2 continued on a WXY combination : 1178.97 – 1193.94 – 1179.03 – 1197.23? The ending is pretty close to 1,236 retrace (at 1197.53). The continuation was a possibility mentioned by Lara. This wave 2 movement could account for the choppy action as well as the low volume yesterday. The continuation would see three more waves sm3, sm4 and sm5 to complete minuette 3 at Lara’s target of 1139.
The bull count is largely similar. Minute C is an ending diagonal. Minuette 5 needed relabelling as a 3-wave zigzag (1200.03) – subminuette a (1178.97) – subminuette b (1197.23?). So, only the triangle presented yesterday has been voided. The continuation would see minuette 5 and hence minute c and minor 2 completing at Lara’s target of 1160.
Now, this count makes more sense. Good luck, everybody.
Thanks Tham. Seems reasonable
Thanks Tham. U R an asset to this board like all others whose opinions I value.
Di bear wave 2 have right structure of impulse 5 up?
Thanks papudi for your kind remarks.
I would say bear subminuette 2 unfolds in 3 waves as it appears to be 5-3-5.
Tham, thank you.
I’m seeing the USD$ returning to its downward channel. If the dollar keeps moving downward toward the .382 retrace of last year’s rise, how could gold continue downward is my concern at this time. You are so good at the analysis, do you have a belief in the dollar/gold correlation??
To me, markets have mathematical relationships only within themselves. I don’t believe in inter-market analysis in terms of correlation as expounded by some analysts. The only correlation I can see is a result of the finite amount of money that investors can have for the market as a whole. It is a zero-sum game. That means, when the Fed “pushed” folks feverishly into stocks, there will not be enough money to go round to other markets. So, gold and USD can have an “inverse” relationship (in some loose range, not a fixed value) for some part of the year, and may move in tandem in some other times.
USD is seen by investors as a hedge (as is the lazy man’s investment in bonds), and rises in times of high uncertainty (such as an imminent war). It can also be political in that politicians can talk up or talk down the dollar. Alternatively, it can be manipulated by fiscal measures.
mathematical relationships only within themselves. ah. something for me to chew on.
Mathematical relationships as in Fibonacci ratios between waves in EW. Also, if you use Gann charts (which I have not have the time to study) in which they use fan lines and Gann angles, more complex and you would need a graphical software to compute (else do by hand, more tedious). I can work Fibonacci ratios using Excel or even a calculator.
I believe that the dollar will move up from here. It is not yet clear to me if it will make new highs, but it is set for a bounce higher regardless. There is an index on Kitco to show you the daily percentage change of gold which is directly attributed to the dollar.
I think gold will resume its downtrend as soon as tomorrow.
i sure hope so. I’m still holding a small DUST position that I entered too soon. kicking myself cause i didn’t follow my own charting advise.
Are you talking bounce on dollar as in out of its daily downtrend? cause right now today it just went back into its downward channel
I think that the dollar could move up substantially in the coming days. At the very least it should clear its May high.
During market hours at 12:20 pm the US dollar bottomed and been going up since as of 2:04 pm
besides, dollar candlestick pattern is making bear falling three… looks to me like dollar will fall from here.
Oh, there’s one other important point I forgot about. In US market, gold is traded in USD. So, if USD drops, and if gold movement is independent of USD movement, then gold priced in USD may rise. (As a ratio, gold in USD will drop if the intrinsic price of gold falls faster than USD). That may give the illusion that gold bears an inverse relationship to the USD.
oh all right, they don’t have a relationship. They have a correlation. 🙂
correlation: “the degree to which two or more attributes or measurements on the same group of elements show a tendency to vary together”
I’m discarding the wave count presented in this analysis with the ending diagonal for minute wave c to complete minor wave 2 (bull wave count) because of the breach of the diagonal trend lines.
Within the final wave of the diagonal, minuette wave (v), this upwards movement for today has clearly and strongly breached above the (ii)-(iv) green trend line of the diagonal. It looks all wrong.
Unless minuette wave (iv) of the diagonal is not over and is moving higher. It needs to be shorter than minuette wave (ii) because the diagonal is contracting… which gives it a limit at 1,209.86. The diagonal trend lines also need to converge.
Subminuette ii may still be moving sideways.
I added to my long position in premarket. Now about 90% into my position.
Is bear wave 2 target hit?
Bears should start imagining an upside move from here, otherwise they risk being left in the DUST. We still need higher for a true break, but the move looks impulsive.
Richard
Your friend was correct yesterday to get out of shorts. Did you also??
may be wave 2 is completing here and wave 3 down begins for both bull/bear?????
Looks lIke Gold setting coiling up for a launch to the upside
Time to take a better look at the Bull set up perhaps
Looks to me like both bull and bear hourly are invalidated with this spike to 11196
For bear invalidation is 1200.03
Hourly wave count for bull got invalidated. Wave 2 in action and soon wave 3 will begin at 8 AM may be???????
didnt you get my answer yesterday?
what was the answer?
about COT analysis. i posted it on 8th mai analysis.
thanks
ups did see it too late. no problem
here again for you. my post from yesterday. that should answer your quetsion if we see a wave 3 starting down soon.
the only reason why i use COT-data is the manipulation. this is the only reason why i can be that accurate.
“Yes at the extreme top or bottom COT report helps what to come like in
Jan when gold topped at 1307 and comm were short highest amount of
contracts: 422000.”
you will never hit a top with this statement.only watching commercials compared to specs or even alone is senceless and useless for trading.
you will never be able to identify the top cause the highs of shortpositions by the commercials are allways different levels.
you cant say xxxxxxxx contracts by commercials will be the top.
it only gives you a broad overview about sentiment nothing else.
the significannce is the pricechange relatively to positionchange at the futuremarket and the behavior of some banks.
very important to understand too is that watching gold only is even senceless and useless.
you have to watch gold and silver cause this markets are different and
cosequently the manipulation is different.
for a trendchange to the upside both datas have to look good not only Gold
we will never have a big rise in gold when JP Morgan is 50 days short of
worldproduction in Silver perspectively the big 8 some around 80 days
and therefore this little covering we saw in gold has no sigificance even more when you understand that the manipulation in gold is over the
physical market the most part and only on significant chart levels or at
the end of a rally some banks raise their positions.
also we will never have a big drop with this kind of low long position by the specs in Gold.
for that reason im sure that Lara ‘s counts are still wrong even if im sad to say this.
if there will be no exogenous event we very likely will have another
sideways/upwardphase to get some longspeculators into gold probably a
false breakout to the upside with a target around 1240 or 1250.
Silver could see 18 dollars by a spike but 17,50 should hold.
so overall a slight rise is the most likely scenario for now for the next weeks.
Bonds getting hit again tonight…something doesn’t seem right with the stocks/bonds/currency/commodities… i would expect Gold to be getting hit harder the way bonds are dropping/yields rising. Maybe its coming in the next few days like Lara’s analysis illustrates.
Hi. Just a view: Gold price seems to be hard pressed for direction and keeps giving out mixed signals!…. Very confounding and hard to follow lol…. Gold price remains bearish down trending but SlowK is starting to show the market is oversold. A good downward move is possible without SlowK being oversold however the short term trend looks a little bottomy; a bottom may not be far off?…..For now 1185-86, 1188-89 with 1193-94 on the outside appears limiting and a break below 1180, 1178-77, 1172-71 is what is required….. Bond yields are expected to continue to rise – that should take the USDI up putting pressure on Gold price to fall…. It’s a mixed bag all in all! With Gold price well below the moving averages I would keep it short with upside risk 1208-09 with 1215 on the outside.