
Downwards movement was unexpected, although some upwards movement was allowed for in the bear Elliott wave count.
Summary: I have three wave counts for you today. The very short term expects a fifth wave up. Thereafter, the wave counts diverge. The bear wave count still requires a strong third wave down which keeps failing to eventuate, and volume is no longer clearly supporting this wave count. I have two bull wave counts: one expects a third wave up must end above 1,224.35 and the other allows for a second wave correction down to end below 1,169.94. While all three wave counts remain valid we must let price tell us which one is correct. Gold remains within a sideways range and the breakout still has not happened.
Click on charts to enlarge.
To see weekly charts for bull and bear wave counts go here.
Bear Wave Count
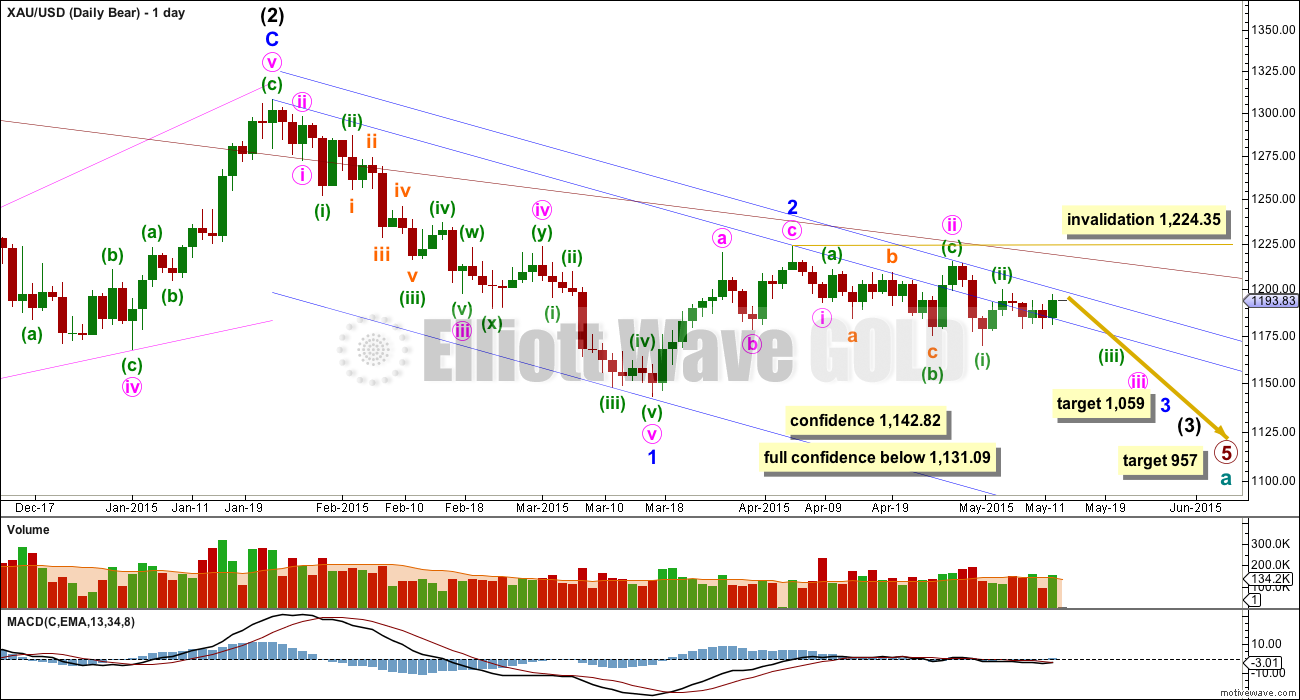
I am again concerned that for the last three days it is up days with the strongest volume. If this bear wave count is correct volume should be strongest on down days, not up days. The strong third wave down keeps failing to eventuate. It may still do so, but the longer it takes and the increasing number of time consuming deep second wave corrections this wave count sees the lower the probability of a downwards breakout. This wave count requires a new low below 1,142.82 for confidence.
This wave count follows the bear weekly count which sees primary wave 5 within cycle wave a as incomplete. At 957 primary wave 5 would reach equality in length with primary wave 1.
Pros:
1. Intermediate wave (1) (to the left of this chart) subdivides perfectly as a five wave impulse with good Fibonacci ratios in price and time. There is perfect alternation and proportion between minor waves 2 and 4.
2. Intermediate wave (2) is a very common expanded flat correction. This sees minor wave C an ending expanding diagonal which is more common than a leading expanding diagonal.
3. Minor wave B within the expanded flat subdivides perfectly as a zigzag.
Cons:
1. Intermediate wave (2) looks too big on the weekly chart.
2. Intermediate wave (2) has breached the channel from the weekly chart which contains cycle wave a.
3. Minute wave ii breaches a base channel about the first and second wave one degree higher, minor waves 1 and 2. It is deeper and longer lasting than normal for a low degree second wave within a third wave one and two degrees higher.
4. Within minor wave 1 down there is gross disproportion between minute waves iv and ii: minute wave iv is more than 13 times the duration of minute wave i, giving this downwards wave a three wave look.
This wave count now expects to see a strong increase in downwards momentum as a third wave unfolds. At 1,059 minor wave 3 would reach equality in length with minor wave 1, and both would be extended.
Within minor wave 3, if minute wave ii continues further as a double flat or combination then it may not move beyond the start of minute wave i above 1,224.35.
Draw a blue base channel about minor waves 1 and 2. Create a parallel copy and push it up to sit on the high of minute wave ii, then copy these trend lines over to the hourly chart. Look for upwards movement to find resistance at the blue trend lines.
Within the sideways range, which Gold entered on 27th March, it is still down days which have the highest volume.
Within the bear wave count there are now five overlapping first and second waves. This still indicates explosive downwards movement ahead, but it keeps failing to materialise. The bull wave counts must be taken seriously while the bear wave count is failing to prove itself.
Only a new low below 1,142.82 would provide price confirmation of the bear wave count. While price is above that point both wave counts will be valid.
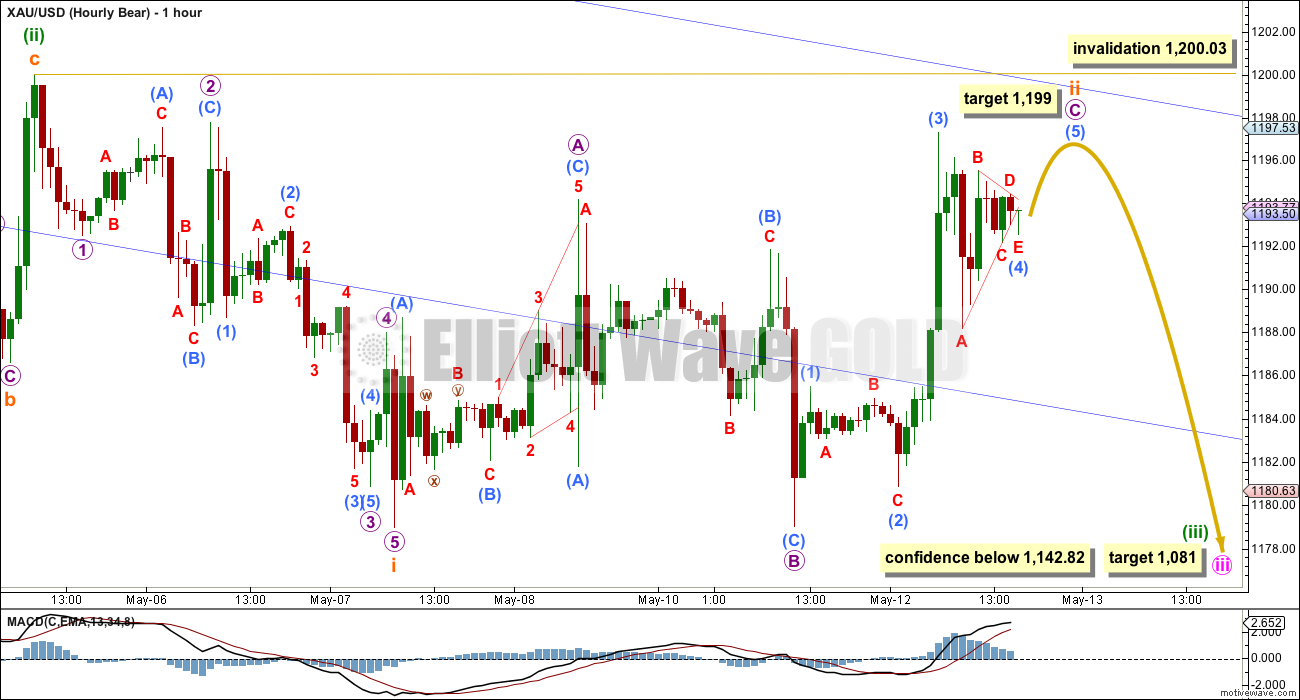
I left the invalidation point yesterday at 1,200.03 for this bear wave count to allow for the possibility that subminuette wave ii could continue sideways which it has. It may be unfolding as another expanded flat correction, which are very common structures. Subminuette wave ii may not move beyond the start of subminuette wave i above 1,200.03.
Within subminuette wave ii micro wave B is a 99.6% correction of micro wave A, so this is a regular flat correction. Micro wave C has moved beyond the end of micro wave A so a truncation is avoided.
Within micro wave C the structure is unfolding as a simple impulse. Submicro wave (3) is just 0.45 short of 2.618 the length of submicro wave (1). At 1,199 submicro wave (5) would reach equality in length with submicro wave (1).
The target for minute wave iii remains the same at 1,081 where it would reach 4.236 the length of minute wave i.
Another time consuming deep second wave correction puts doubt on this bear wave count.
First Bull Wave Count
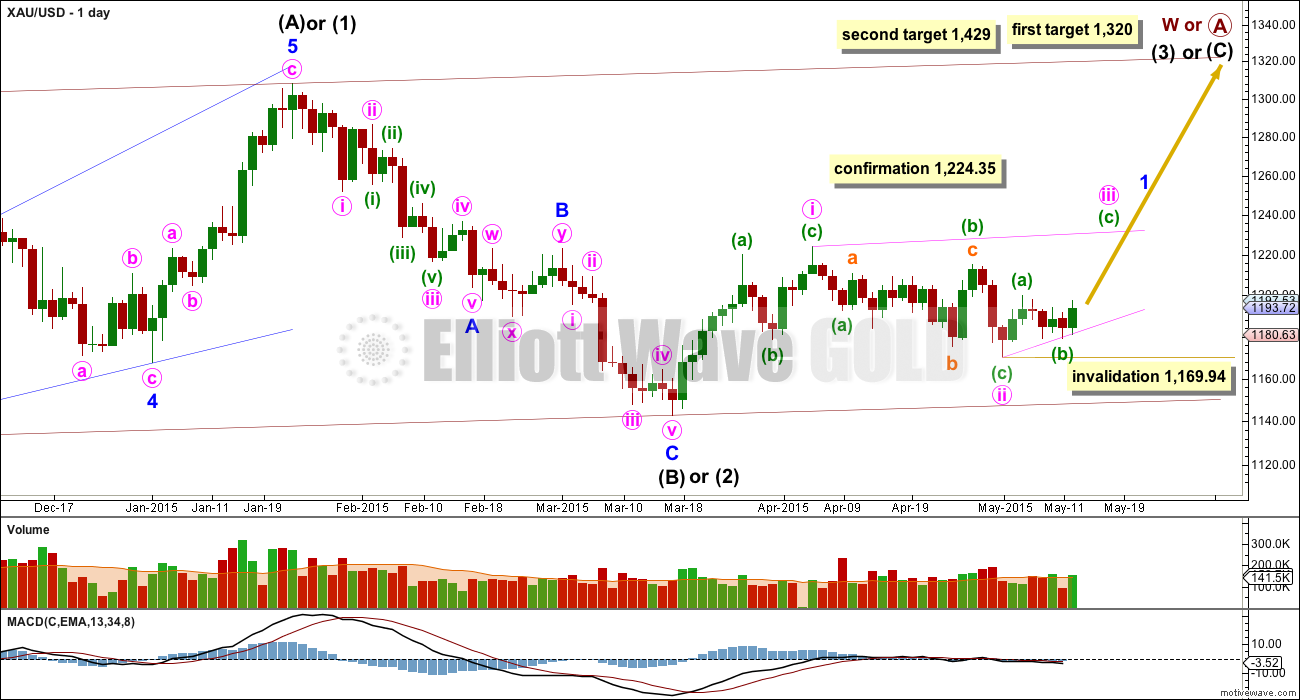
The bull wave count sees primary wave 5 and so cycle wave a a complete five wave impulse on the weekly chart.
Pros:
1. The size of the upwards move labelled here intermediate wave (A) looks right for a new bull trend at the weekly chart level.
2. The downwards wave labelled intermediate wave (B) looks best as a three.
3. The small breach of the channel about cycle wave a on the weekly chart would be the first indication that cycle wave a is over and cycle wave b has begun.
Cons:
1. Within intermediate wave (3) of primary wave 5 (now off to the left of this chart), to see this as a five wave impulse requires either gross disproportion and lack of alternation between minor waves 2 and 4 or a very rare running flat which does not subdivide well.
2. Intermediate wave (5) of primary wave 5 (now off to the left of the chart) has a count of seven which means either minor wave 3 or 5 looks like a three on the daily chart.
3. Expanding leading diagonals are are not very common (the contracting variety is more common).
4. The possible leading diagonal for minor wave 1 and particularly minute wave ii within it look too large.
Volume shows a small increase for an up day, but for volume to clearly support a bull wave count it needs to show an increase beyond that for 30th April which was 187.8K.
Within cycle wave b primary wave A may be either a three or a five wave structure. So far within cycle wave b there is a 5-3 and an incomplete 5 up. This may be intermediate waves (A)-(B)-(C) for a zigzag for primary wave A, or may also be intermediate waves (1)-(2)-(3) for an impulse for primary wave A.
Intermediate wave (A) subdivides only as a five. I cannot see a solution where this movement subdivides as a three and meets all Elliott wave rules (with the sole exception of a very rare triple zigzag which does not look right). This means that intermediate wave (B) may not move beyond the start of intermediate wave (A) below 1,131.09. That is why 1,131.09 is final confirmation for the bear wave count at the daily and weekly chart level.
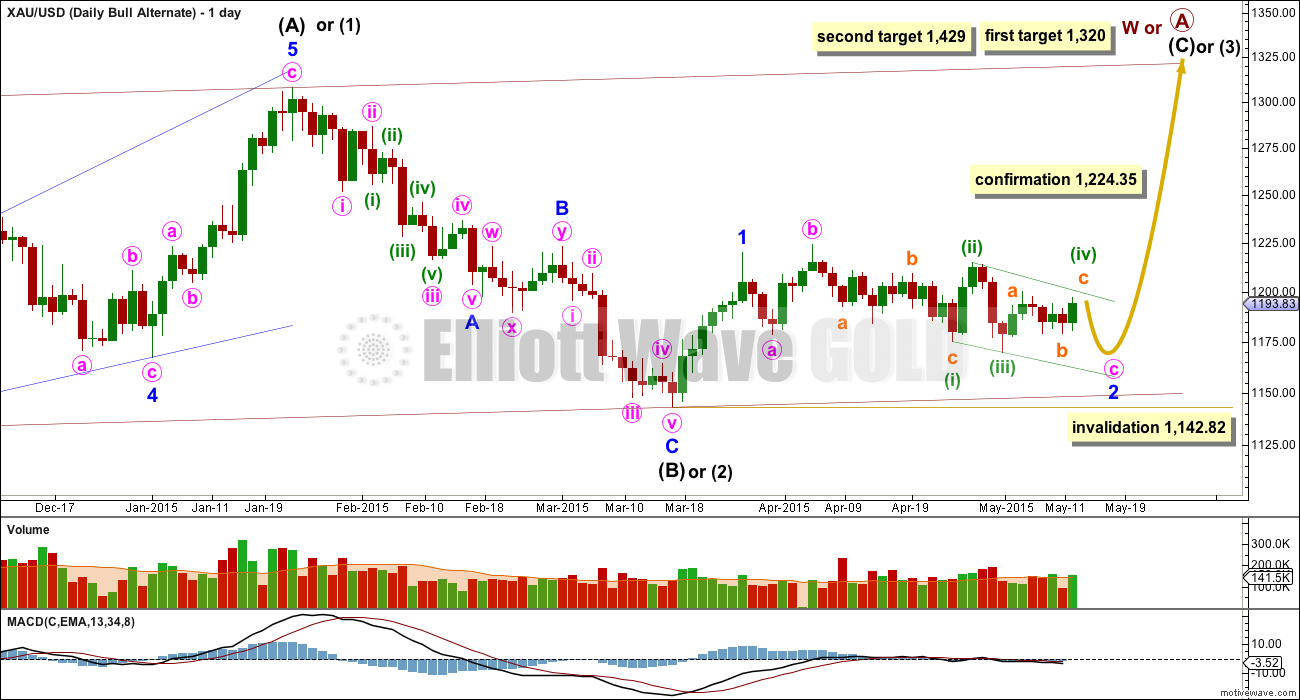
Intermediate wave (B) is a complete zigzag. Because intermediate wave (A) was a leading diagonal it is likely that intermediate wave (C) will subdivide as an impulse to exhibit structural alternation. If this intermediate wave up is intermediate wave (3) it may only subdivide as an impulse.
At 1,320 intermediate wave (C) would reach equality in length with intermediate wave (A), and would probably end at the upper edge of the maroon channel. At 1,429 intermediate wave (C) or (3) would reach 1.618 the length of intermediate wave (A) or (1). If this target is met it would most likely be by a third wave and intermediate wave (C) would most likely be subdividing as a five wave impulse.
It is possible that the intermediate degree movement up for the bull wave count is beginning with a leading diagonal in a first wave position for minor wave 1.
A leading diagonal must have second and fourth waves which subdivide as zigzags. The first, third and fifth waves are most commonly zigzags but sometimes they may be impulses.
Within diagonals the most common depth of the second and fourth waves is between 0.66 and 0.81. Minute wave ii is 0.67 of minute wave i.
Minuette wave (b) may not move beyond the start of minuette wave (a) below 1,169.94.
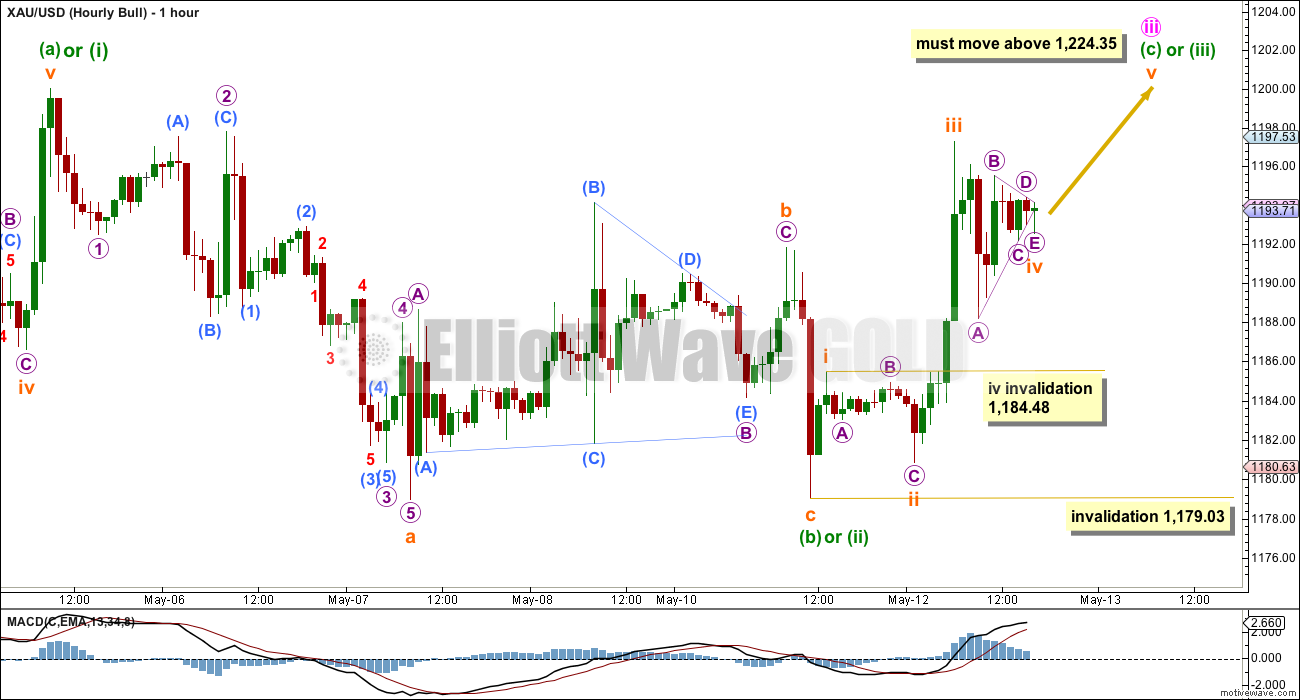
Minute wave iii may be either a zigzag or an impulse, more likely a zigzag.
Minute wave iii must move beyond the end of minute wave i above 1,224.35.
Minuette wave (c) or (iii) is unfolding as an impulse. Within it subminuette wave iv is a small triangle, which looks like it may now be complete. It may not move into subminuette wave i price territory below 1,184.48.
Within minuette wave (c) or (iii) no second wave correction may move beyond its start below 1,179.03.
Second Bull Wave Count
This second bull wave count was presented as an update over the weekend. It looks at an intermediate degree impulse unfolding upwards, with minor wave 1 a short brief impulse and minor wave 2 an incomplete expanded flat correction.
Minor wave 2 is now much longer in duration than minor degree corrections within impulses normally are for Gold.
Within minor wave 2 expanded flat minute wave b is a zigzag, which looks right on the daily chart. The ending contracting diagonal for minute wave c no longer looks as clear as it did yesterday. Contracting diagonals should have converging trend lines, and this one no longer has clearly converging trend lines. Because minuette wave (iii) is shorter than minuette wave (i) this diagonal must be contracting. Minuette wave (iv) has a limit and may not be longer than equality with minuette wave (iii). The upper limit for this wave count in the short term is at 1,209.86.
The diagonal requires a final fifth wave down which may only subdivide as a zigzag. Minuette wave (v) would be highly likely to end below the end of minuette wave (iii) at 1,169.94 to avoid a truncation.
Minor wave 2 may not move beyond the start of minor wave 1 below 1,142.82.
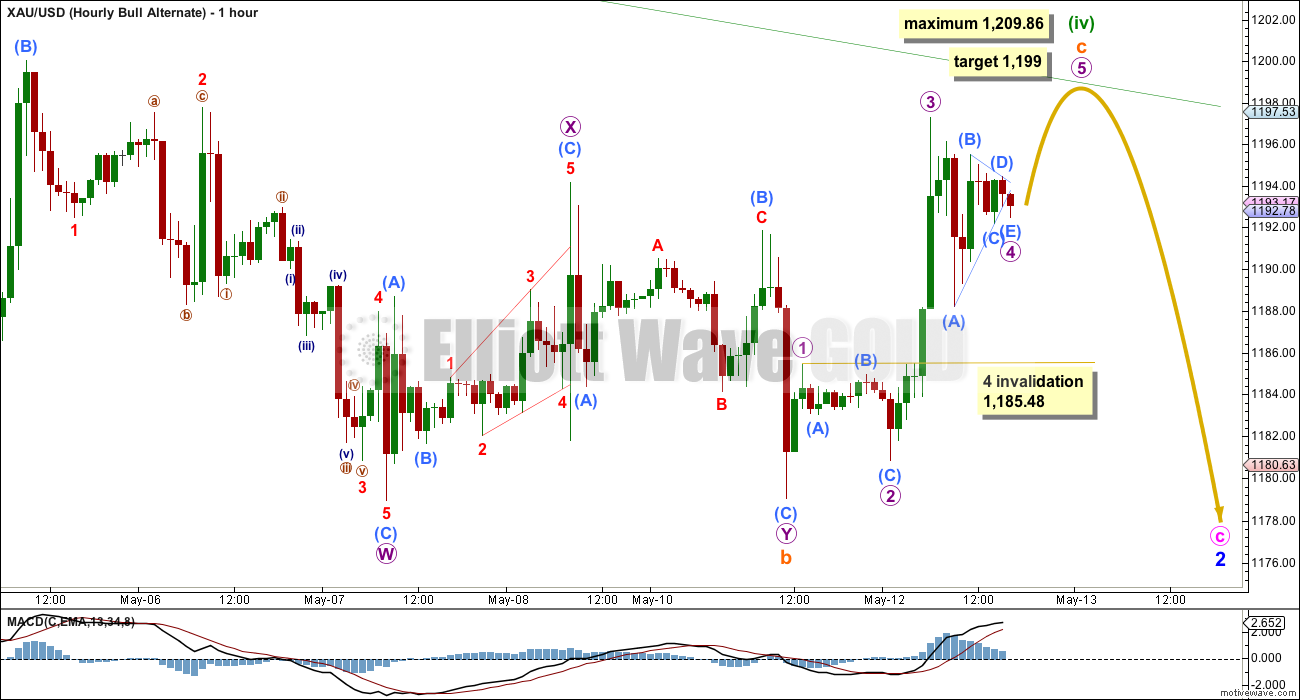
In the short term all three hourly wave counts see a fourth wave triangle completing which should be followed by a fifth wave higher. At 1,199 micro wave 5 would reach equality in length with micro wave 1.
Micro wave 4 may not move into micro wave 1 price territory.
When minuette wave (iv) is complete a final fifth wave down would be highly likely to move below 1,169.94.
This analysis is published about 05:39 p.m. EST.
In the very short term it looks like a five up is complete with a strong fifth wave. So I would expect a correction down from here to either of the 0.382 or 0.618 Fibonacci ratios at 1,204 or 1,194 for the bull count.
The bear count still needs a strong third wave down to eventuate, and it keeps failing to do so. It’s not looking good.
Hi Lara,
the five up complete minute iii?
Minuette (iii) (green). It looks like minute iii (pink) will be an impulse.
thanks.
Lara the bottom of the correction to 1,204 or 1194, any chance that might happen during NYSE market hours Thursday? I’m looking to wait to buy GDX for the strong final fifth wave up.
The second wave showed on the daily chart lasting four days, so the fourth wave should also show on the daily chart and last maybe 2-5 days.
So no. It probably won’t end in one day.
After publishing this comment further work on hourly charts sees the correction a fourth wave. Both wave counts expect a consolidation for a few days, then another wave up for a fifth wave. Analysis is published now.
I will have only two wave counts today, one bull and one bear.
Higher volume today fits the bull wave count, the leading diagonal with a third wave up today shows another small increase in volume.
The bear wave count now has a huge second wave correction at minute degree. I am looking at the weekly chart and the daily chart, and the only other scenario I can see at this stage for the bear wave count is a continuation of minor wave 2. But then again, it would be absolutely huge and looks quite ridiculous.
A break above 1,224.35 would substantially favour the bull wave count.
dsfrospering
Yes you may be right. But look at this monthly chart of dollar (not mine).
Not to mention reverse symmetry once NL is broken no resistance to 121?? Look at the left side USD came down month after month.from 121 to93.8.
agreed. I’m always fascinated by the reverse symmetry and how often it plays out, particularly in the monthly timeframes.
Volume–GDX volume is low but DUST volume is high so which takes precedence as an indicator?
GDX is up and not on impressive volume, smack on resistance in multiple timeframes = bearish. DUST volume is consistent with capitulation volume. As you can see from chart, DUST volume is consistent with bottoming action.
Thanks Mark F
This chart leaves plenty of room on the downside before reversing
It’s all about your trading time horizons.
This chart leaves room for DUST to go down to single digits before reversing, it’s not reassuring at all.
JDST – this is a chart you buy, not sell. You buy support…you sell resistance. I realize everyone is giddy to go long GDXJ and GDX today. That’s the total opposite of the way I trade.
not everyone. 🙂
I agree. I just added a post below of TSI indicator. On JDST in 1 hour RSI 3 and TSI already crossover. Near close if they stay that way m it is a buy with stop below. The only problem w/these is these can open gap down so yr stop will not limit losses.
gaps down if dollar drops overnite, imo
I like the looks of UUP
Along with Lara’s super EW analysis I have been looking at this True Strength Indicator.
Attache is the chart of GLD intra 2 hour. When ever crossover happens for RSI 5 and TSI a short term trade can be placed.
This can be used for any etf,stocks,index,etc.
Some times crossover may not happen during trading hours. It may happen next day at the opening.
papudi that is a complex chart.
Is it making you profits?
Lara’s update will be much appreciated today. 🙂
volume on DUST is huge.
Anyone know how to determine if micro 5 is complete?
Very interesting action to say the least today but all PM shares seem to be pegging resistance to I’m maintaining my short bias. If they eventually break out I will go long. GDX and HUI charts to follow.
As soon as you go long , there might be hope for the shorts yet . So let us know in time , thanks !
When buying support and selling resistance stops making me money you will be the first to know.
lol
HUI daily and monthly
GOLD:USD – more resistance…and negative divergence
The GDX hourly highlights there’s always a fine line between a double top and an ascending triangle poised for breakout. Just trade what happens.
A break above 1208 opened a move to Retest of 1224. Tomorrow price might test 1208-1209 and if that hold then a move upto 1224 expected. If that holds then price can move lower from there but if 1224 breaks then a move upto 1240-1243 is possible.
I may buy GDX when gold retraces back to $1,209 bottom of fourth wave then hold until minuette c or 3 will reach 1227-1228.
I’m curious what Super indicator guy did today, bases on his previous trade he was probably down $30,000 at the open?
Super indicator guy sold JDST at Tuesday close but bought it today and then lost the $20,000 on JDST that he made earlier this week.
Then he went long JNUG and NUGT and will buy on more on dips.
Hi Richard, I hope I’m not being annoying, but yesterday you said ” super indicator guy is keeping his large quantity of JDST overnight”, regardless thanks for your response.
Your right. Apparently he sold half his position last night.
He just said he has been doing some quick flips with DUST and JDST today twice each buying at their lows then selling them when they go back up and almost made up his $20 K loss.
Lara, I am still utterly convinced that gold is in a bear market until it reaches the 1000 area. I say this based on all of my combined studies. I see the current movement as nothing more than a small rally within a larger down trending market.
At this point, it may be easier to simply throw in the towel and say that the bull count won out…..especially if gold clears the 1224 mark, which I think it will (and that’s coming from a bear!). However, I believe that would be too easy.
Is there any way that your weekly bear count could be reworked to fix some of the larger issues that you have had? For example, the overshoot on the weekly chart could be resolved if that were the end of primary 4. Could the 2014 low be the end of the D wave and the 2015 high perhaps be the end of E (primary 4)? The E wave would undershoot the AC trend line of primary 4, which is what it is supposed to do. Could the 2015 high actually be the start of primary 5 and gold is now completing a C wave to finish intermediate 2? The target could be the .618 ratio of the 2015 high to low.
I am fairly certain that one of your subscribers has already proposed this and you probably dismissed it. Whether my suggestion is way off – and I realize that primary 4 would be much longer than 2 and that there are likely countless other errors in my thinking – I would love it if you took a step back to view the weekly charts again.
No need to go through why the scenario above wouldn’t work. All I am asking is that you review the bigger picture again. Something is off here and I know it. I just can’t put my finger on it and need your expertise. Thank you so much.
I am thinking best case scenario is a fake breakout to 1240 area until end of May and then down as per analysis of gunner 24 and which was my original target before I got caught up in this EW mess . Of course we could reverse right here but I am not counting on it .
I wouldn’t call it an EW mess. Ha-ha. The bear count just needs to be adjusted on a wider level. There is a lot to be said for the standard Elliott Wave ratios, the most common of which is a 61.8% retracement. The bear count here has been ignoring that one and has settled for 50%.
Give me a break .
We’re saying the same thing. Gold should get to the 1240s (0.618 of 2015 high to low) before reversing.
your scenario has a very high probability and im sure you will be right. thats exactly what i can watch in the COT report.
i have predicted this for about a month now.
The manipulation in Silver is to heavy for a bigger rise respectively a mid term trend change and for Gold we need another slight rise to get some speculators into the long side to drop em after.
The more I think about it, the 1240s are so widely anticipated as an upside target that gold may need to exceed that area to capture the masses.
Matt, I’m sure Lara has looked many times at all time frames of gold.
Something is off and Lara has warned us that these are dangerous times to trade gold. There is no clear trend and no confirmation. Even today a jump up of $26.50 since Tuesday close in gold and we have only invalidations but no confirmation yet. 1224.35 would provide confirmation and clarity to these unclear, choppy dangerous gold waves.
I believe that gold will easily surpass 1224, but that doesn’t invalidate the strong possibility that gold could head south soon after this event.
Lots of ups and downs in gold. However I’m looking to make profits more often then wait to be right.
I trade much longer term and like riding large trends. Anything else just chops up my account. This move up in gold will only add to the size of the coming plunge. Good luck!
You’ve said no need to go through why your scenario won’t work, so I won’t.
It doesn’t work.
If you try to chart it yourself keep in mind the rules for contracting triangles (the video on the education page may be useful) and you’ll see why it won’t work for yourself.
I sold my DUST at 10:42 am for 11.935. Bought DUST twice May 7th & 8th.
Lost $1,000 US. Since these are very choppy times without clear direction so I only went in small. Seriously thought of selling at close last night because bearish outlook weakened but kept DUST anyways.
Lara says herself to wait for confirmation, which we may get bullish confirmation this week.
sorry for your loss. I understand as I am in Dust at a -, but as i see it my charts indicating we are closer to a buy now than we’ve been in over 1-2 wks.
Nearing minute iii (or sm c.) end on xau meaning downward movement for gold. (dust up)
Don’t give up. keep an eye on dollar too. It could jump up tomorrow touching its downward trendline – or just keep going down. Its got downard movement yet to bottom of its daily trendline so we know gold will go up to that end.
At 10:36 am did gold peak and start retracing???
to me it seems like 4 in 5 retrace.
then 5 in 5 up will follow
I do agree. With the bull count, minuette c or 3 will reach 1227-1228, the 1.618 retrace. The fourth wave, if it takes on a 0.382 retrace, would reach 1209. And that, Richard, will be your last chance to sell DUST.
in this bull count, once minute iii completes (in the leading diagnol still?) then the minute iv should drop back down to what, the 1197-1200 area?
Good morning by the way. 🙂
Good morning, dsprospering. We broke out of the leading diagonal, and is now heading up in subminuette 5, currently dropping in micro 4. Subminuette 5 should end at the 1227-1228 zone that I mentioned above.
At this moment in time, I would think the alternate bull will be discarded by Lara as it is only an alternative to the bull count. It doesn’t make sense to still have two bull counts when one of them proves much more probable than the other. She may have an alternative for the bear count though, by reworking and changing Minute 2. The bear is only invalidated above 1224.34.
I am still holding out hope for the bear count for the selfish reason that the total potential gains until its completion would be much more than for the bull count. This is because the drop is greater (122x to 957) as compared to the rise (122x to 1320) unless the bull can reach the higher target of 1429.
I was looking at your post below…
” But if 1209.86 is taken out, the fifth wave is going to be extended.
I’m wanting to understand where the current EW count is on gold – I know we’re completin 5th wave (within minute iii). Do you have any expectations for the minute iv?
I know it is not E.W. and I am no expert, but I can not ignore the powerful
chart pattern on the correlating dollar. It expects more downward movement.
Now don’t digress. I’m trying to trade
gold etfs.
I don’t profess to be an EW expert either. I just accumulated a working knowledge of it, and is still learning as I go along.
As mentioned above, the current upward movement is in 5 waves. We broke out of the diagonal at the end of the first wave. We are now in the fourth wave, with the fifth to follow, which should terminate in the 1227-1228 zone. That would be minuette 3 or c in minute 3.
The US dollar is still sinking, and i ageee that it has a negative impact in gold as it is priced in US dollars. The gold:USD ratio means that if USD drops, gold priced in USD will rise (smaller denominator = larger ratio), unless the intrinsic value of gold drops faster than USD (i.e. an even smaller numerator). To get a better picture of the intrinsic strength of gold, you can cross-check the price of gold vs the ruro, yen, Swiss franc etc.
Can this bull run go 5 waves above 1224.35 ?
It has to retrace soon.
I still need to sell my DUST.
OMG!!! I am still holding shorts. from three days ago. According to my TA indicator TSI (7,4,7) the ratio of GDXJ?GLD has topped. TSI @ +80. Now watch it to go down to -60 to -80 you sell shorts and buy longs.
Look at the chart below.
Good analysis, papudi. Just curious, does the sell point correspond to 1209 in gold price? I have 1209 as the last low before the bull goes full steam up (look at my reply to Richard above). If it does, it would be great. This means different analysis methods yield the same result.
The top of the ratio corresponds to when gold was at it peak. In any time period 2hr,1,hr,30m,and 14m if TSI reaches extreme time to sell long and do the opposite etf.
These trades last few days only.
Yes gold appears going higher today. Still needs to break 1224.
YSI to be used only for swing trades in any bull/bear scenario.
papudi according to your chart we bought DUST when we should of bought JNUG.
I already cut my losses and it looks like DUST will drop more before this is over, I’d rather buy something bullish like GDX at a retracment point like 1208-9 on the way up as per Tham.
I’ll see what Lara says.
It’s all about trading timeframes and not swimming upstream. Daily/weekly/monthly GDX charts are in a very long term downtrend and are currently pegged at resistance. This when it “feels” bullish emotionally but is often when the market likes to pick the pockets of longs who enter new position right at tops.
How many days should I lose money in a 3X bear like DUST waiting just because gold is long term short.
Don’t trade off daily, weekly or monthly charts if your trading time horizon doesn’t tolerate it. I scale into positions over weeks and don’t make that many trades per year.
Any wave count like might gold drop a little in a few minutes for bear to get out fast.
Help please!!
Gold hourly bull is only wave count left and Bears taking hits.
Nightmare.
Gold Pushes Above $1,200 Following Downbeat U.S. Retail Sales
By Jim Wyckoff, Kitco News One of biggest news this month.
Wednesday May 13, 2015 09:42
http://www.kitco.com/news/2015-05-13/Gold-Firmer-on-Short-Covering-Bargain-Hunting.html
I feel your pain Richard. I am short GDP and I am taking a beating. Looking to get out at Minute Iv pullback I hope. Is there a reason why nobody seems to trade DGP.
I like the 2x instead of 3 x, however I think the reason many don’t trade it is due to it’s very low volume which can create different issues.
Remember there is no trend so trade small to reduce your risks. I feel your pain, good luck.
Tham did mention, ” I have 1209 as the last low before the bull goes full steam upwards, never looking back.” See if you can exit with downward momentum helping you.
Thanks for the feed back
Lara posted her expected lows that may be good time to sell your DGP.
Silver acting as a leading indicator now>>>>IS TREND TURNING UPSIDE
Price /volume analysis of gold: On 30th April gold’s high at 1207.40 with volume of 196000 contracts. Gold is testing the high today hopefully with lot lower volume and close below the 1207.40 will complete the test.
That day gold dropped and close lower at 1183 with huge red candle.
Today so far price has gone upto 1207.18. Day is not over yet.
Need to watch today’s volume. For a successful test volume should drop off at 20 to 30% below 196000.
I guess there was a bullish scenario after all. Whatever!
Silver is on the move.
I must compliment TKL and others for their superb commentary on how the E/W analysis is working out thus far and likely developing scenario. Many thanks for that…. My 2c worth Sentiment: With 1188 holding, an upturn in MacdMA indicated a short term rally which could go>>1196>>1200>>1206… Taking out 1197-99 could likely trigger gold price to seek 1200-06. However DMI, MACD, Momentum, ROC are bearish; expecting Gold price to make a good landfall to take out 1180-75…. I would consider 1208 with 1215 on the outside if taken out as the threshold (upside risk) to negate the down trend to continue to play out…. Bearish as long as Gold price is below 100dma.
Looks like Gold might finally go through 1200 today, I hope it does, I’m not sure I can take this bearish talk any longer. BTW if the bears crash the price here, I’m willing to go along, but I need to see some action on the downside, not just a bunch of wishful thinking charts.
I’ll be the first to admit that my account took a hit today and will be quiet for now. Will just let things play out and perhaps sit on the sidelines for awhile. That said, I cannot accept a bull wave count (until gold hits 1000 area). Everything else that I look at tells me so. Gold is going through a small rally within a multi year bear market. The only question is where the next significant drop begins. Without a shadow of a doubt, gold will see 1100 before it sees 1300.
Amen!!!!
Target for the bear count is 1199 and invalidation is 1 point away at 1200
This kind of forecast never works out if anything
We might be in C of II but the bear count is wearing thin
Tham
Gold just made high of 1196 and is trading at 1193.50. That is at the apex of the triangle a support.
Your latest post means bear count is in play while both bull still not invalidated.
Explosive time of the day is ahead around 6:30AM and then when COMEX opens.
I cannot conclude yet. If the fifth wave is an ending diagonal, there would be a substantial drop after it completes, so says TA books. But what if I am wrong? The movement can also be the first subwave of the fifth wave in the form of a leading diagonal. In this scenario, 1200 will be breached. We will need more input to get a clearer picture. To wit, the drop from the end of the diagonal must go below its start to invalidate the leading diagonal option. Better safe than sorry.
For current Bull ave count invalidation is below 1184 ????
If I interpret the graphs correctly, 1185.48 is the invalidation point for micro 4 of the bull alternate. The invalidation point for minute c and hence minor 2 is 1142.82.
1224 is the number that Lara and others use as the upside breaking point. However, if you were to strip away all preconceived notions, doesn’t it stand to reason that gold could retrace .618 of its move in 2015? That would bring gold to the 1240s.
With the move above 1200. the bear count as it stands is invalid. Lara may be able to devise some alternative bear count.
The leading diagonal option I mentioned above appears to be valid. With a simple impulse 5-wave up for the fifth wave, we would hit pretty close to 1209.86, Lara’s maximum target for the alternate bull.
If this plays out, then the next move will be a sizeable drop to 1160, or at least below 1169.94. But if 1209.86 is taken out, the fifth wave is going to be extended. Alternatively, 1209.86 is only the first subwave in the fifth wave.
The way to differentiate between bull and bull alternate is to look for the drop from 1209.86. If it drops below the beginning of the fifth wave at 1191.36 then the alternate is correct (and I will buy DUST for the drop to 1160 thereabouts). If it fails to do so, the bull will be roaring (and it’s time to go long).
Speaking of prejudices, I slightly favour the bear based on fundamentals. Would you think the Fed or some other control team would stand idly by and let gold soar? All the time, they couldn’t stand the notion that gold is an alterbative currency.
Daneric is bullish gold
http://danericselliottwaves.blogspot.com/2015/05/elliott-wave-update-12-may-2015.html
Kimble Charting is bullish GDX
http://blog.kimblechartingsolutions.com/2015/05/gold-miners-near-breakout-levels-a-good-place-to-hide/
Two scenarios
in 4h triangle pattern.
and second Emerging Bearish Bat Pattern.
The continuation of the sideways movement so far today implies that the Wave 4 triangle is not over yet. We are probably close to completing wave d now.
The triangle is most likely over at 1191.51. The final wave up should begin now. This is the most important movement. If price moves to around 1200 and turns down, both the bear and bull 2 are in play. If it moves higher, and takes out 1224.34, then the bull marches on.
Yes. And that said I just have to say the dollar going down really worries me. 🙁
I’m goin to bed now – happy trading. 🙂
The final wave up appears to be an ending diagonal. The subwaves fit very well within the diagonal channel. It only requires one last subwave up to complete. At a 1.618 ratio to subwave 4, it would reach 1199.04.
Lara’s target is 1199. Does it have to be 1199 or price can truncate the sm wave ii?
gold made it to 1196 only.
1199 is the target. A target is something you would aim for, it is not an absolute must that you need to hit it. I can only count three waves up to 1196. Perhaps you can find five waves?