
A small green doji candlestick fits for a fourth wave correction. In the mid term, the degree for this correction can now be known.
Summary: Gold is currently in a small fourth wave correction against the trend. Both bull and bear wave counts expect sideways movement for at least one more day to complete an expanded flat, triangle or combination. All three options are charted at the hourly chart level. Lower volume and a small doji candlestick for Monday’s session supports the view that Gold is currently in a correction.
Click on charts to enlarge.
To see weekly charts for bull and bear wave counts go here.
Bull Wave Count
The bull wave count sees primary wave 5 and so cycle wave a a complete five wave impulse on the weekly chart.
Pros:
1. The size of the upwards move labelled here intermediate wave (A) looks right for a new bull trend at the weekly chart level.
2. The downwards wave labelled intermediate wave (B) looks best as a three.
3. The small breach of the channel about cycle wave a on the weekly chart would be the first indication that cycle wave a is over and cycle wave b has begun.
Cons:
1. Within intermediate wave (3) of primary wave 5 (now off to the left of this chart), to see this as a five wave impulse requires either gross disproportion and lack of alternation between minor waves 2 and 4 or a very rare running flat which does not subdivide well.
2. Intermediate wave (5) of primary wave 5 (now off to the left of the chart) has a count of seven which means either minor wave 3 or 5 looks like a three on the daily chart.
3. Expanding leading diagonals are are not very common (the contracting variety is more common).
4. The possible leading diagonal for minor wave 1 and particularly minute wave ii within it look too large.
Last week volume shows an increase. This supports the bull count a little, but the increase is not higher than prior down days within the sideways chop. For volume to clearly support the bull wave count it needs to show an increase beyond 187.34 (30th April) and preferably beyond 230.3 (9th April). Only then would volume more clearly indicate a bullish breakout is more likely than a bearish breakout.
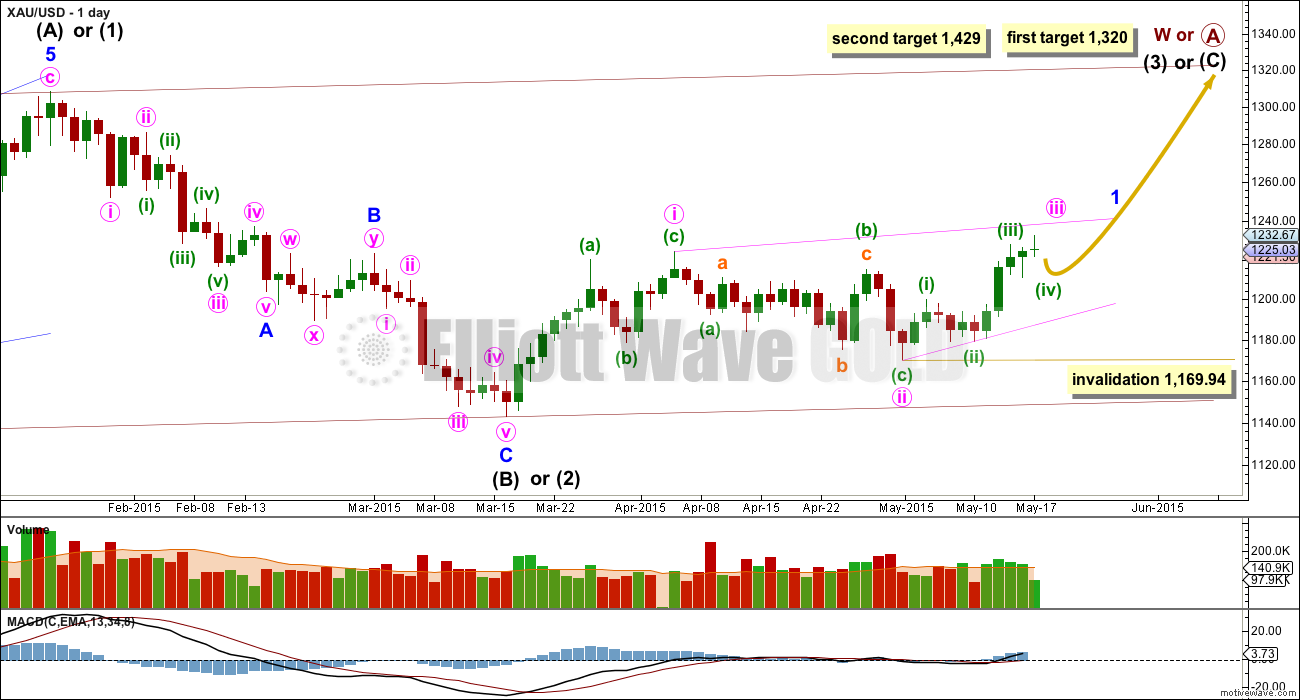
Within cycle wave b, primary wave A may be either a three or a five wave structure. So far within cycle wave b there is a 5-3 and an incomplete 5 up. This may be intermediate waves (A)-(B)-(C) for a zigzag for primary wave A, or may also be intermediate waves (1)-(2)-(3) for an impulse for primary wave A.
Intermediate wave (A) subdivides only as a five. I cannot see a solution where this movement subdivides as a three and meets all Elliott wave rules (with the sole exception of a very rare triple zigzag which does not look right). This means that intermediate wave (B) may not move beyond the start of intermediate wave (A) below 1,131.09. That is why 1,131.09 is final confirmation for the bear wave count at the daily and weekly chart level.
Intermediate wave (B) is a complete zigzag. Because intermediate wave (A) was a leading diagonal it is likely that intermediate wave (C) will subdivide as an impulse to exhibit structural alternation. If this intermediate wave up is intermediate wave (3) it may only subdivide as an impulse.
At 1,320 intermediate wave (C) would reach equality in length with intermediate wave (A), and would probably end at the upper edge of the maroon channel. At 1,429 intermediate wave (C) or (3) would reach 1.618 the length of intermediate wave (A) or (1). If this target is met it would most likely be by a third wave and intermediate wave (C) would most likely be subdividing as a five wave impulse.
It is possible that the intermediate degree movement up for the bull wave count is beginning with a leading diagonal in a first wave position for minor wave 1.
A leading diagonal must have second and fourth waves which subdivide as zigzags. The first, third and fifth waves are most commonly zigzags but sometimes they may be impulses.
Within diagonals, the most common depth of the second and fourth waves is between 0.66 and 0.81. Minute wave ii is 0.67 of minute wave i.
Minute wave iii is unfolding as an impulse; currently, it is within the fourth wave at minuette wave degree.
Bear Wave Count
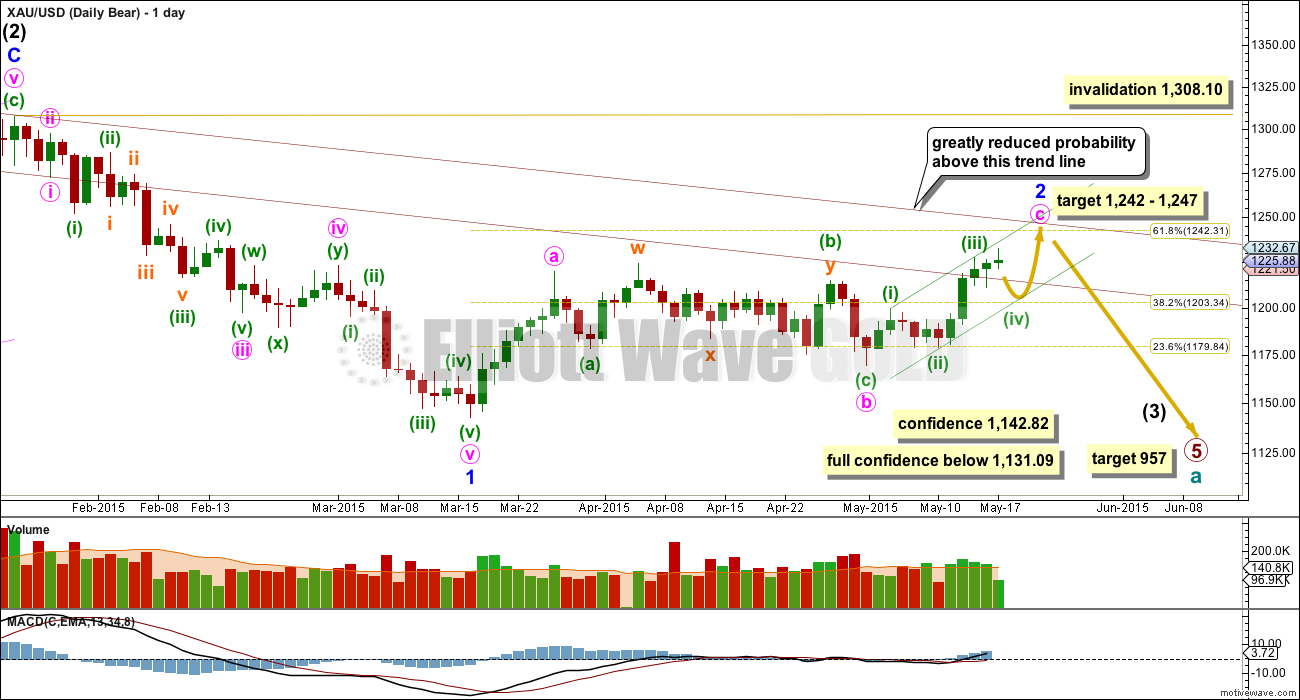
This wave count follows the bear weekly count which sees primary wave 5 within cycle wave a as incomplete. At 957 primary wave 5 would reach equality in length with primary wave 1.
Pros:
1. Intermediate wave (1) (to the left of this chart) subdivides perfectly as a five wave impulse with good Fibonacci ratios in price and time. There is perfect alternation and proportion between minor waves 2 and 4.
2. Intermediate wave (2) is a very common expanded flat correction. This sees minor wave C an ending expanding diagonal which is more common than a leading expanding diagonal.
3. Minor wave B within the expanded flat subdivides perfectly as a zigzag.
Cons:
1. Intermediate wave (2) looks too big on the weekly chart.
2. Intermediate wave (2) has breached the channel from the weekly chart which contains cycle wave a.
3. Minor wave 2 is much longer in duration than a minor degree correction within an intermediate impulse normally is for Gold. Normally a minor degree second wave within a third wave should last only about 20 days maximum. This one is in its 41st day and it is incomplete.
4. Within minor wave 1 down there is gross disproportion between minute waves iv and ii: minute wave iv is more than 13 times the duration of minute wave i, giving this downwards wave a three wave look.
This bear wave count now needs minute wave c upwards to complete as a five wave impulse. The short term outlook is exactly the same as the bull alternate hourly wave count, and the subdivisions on the hourly chart are exactly the same.
At 1,247 minute wave c would reach equality in length with minute wave a. Minor wave 2 would be very close to the 0.618 Fibonacci ratio at 1,242.
Minor wave 2 may not move beyond the start of minor wave 1 above 1,308.10. However, this wave count would be substantially reduced in probability well before that price point is passed. A breach of the upper maroon trend line, a parallel copy of the upper edge of the channel copied over from the weekly chart, would see the probability of this wave count reduced so much it may no longer be published before price finally invalidates it.
Hourly Charts
For both bull and bear wave counts, Gold is within minuette wave (iv). There are three possible structures, and the three hourly charts below all apply to both bull and bear wave counts. I will favour neither wave count as they are all equally likely. It is impossible at this stage to tell which structure will complete. The only thing which looks clear today is that Gold is within a small correction, a consolidation phase against the current upwards trend.
Expanded Flat
This hourly chart looks at the possibility of an expanded flat unfolding for minuette wave (iv).
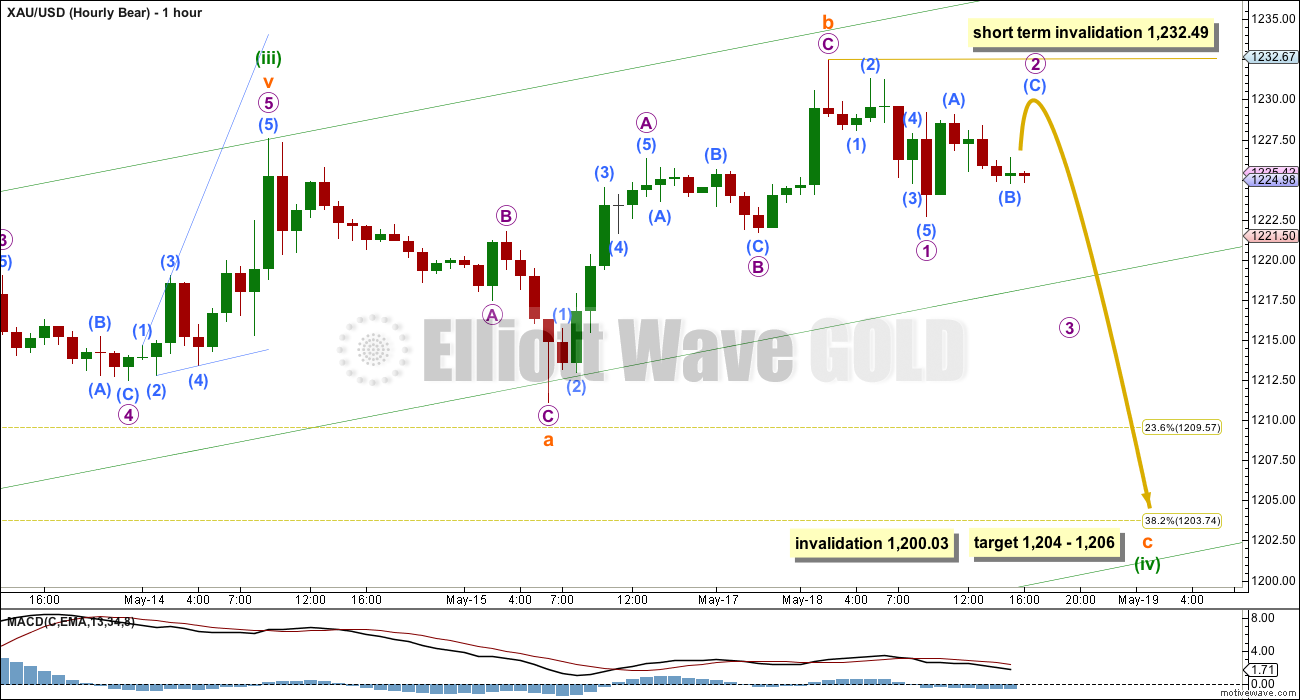
Subminuette wave b is a 130% correction of subminuette wave a. Both subdivide as threes. This indicates an expanded flat. The most common length for subminuette wave c would be 1.618 the length of subminuette wave a at 1,206. This is close to the 0.382 Fibonacci ratio of minuette wave (iii) at 1,204, giving a $2 target range.
Within subminuette wave c, micro wave 2 may not move beyond the start of micro wave 1 above 1,232.49. Subminuette wave c must subvidide as a five wave structure downwards.
It is extremely likely for subminuette wave c to make at least a slight new low below the end of subminuette wave a at 1,211.11 to avoid a truncation and a very rare running flat.
If minuette wave (iv) is an expanded flat correction it may end more quickly. It may even end with one red candlestick for Tuesday, to total a Fibonacci three days.
Triangle
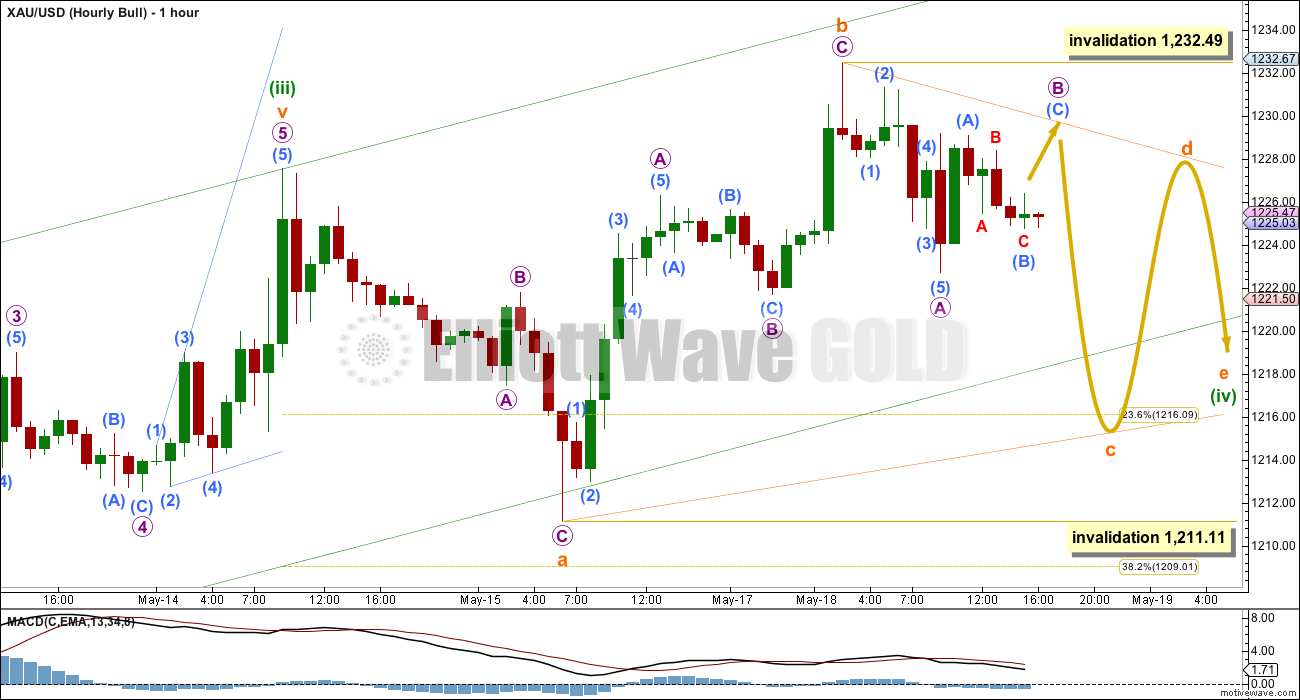
This hourly chart looks at the possibility of running contracting triangle unfolding for minuette wave (iv).
Within both contracting and barrier triangles, subminuette wave c may not move beyond the end of subminuette wave a below 1,211.11. Within a contracting triangle, subminuette wave d may not move beyond the end of subminuette wave b above 1,232.49.
Within a barrier triangle, subminuette wave d may end about the same level as subminuette wave b at 1,232.49. In practice this means subminuette wave d may end slightly above 1,232.49 as long as the b-d trend line of the triangle remains essentially flat. This upper invalidation point is not black and white.
Subminuette wave e of both barrier and contracting triangle types may not move beyond the end of subminuette wave c.
In the short term, a three wave structure should unfold downwards for submineutte wave c and within it micro wave B may not move beyond the start of micro wave A above 1,232.49.
A contracting or barrier triangle may take a few days to complete; should see choppy overlapping movement within an ever decreasing range as well as declining volatility; should see MACD hover about the zero line; and, it may total a Fibonacci five or eight days (so far it has lasted only two).
Combination
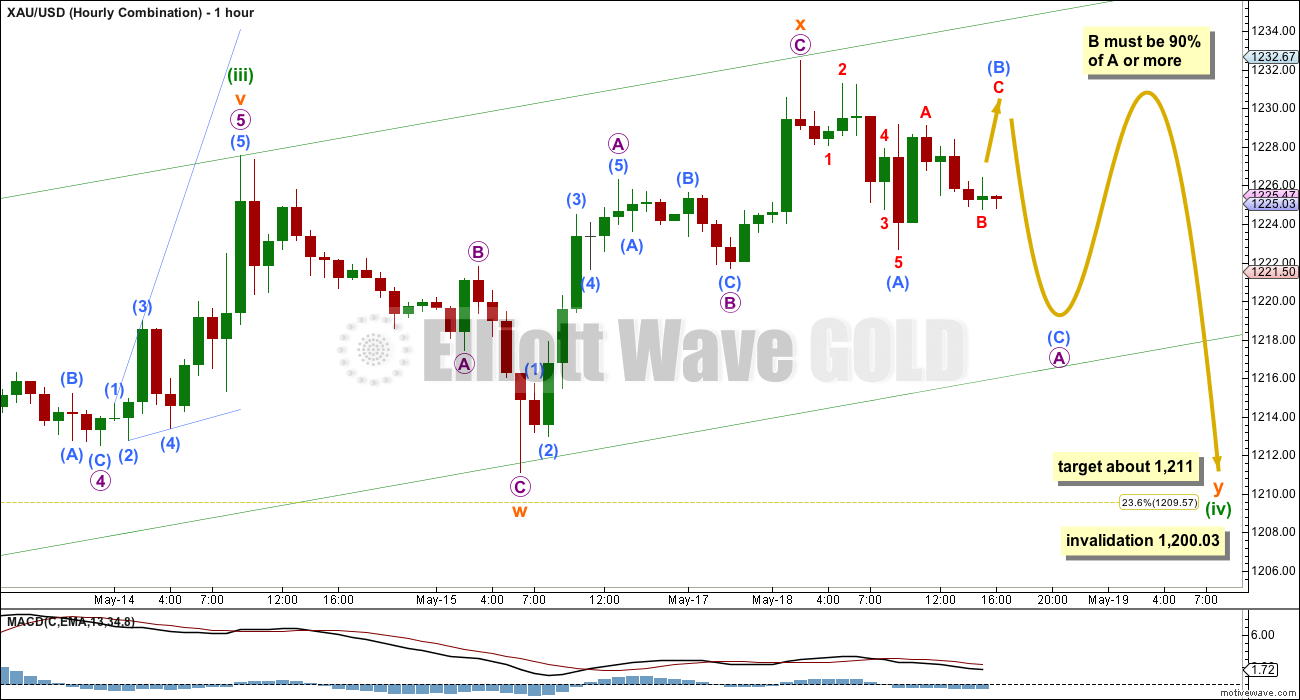
There is a third possible structure which may be unfolding. This hourly chart looks at a combination for minuette wave (iv).
The first structure in the combination is a zigzag labelled subminuette wave w. The combination is joined by a three, a zigzag in the opposite direction labelled subminuette wave x. Within combinations the X wave may make a new price extreme beyond the start of the first structure of W.
There may only be one zigzag within a double or triple combination. Because subminuette wave w is a zigzag, this means subminuette wave y may not be. It may only be a flat or triangle.
Within subminuette wave y, the first wave down for micro wave A must be a three wave structure and most likely unfold as a zigzag. When it is complete, then micro wave B upwards must be a minimum 90% of micro wave A if subminuette wave y is a flat correction. If subminuette wave y is a triangle, there is no minimum upwards depth for micro wave B.
Subminuette wave y may be an expanded flat or running triangle, and within it micro wave B may include a new price extreme beyond the start of micro wave A above 1,232.49. There is no upper invalidation point for this wave count for this reason.
Subminuette wave y may take another few days to unfold. Minuette wave (iv) may complete in a Fibonacci five or eight days in total, and so far it has lasted only two.
Technical Analysis
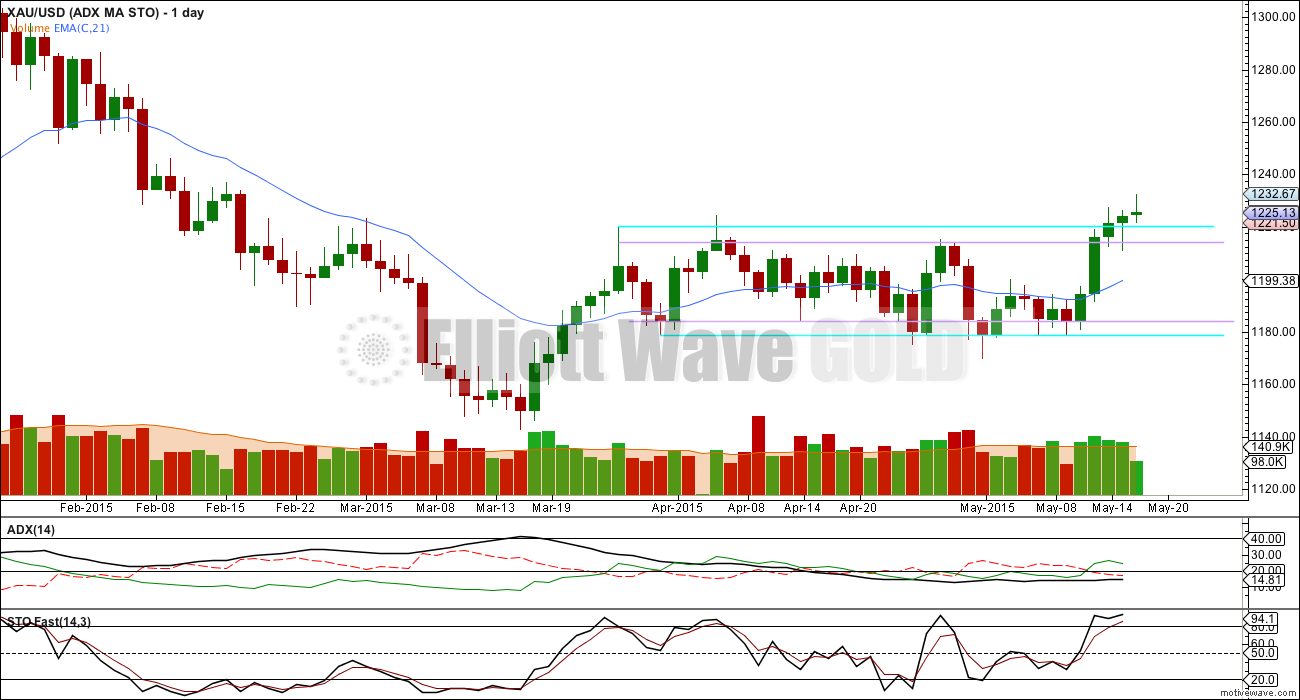
ADX is still just below 15 and flat. Because ADX is not trending up this indicates low volatility, with very short swings and no clear trend. ADX supports the Elliott wave count which sees Gold currently within a small consolidation phase for a small fourth wave correction.
Volume is lower for Monday. When price is within a correction it is common for volume to be lower.
Stochastics indicates price is overbought, but this may be relieved as the correction continues sideways and / or lower.
I would look for price to find support about the upper lilac trend line which has indicated recent support / resistance, or at least close to this line.
Currently the +DX line (green line) is above the -DX line (red dashed line). This supports an upward breakout as more likely than downward.
This analysis is published about 05:17 p.m. EST.
just noting today’s AFTER Market purchases:
900Kshares of GDX @20 = 18M
350Kshares of DUST@13.3 = >4.6M
no, not MY purchases —
Added one last small position at $23.60. I don’t know if Bull or Bear count is right, but since both call for up move here to +1230, I will be keeping an eye on it. Tight stop.
I just bought GDX for $20.025 at 2:53 pm based on Lara’s several comments this afternoon.
Nice trade, right at the gap.
Thanks, I thought about buying GDX cheap based on Lara’s Monday analysis and it dropped all day and I couldn’t resist buying after reading Lara’s comments. Also many times when gold drops all day it turns around in the last hour of trading. I see you bought JNUG very cheap close to the day low.
Lara mentioned, “But the risk here is very low indeed, because the invalidation point is very close by. The fourth wave is also now almost touching the lower edge of the channel I’ve drawn on the daily bear chart about minute wave c (green channel sloping up). That trend line should provide support.”
Good trade.
I saw that gold price dropped to 1205.84 for the third wave, and rose to a high of 1209.33 for the fourth. There will be one small drop to around 1205-1206, but as the close was approaching, I had no choice but to buy NUGT, at the point where the first subwave down was made at 3:45 am. The final drop should complete in the Asian market followed by a reverse towards 1236 for minuette 5.
Do you think that because the drop was so long and quick that it was a 3rd wave? Couldn’t it have been an extended 5th?
That could also be possible. I am only concerned with the end point because it positions for a reversal up.
Lara covers this in her new analysis.
Tham – thanks. I am really looking forward to 1236 or however high gold gets at Wed 2 pm FOMC then follow the trend from the FOMC, which one of your comments indicates you believe may be up.
As far as GDX-related issues are concerned, there isn’t much room left before support gives way….around 19.80…so bulls better hope it holds The rejections at MA resistance and multi-year trendline resistance have been low-risk selling points. A break in support will confirm. The back drop of a $USD break out, plunging bonds, and money pouring into the S&P doesn’t seem to support money cycling into gold-related equities. My chart from 5/15 still seems right on point and for now the possible island top is totally in play. Structurally the whole rise from the March lows looks like a corrective move but every analyst out there seems to think gold is heading to 1300+ from here. I’m not saying it can’t, but the bullish view is getting very crowded and neither gold nor GDX/HUI/XAU have proven they can overcome resistance. I will be a believer in the bull story when resistance gets crushed. The most bullish charts to my eyes are DUST/JDST. Just my 2 cents.
XAU – really tough to subscribe to a view of a constructive correction.
AU – so many GDX components are looking like this.
Here’s my DUST chart posted on 5/15. It looks infinitely more bullish than the GDX…at least to my eyes.
I like your chart w/fork.
ABX breakdown
GG behaving as expected.
HUI – not bullish.
The triangle was invalidated below 1,211.11, and the combination did not see a B wave up which was 90% of the prior A wave…. so that leaves only one possibility. An expanded flat.
I can count a completed five wave structure down. The target zone for the C wave of the expanded flat was 1,204 – 1,206, price is right in this zone at 1,205.86.
There’s almost no room left for it to move into. The invalidation point is now very close by at 1,200.03. This fourth wave may not move into it’s first wave price territory.
It certainly is possible that my count of the C wave is wrong, and it could have one more low before it is done. But the risk here is very low indeed, because the invalidation point is very close by.
The fourth wave is also now almost touching the lower edge of the channel I’ve drawn on the daily bear chart about minute wave c (green channel sloping up). That trend line should provide support.
I will be expecting now that minuette wave (iv) is over for both bull and bear wave counts. I will expect minuette wave (v) to begin here or very soon indeed. The target is 1,236 for minuette wave (v) to reach equality in length with minuette wave (i).
What’s the verdict today? Does it look like gold completed a 5-wave structure down? I am not positive, because I cannot see the 4th wave in there. Going off of price alone, it looks over though.
I can see it complete, yes.
I can also see it is possible for a final fifth wave down…. but with the invalidation point so close by at 1,200.03 the amount of room to move is small, risk is very low.
Thanks. Looking forward to seeing where that 4th wave could been….if it is not in progress right now.
anyone have tgts/ideas on the dollar? Mark — you were right its a BO.
Look at Gary Wagner’s $DXY the top chart it appears like $DXY is at a bottom?
Gold Suddenly Finds Itself In Uphill Battle Against US Dollar -Monday May 18, 2015 18:05
http://www.kitco.com/commentaries/2015-05-18/Gold-Suddenly-Finds-Itself-In-Uphill-Battle-Against-US-Dollar.html
It’s a little early to tell, but I believe the dollar low is in for the next several weeks/months and that current movement is a first wave of five up. Perhaps a second wave correction will coincide with gold’s final fifth wave up.
No doubt about it. Minimum target is a retest of the last high.
As I said below the Triangle – Hourly Bull chart was as per Lara’s Protocol and bottom of her chart invalidated below 1,211.11 at 10:21. Yes there is an hourly Bull chart that is clearly different than the other charts. I am just sharing Lara’s invalidation point occured nothing else.
Gold may have already been following other charts and other invalidation points may exist as per comments below that were not mentioned by Lara.
Hi Richard. A successful trader has to adapt always to the changing environment. I mentioned before that no analyst can see every possible turn and nuance in the market. They have to best guess with information available at a particular time period, and extrapolate from there. This works best in a straightforward trending market, but in a trading setup, the possibilities are enormous. In physics, this is the characteristic of a non-linear system, which obeys Chaos Theory. You may have heard of the famous Butterfly Effect, popularised in science fiction. It says that a very small change will snowball into a result that is highly unpredictable. All of us are using linear mathematical rules to model non-linear effects. The accuracy of such is often very short. A classic example is weather forecast, never accurate for a longer time period.
Tham I agree with everything you are saying and your analysis is terrific. Thank you. And I do also study Quantum Physics and frequently Access the Zero Point Field of infinite possibilities where Miracles happen on request.
Looking at the daily chart, the entire upward movement during this month looks like it is forming a very clear cut 5 wave structure up. Gold is currently in the bottom price range of a 4th wave. Can’t move below 1200 (1st wave price territory).
Just sold off my DUST bought from last Friday. I took profit at the third of a third at 1206.41. Those who still have DUST may like to sell off at the end of the third wave, now most likely at 1204-1205. I won’t want to wait till the long drawn out wave 4, probably of a day’s duration to chance the end of wave 5 and hence the end of minuette 4. Good luck.
Agreed. Unless all of these wave counts are wrong, gold is not going to go much lower.
Smart move, take profits when they appear in these choppy waves.
The Hourly Bull chart has been invalidated at 10:21 am when gold dropped below 1211.11.
Hi. Is this an expanded flat correction?
Yes.
There is no Hourly Bull, both Bull and Bear are the same at this point. The Triangle was invalidated. The expanded flat appears to be the count we are in.
Also, the combination is in play. It will have exactly the same price movement as the expanded flat.
By the way, the triangle was invalidated long ago, when price dropped below 1217.28.
Few momentum indicators gave DUST buy signal, These indicators are also used for many other ETFs.
All indicators gave simultaneous buy signal at the bottom.
SENTIMENT: Gold price is overbought, bullish, trend is up; a closing at a new high 1227.60 indicating further bullish momentum and higher prices…. The new high 1232 was not accompanied by increasing volume suggesting overbought conditions resulting in a retracement…. As I see it now, the low of 1217/1216.90 may be in for the day; with 1217 holding, basing off 1219-20, Gold price would firstly need to take out pivot 1226-27 for 1229-30 seeking 1236-37…. ADX is rising indicating for the uptrend to continue….
Lara: Is time for update on US Oil? Wave iv may be complete. It is at an important point.
Thanks.
Just curious. What is the vehicle that you use to trade the decline in oil price? I have used DTO and DWTI due to their high trading volumes. But both are on the expensive side, priced above 60 currently.
Yes DWTI is higher price. So as SCO which is 2xetf wtic at $56. I am planning to buy DWTI today. I believe wave iv is complete.
For oil discussion lets move to US Oil post. Some here may not like to get gold post disq hijacked.
I appreciated your comment. it made me comfort to buy SCO .
Yes, I’ve been watching that carefully over the last couple of weeks. It looks like the fourth wave has completed a double flat. Today the C wave of the second flat moved below the end of the A wave, so that should be it. Oil should go up for a final fifth wave. The target now should be recalculated.
I’ll update that tonight or tomorrow.
Once again, ongoing price movement is out of expectations. The current rather strong downwards wave has very much exceeded 1222.66 (the micro 1 of the expanded flat, micro A of the triangle, or submicro A of the combination).
This may indicate that all three wave counts need reworking. I can see two possibilities. If any of you guys can come up with other proposals, that would add to our communal understanding.
One, the second wave (micro 2, micro B, or submicro B) is of short duration (ended at 1229.07), or is truncated, but anyway it has completed. My gut feel is that the rather strong move down favours the expanded flat with its 5-wave impulse, and it is part of the third wave. This will improve in probability if, after the third wave has completed, the fourth up does not move into wave 1 territory.
Two, the first wave (micro 1, micro A, or submicro A) should be moved down one degree. Then the first wave would end at wherever the current down move completes.
Price has moved back up to 1224.16, which is into wave 1 territory. Moreover, it has broken the downtrend line drawn from the start of the first wave. So, my option 1 is invalidated. For option 2, the first wave ended at 1217.28.
The drop below 1217.28 establishes wave 1. Wave 2 is a short correction up to 1224.16. Wave 3 coincided with the announcement of the housing starts and has just completed the third of a third.
Also, if my count is correct, the triangle is invalidated with the drop below wave 1 as it has to be contracting, not expanding. Both expanded flat and combination now point towards an end of around 1201. However, may I suggest that those who have been short gold to exit at the end of wave 3 because, by the rules of alternation, wave 4 will be long drawn out, probably continuing until tomorrow. The slow sideways movement in wave 4 is in concurrence with pre-FOMC .
Tham
Hello, at what price do you think wave 3 might end, thank you? It sounds like if I am not already in DUST than may be better to take a position at FOMC Wed 2 pm, whichever way it goes?
p.s. I am glad Lara showed up Monday am to clarify your inquiry.
Hi Richard. I think wave 3 would end around 1209-1211. Currently either completed or is completing its fourth subwave.
I will also be watching FOMC minutes release. I am inclined towards to a rise in gold price in the aftermath, although some cycle analysts cast doubts on it, saying that gold would be topping this week.
I think we can have both – first a rise, then a severe decline 24 hours or so later.
As per wedge break
Gold can complete wedge break by moving to 1197
Normal target for wedge BO is starting point of wedge 1175 (your chart).
Thanks for the chart.
I do agree. In the scenario I described, price for the expanded flat and the combination both will terminate at 1196-1197. The running contracting triangle is the exception. It cannot move below 1217.28.
The target for the C wave of the expanded flat was 1,204 – 1,206. Price so far is down to 1,205.86.
My mistake was expecting micro wave 2 to end slightly higher before a downwards wave.
That is all that needs reworking on the hourly chart for the expanded flat correction.
With price so close to the invalidation point it really needs to be over here. There’s almost no room left for it to move in.
Hi Lara. I think micro 3 ended at 1205.84, and micro 4 most likely completed at 1209.33. Micro 5 has so far completed two waves. Based on this, micro 5 should end around 1205.28.
I’m starting to believe you that a small 5th wave may still be coming, since the 3rd wave is close to the 2.618 ratio of the 1st and I can’t see a clear 4th on the way down.
All three hourly charts look like around 1,230 is good area to buy DUST.
Then take profits before Wed 2 pm FOMC news.
If gold goes down post 2PM on FOMC it will invalidate two of the hour wave counts below 1200. Like THAM suggested these wave counts will need to be re-worked again. Keep bear count alive. until gold breaks 1308.
papudi. Only the triangle is invalidated at 1200. See my reply to Waseem above.
Why would gold no longer be in a 4th wave (of 5 up)? Looks like a classic correction in which the 4th wave can’t move into 1st wave territory below 1200. The type of 4th wave is still not clear.
It is in minuette 4, subminuette c of the expanded flat and the triangle. Both expanded flat and the triangle see sm c as a 5-wave movement. I see the first wave of sm c complete, now undergoing the second wave. For the combination, it is sm a that is completed, now undergoing sm b.
The significance of the 50% retrace……
As I see it, downside is seen limiting to 1215-12 subject to if Gold price can break below 5dma (1222) / 100dma (1219)…. As always a fascinating analysis by Lara – hard to pick which of the wave counts is most likely to occur!
Amen!!! Would not that be nice!!!! We all have great profit since Nov 2014. Lara does not only hard work but puts out very intelligent work to get right waves. I feel I can take positions. But gold has its own mind. Changes the wave counts every day. Bummmer!!!
Hi papudi: No doubt about the diligence and quality detailed analysis by Lara. Couldn’t ask for better. Gold price movement of late has been a bit of a bummer indeed lol…. I wonder if there is enough in it for Gold price to break below 100dma 1211-10 in which case will open up downside risk 1178 which will be fabulous!!
Wed. May 20th 2 pm EST FED FOMC minutes released from Meeting of April 28-29, 2015
Perhaps the 2 pm breakout may be up? Maybe gold might bottom by then at 1204, 1211 or 1218? I will be watching Gold and the US dollar index $DXY and waiting and ready to buy at 2 pm. Wed.
Meanwhile I may buy DUST if it hits 1230 area before then before it drops.
The release of FOMC minutes usually jolts the markets pretty hard that I’m thinking a triangle may be too mild in terms of range. The move(s) following minutes can be quite large and violent, whatever direction they go. Therefore, I favor the other two hourly counts at this point.