
Some upwards movement to 1,215 was expected before this strong downwards movement. That did not happen.
Summary: For both bull and bear wave counts this downwards movement is either over already or very close to it. There is very little room left for it to move; the limit for downwards movement for the bull wave count is at 1,178.08 and for the bear wave count at 1,179.03. In the short term, a new high above 1,201.60 would confirm this C wave down is complete. At that stage both bull and bear wave counts would require a new high above 1,232.49.
To see weekly charts for bull and bear wave counts go here. Changes to last analysis are italicised.
Bull Wave Count
Click chart to enlarge.
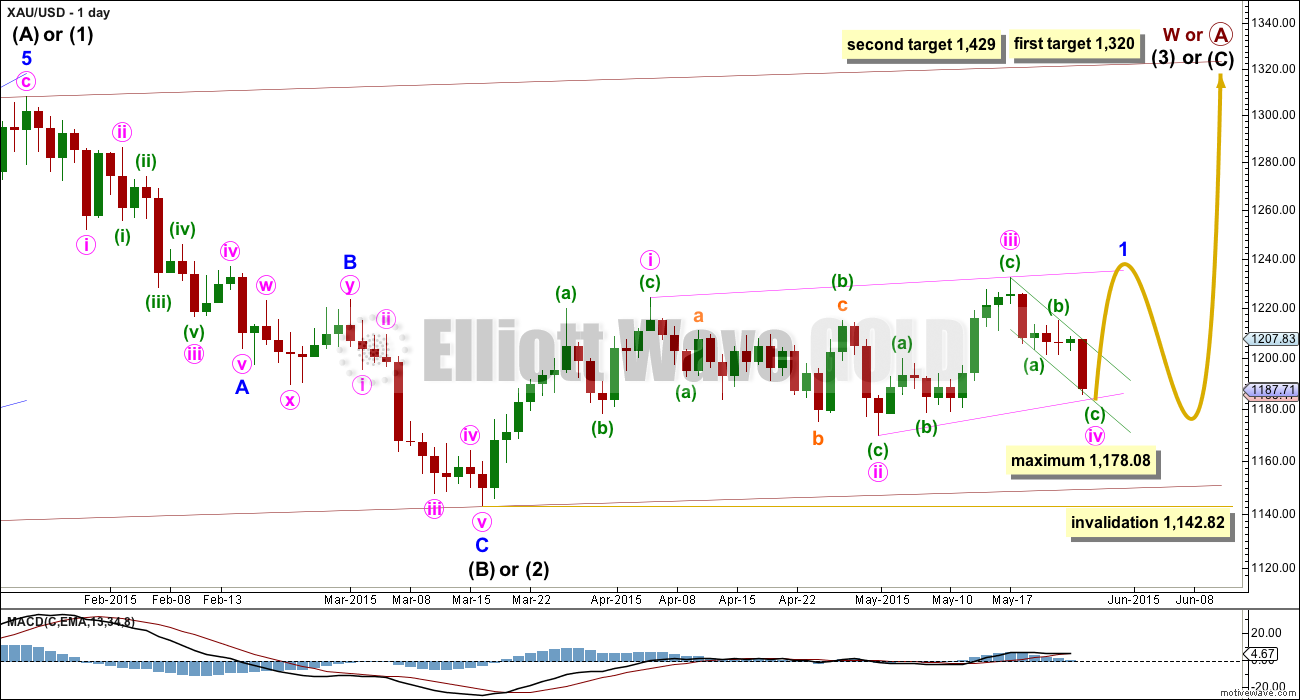
The bull wave count sees primary wave 5 and so cycle wave a a complete five wave impulse on the weekly chart.
Pros:
1. The size of the upwards move labelled here intermediate wave (A) looks right for a new bull trend at the weekly chart level.
2. The downwards wave labelled intermediate wave (B) looks best as a three.
3. The small breach of the channel about cycle wave a on the weekly chart would be the first indication that cycle wave a is over and cycle wave b has begun.
Cons:
1. Within intermediate wave (3) of primary wave 5 (now off to the left of this chart), to see this as a five wave impulse requires either gross disproportion and lack of alternation between minor waves 2 and 4 or a very rare running flat which does not subdivide well.
2. Intermediate wave (5) of primary wave 5 (now off to the left of the chart) has a count of seven which means either minor wave 3 or 5 looks like a three on the daily chart.
3. Expanding leading diagonals (of which intermediate wave (A) or (1) is) are are not very common (the contracting variety is more common).
4. The possible leading diagonal for minor wave 1 and particularly minute wave ii within it look too large.
For volume to clearly support the bull wave count it needs to show an increase beyond 187.34 (30th April) and preferably beyond 230.3 (9th April). Only then would volume more clearly indicate a bullish breakout is more likely than a bearish breakout.
Within cycle wave b, primary wave A may be either a three or a five wave structure. So far within cycle wave b there is a 5-3 and an incomplete 5 up. This may be intermediate waves (A)-(B)-(C) for a zigzag for primary wave A, or may also be intermediate waves (1)-(2)-(3) for an impulse for primary wave A. At 1,320 intermediate wave (C) would reach equality in length with intermediate wave (A) and primary wave A would most likely be a zigzag. At 1,429 intermediate wave (3) would reach 1.618 the length of intermediate wave (1) and primary wave A would most likely be an incomplete impulse.
Intermediate wave (A) subdivides only as a five. I cannot see a solution where this movement subdivides as a three and meets all Elliott wave rules (with the sole exception of a very rare triple zigzag which does not look right). This means that intermediate wave (B) may not move beyond the start of intermediate wave (A) below 1,131.09. That is why 1,131.09 is final confirmation for the bear wave count at the daily and weekly chart level.
Intermediate wave (B) is a complete zigzag. Because intermediate wave (A) was a leading diagonal it is likely that intermediate wave (C) will subdivide as an impulse to exhibit structural alternation. If this intermediate wave up is intermediate wave (3) it may only subdivide as an impulse.
It is possible that the intermediate degree movement up for the bull wave count is beginning with a leading diagonal in a first wave position for minor wave 1.
A leading diagonal must have second and fourth waves which subdivide as zigzags. The first, third and fifth waves are most commonly zigzags but sometimes they may be impulses. The fourth wave must overlap first wave price territory.
Within diagonals, the most common depth of the second and fourth waves is between 0.66 and 0.81. Minute wave ii is 0.67 of minute wave i. So far minute wave iv is 0.77 of minute wave iii, nicely within normal range.
The maximum depth for minute wave iv is at 1,178.08 where it would reach equality in length with minute wave ii. Because the diagonal is contracting the fourth wave may not be longer than equality with the second wave, should be shorter, and the trend lines should converge. Minute wave iv may be over in one more day, or it may be over already.
Click chart to enlarge.
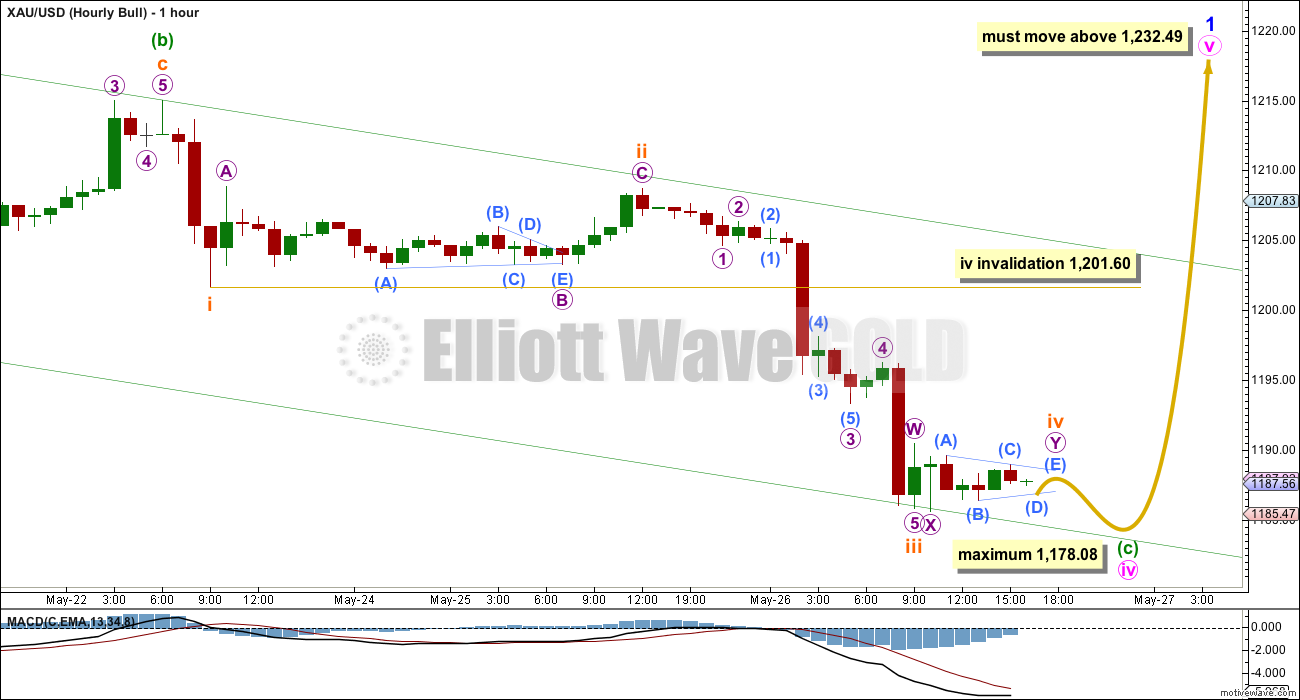
Minuette wave (b) did not continue higher to the target at 1,215. Strong downwards movement must be minuette wave (c) arriving earlier than expected after last analysis. The upper edge of the green channel copied over here from the daily chart provided resistance, and the lower edge is now providing support.
The question today is whether or not the fourth wave, which for the bull wave count is subminuette degree, is over or not. This bull hourly chart will look at the possibility it is incomplete; the bear hourly chart looks at the possibility it is complete. Both ideas work the same way for bull and bear wave counts.
In the short term the bull and bear wave counts do not diverge.
If the fourth wave of subminuette wave iv is incomplete, it may be continuing as a double combination: zigzag – X – triangle. The triangle of micro wave Y would be unfolding sideways, taking up time, so that subimnuette wave iv is better in proportion to its counterpart subminuette wave ii.
Subminuette wave iv may continue for a few more hours sideways in a very narrow range. It may be followed by a very short brief fifth wave down which may again find support at the lower green trend line. Subinuette wave v may be about 8.3 in length if it is 0.618 the length of subminuette wave i.
Subminuette wave iii is 1.2 longer than 1.618 the length of subminuette wave i. Because there is already a close Fibonacci ratio between subminuette waves i and iii, this means subminuette wave v may not exhibit a Fibonacci ratio to either of subminuette waves i or iii. The lower green trend line may be the best guide to where this downwards movement may end.
Subminuette wave iv may not move into subminuette wave i price territory above 1,201.60.
The final fifth wave up of minute wave v to end this leading contracting diagonal may not be truncated. It must move above the end of minute wave iii at 1,232.49.
Bear Wave Count
Click chart to enlarge.
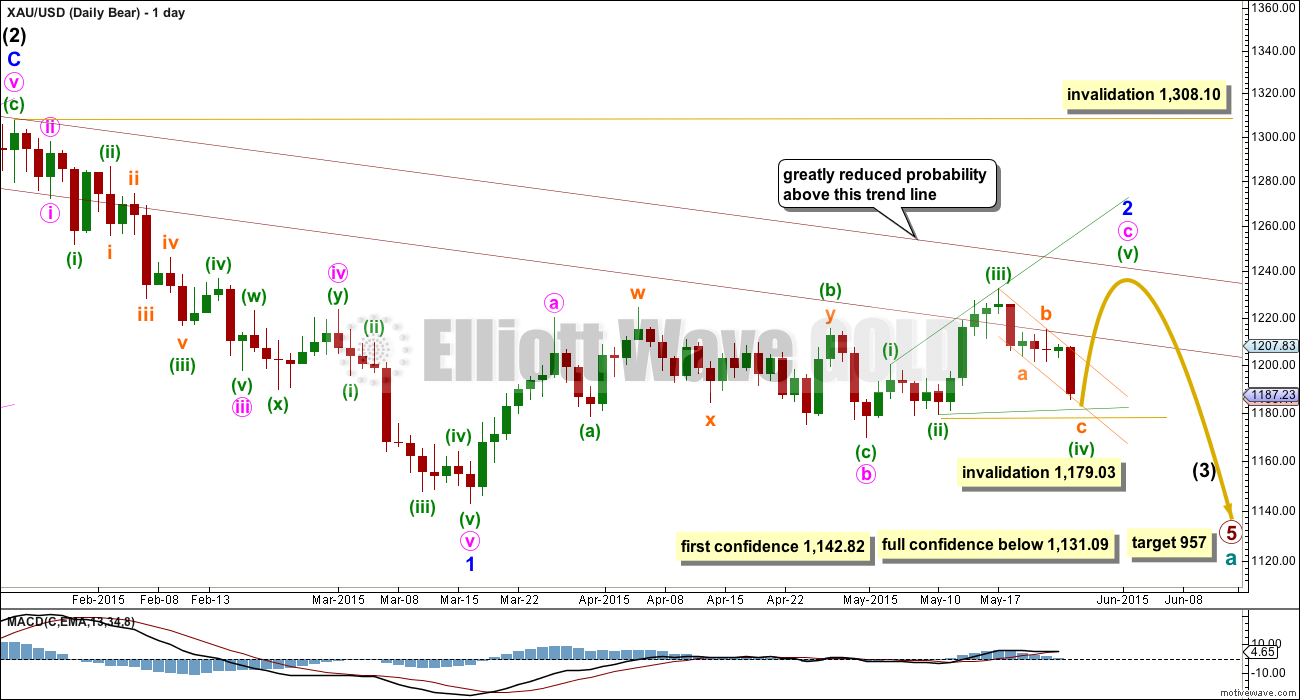
This wave count follows the bear weekly count which sees primary wave 5 within cycle wave a as incomplete. At 957 primary wave 5 would reach equality in length with primary wave 1.
Pros:
1. Intermediate wave (1) (to the left of this chart) subdivides perfectly as a five wave impulse with good Fibonacci ratios in price and time. There is perfect alternation and proportion between minor waves 2 and 4.
2. Intermediate wave (2) is a very common expanded flat correction. This sees minor wave C an ending expanding diagonal which is more common than a leading expanding diagonal.
3. Minor wave B within the expanded flat subdivides perfectly as a zigzag.
Cons:
1. Intermediate wave (2) looks too big on the weekly chart.
2. Intermediate wave (2) has breached the channel from the weekly chart which contains cycle wave a.
3. Minor wave 2 is much longer in duration than a minor degree correction within an intermediate impulse normally is for Gold. Normally a minor degree second wave within a third wave should last only about 20 days maximum. This one is in its 50th day and it is incomplete. It is now starting to look ridiculous; this is becoming a serious problem for the bear wave count.
4. Within minor wave 1 down, there is gross disproportion between minute waves iv and ii: minute wave iv is more than 13 times the duration of minute wave i, giving this downwards wave a three wave look.
This bear wave count now needs minute wave c upwards to complete as a five wave structure which looks most likely at this stage to be an ending expanding diagonal.
Minor wave 2 may not move beyond the start of minor wave 1 above 1,308.10. However, this wave count would be substantially reduced in probability well before that price point is passed. A breach of the upper maroon trend line, a parallel copy of the upper edge of the channel copied over from the weekly chart, would see the probability of this wave count reduced so much it may no longer be published before price finally invalidates it.
Click chart to enlarge.
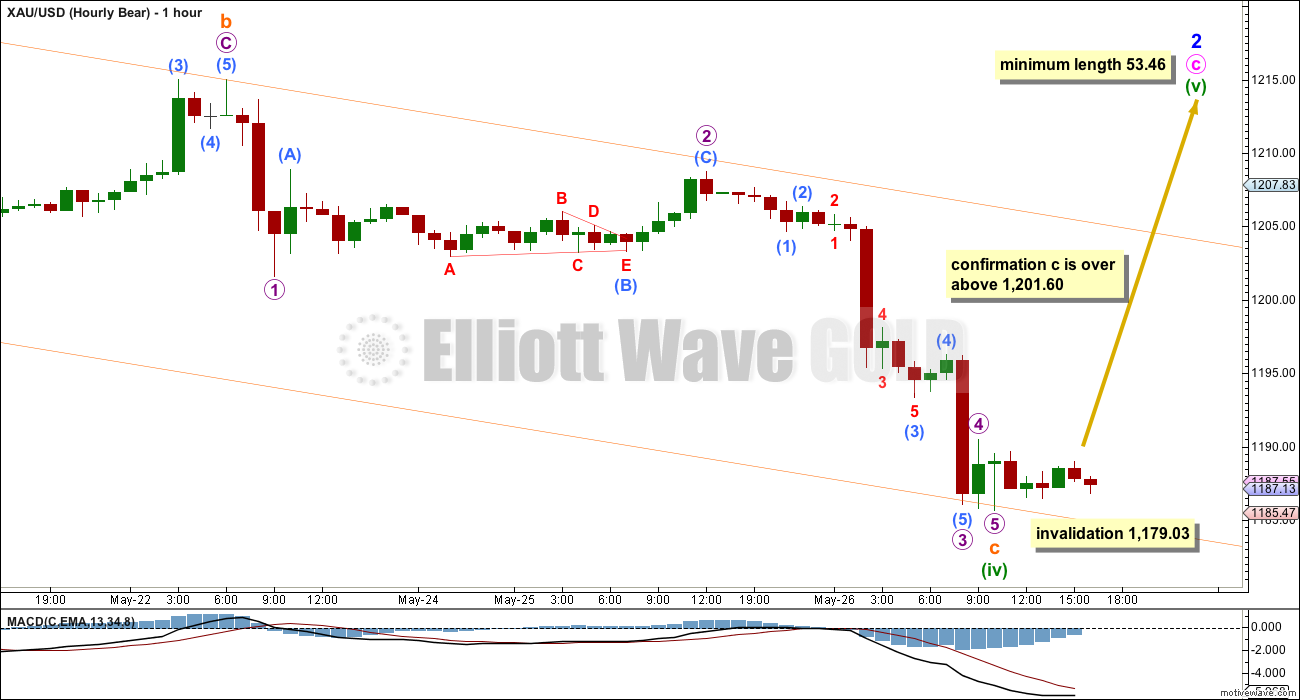
Both bull and bear wave counts need to see a completed five wave structure for a C wave down. This bear wave count has the C wave down at subminuette degree. The bull wave count has it at minuette degree.
For both bull and bear wave counts this C wave down may or may not be over. This chart considers what it would look like if it is now over.
If subminuette wave c is over, then there is a gross disproportion within it between micro waves 2 and 4. This gives subminuette wave c a three wave look when it should look like a five and not a three. Only for this reason I consider this second idea to have a lower probability.
If subminuette wave c for the bear wave count (and minuette wave (c) for the bull wave count) is over, this would be confirmed with a new high above 1,201.60. At that stage upwards movement may not be a fourth wave correction within subminutte wave c, and so subminuette wave c would have to be over.
For the bear wave count minuette wave (iv) may not move beyond the end of minuette wave (ii) below 1,179.03.
For the bear wave count the diagonal is expanding. The final fifth wave up for minuette wave (v) should be longer than equality in length with minuette wave (iii) so it must be 53.46 minimum length. This requires a new high above 1,232.49.
Technical Analysis
Click chart to enlarge.
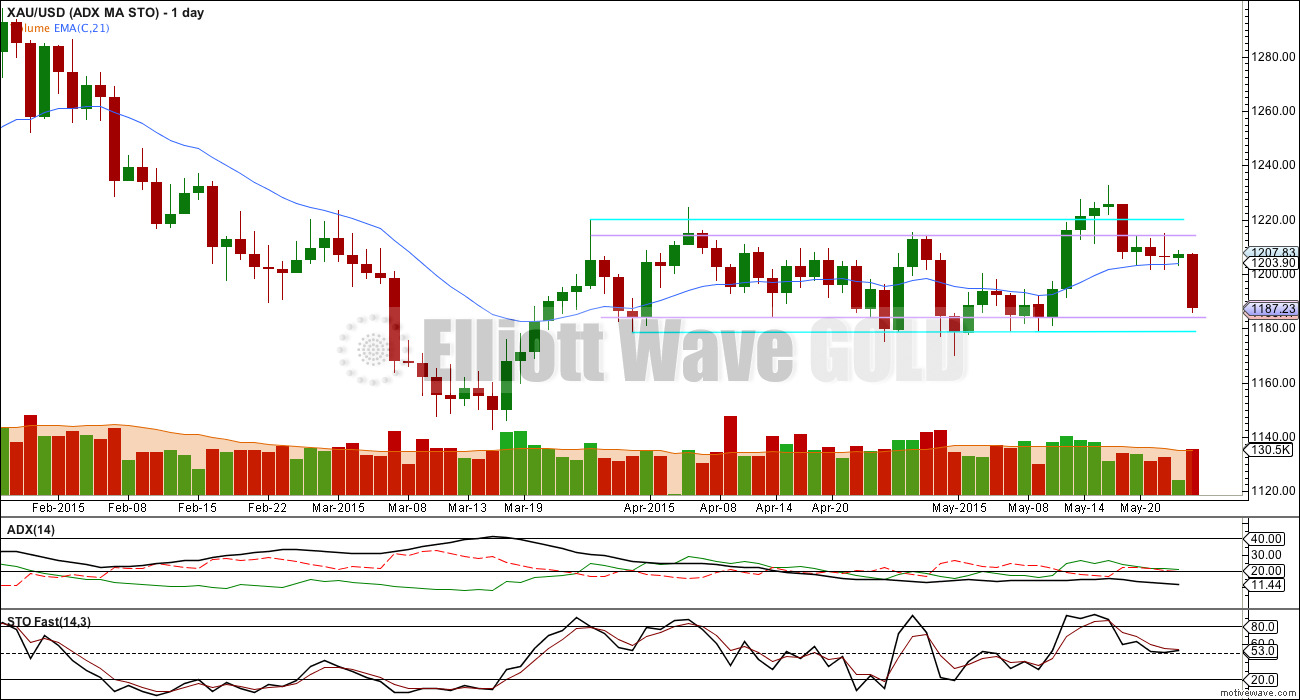
ADX remained flat to declining and below 15. This continues to indicate Gold is not within a clear trend and trending sideways. Short swings and low volatility may be expected. A range trading system may be employed, as opposed to a trend trading system.
Stochastics has moved comfortably down from overbought territory and is moving towards oversold. When data for Tuesday’s session is available for Stochastics, if it moves down to 20 or below, that may possibly indicate an end to this short downward swing.
If that happens, then the next upwards swing would be expected to start either now or very soon.
It is possible that price may move slightly lower to touch the lower lilac trend line, which provided support last on 14th April.
Trading systems for use in sideways markets (which use support and resistance within a consolidation phase and aim to profit from short swings between them) are inherently more risky than trend following systems. They may experience more losses. Because of the risk involved it is essential to follow good money management practices. Trading systems for sideways markets are not recommended for beginner or intermediate traders.
This analysis is published about 05:14 p.m. EST.
It looks like the C wave is a complete five.
Both bull and bear counts now expect a few days of upwards movement.
Because for both there are diagonals unfolding this gives us nice minimum and maximum expectations.
For the bull count the minimum is 1,232.49, maximum 1,246.37.
For the bear count the minimum is 1,237.28. The maximum is the second higher maroon trend line.
I would expect five days to get there.
Great comment Lara.
1240 may be the “maximum is the second higher maroon trend line.”
I’ll look to buy a little more GDX today.
It will be interesting to see if Gold can rally from here. The count makes sense but there seems to be no interest / strength in Gold right now
Lara, thanks for update with possible timeline before market close.
I emailed and got a reply back from your web guy about forum change to WordPress (I comment here as I do not know if you read my email). I do not know what the security issue is with Disqus but as we are not commenting on sensitive information or using bank account passwords etc, possibly we might sacrifice some security to return to the comfort of Disqus? My apologies, I’m not trying to tell you how to run your business and accept the decision you make but am also aware you strive to meet subscriber needs if you hear them. Just a thought for your consideration. Thanks.
Hi Davey – i was just going to post on this subject but noticed that you have mentioned it so I might as well chime in with you. Was wondering if/when we’ll be going back to Disqus. It’s a world of difference. I’m not really partial to this format I really hope at some point soon we can go back to the old Disqus format/platform if possible. It’s just much much easier to read and see updates very quickly
I agree. Disquis is so much better!
.618 retrace may be at 1185.71 of the $5.00 rise from low of 1183.80 at 8:22 to high of 1188.80 at 10:33 am today.
Could be wrong, but looking at the 5min nugt chart for the last 10 days, it looks like nugt still needs one more wave down, before the blast up. Anybody see it the same way?
Tham–have not heard from you today, would you offer your current opinion / wave count?
I think a 5 wave count may have finished at 1188.80 at 10:33 am. We are getting a slight correction now.
I think it is so far so good with Lara’s charts today.
Any wave counts anyone?
It looks like a complete 5 to me too. You have the wrong price listed – should be closer to 1183.89. The current movement would then not be a correction, but the start of a $50 move to the upside.
I’m curious what the catalyst will be for this one. I think it would have to be some kind of a quick shock to get that much power – Greek default, military strike, etc. – after which gold would tumble just as quickly.
Matt–how long (time) will the upside move take?
This is just a guess….but based on the duration of the prior 4 waves, I would say 5-10 trading days.
Matt-thanks, I always appreciate your comments as I also hold that as you say: “prices will eventually drop to new multiyear lows” which led me to support Bear. Recently, after Lara confirmed her Bull count could possibly take gold below 1000 in next 12 months I have let go my total commitment to Bear and am neutral or possibly lean to Bull as Bull could move to new low and then move up as worldwide economic turbulence increases.
What is your current position of Bull and Bear analysis?
I believe that the drop is imminent. There is even a remote chance that it started at 1232. Most likely to me is that gold does one last spike up and then crashes this June/July to the 1060-80 area. I anticipate the movement will be quite violent in both directions. I would then expect a longer sideways movement into the end of the year with a final price low then. However, after June/July, I am going to take my profits and walk away. Not interested in squeezing out that extra change for months of sideways torture.
Matt–thanks, sounds reasonable. I believe Lara is an exceptional EW analyst, I also like the (nebulous) work of Martin Armstrong. Is there anyone other than Lara that help form your gold picture?
I pretty much gobble up everything I can to gain many perspectives and do my own technical analysis.
To answer your question, some of my favorite authors – although they’re not always right and I don’t always agree – are Clive Maund, Florian Grummes and Jackie Chan. The latter is very accurate in terms of what COT data is telling us. I don’t subscribe to anyone but Lara.
Matt-thanks.
I should add that while the wavecount that Lara presents makes sense, I would still proceed with caution. Gold is, after all, in a larger multiyear downtrend….as well as a shorter term downtrend from 1232.
I completely agree with that sentiment. ADX remains flat indicating no clear trend, Gold remains range bound.
You asked about catalysts?
U.S. GDP data due Friday will give the market clues on the strength of the U.S. economy — and should drive gold until next Wednesday, said Chintan Karnani, chief market analyst at Insignia Consultants.
THURSDAY, MAY 28
8:30 am Weekly jobless claims May 23 270,000 274.000
10 am Pending home sales index April — 1.1%
FRIDAY, MAY 29
8:30 am GDP revision 1Q -1.0% 0.2%
9:45 am Chicago PMI May — 52.3
10 am Consumer sentiment index May — 88.6
I think Lara wrote once price trades above 1201 wave v is complete????
Movement above 1,201.60 is confirmation that downward wave C minuette wave (iv) is over.
Minute wave (v) must move above 1232.49 for hourly bull and minimum length is 53.46 for hourly bear, so 1183.80 + 53.46 = minimum 1237.26.
“If subminuette wave c for the bear wave count (and minuette wave (c) for the bull wave count) is over, this would be confirmed with a new high above 1,201.60. At that stage upwards movement may not be a fourth wave correction within subminutte wave c, and so subminuette wave c would have to be over.”
Lara: I can’t help but think that gold is completing intermediate 2 of primary 5. The duration of the current uptrend, which started in March, would then make perfect sense and there would be no reason to call it ridiculous. 🙂 The upper edge of the channel on your daily charts would also fit with the anticipated upside price targets.
I realize that you have already dismissed the idea that primary 4 ended at 1308 and that I am sounding like a broken record, but is there really no way? Sure, primary 4 was much longer than primary 2. However, it still seems within reason. Are triangles not permitted to slope downward, or is there a more severe problem with the idea?
In the end, it probably doesn’t matter (at least at this point in time) if this is intermediate 2 or minor 2. As long as the channel holds, price should turn down hard from there. I have no doubt that prices will eventually drop to new multiyear lows.
I completely understand if you don’t want to reply at length to every subscriber’s silly ideas, but could I ask for 1-3 quick bullet points on the major reasons why primary 4 did not end at 1308?
You’re the best Elliottician in the world and I consider myself lucky to have discovered you. I mean that most sincerely. Thank you and keep up the fantastic work!
No, triangles cannot slope downwards or upwards. See the video on the education page “triangles” for the rules and you will see why.
If primary wave 4 is still unfolding then the attached alternate idea is the only reasonable explanation. It has the following problems:
1. intermediate (2) and all following movement breaches a base channel drawn about primary waves 1 and 2. it should not do this.
2. primary wave 2 is a deep zigzag and primary wave 4 would be an incomplete shallow zigzag. there is no alternation in structure. this is highly unusual for Gold
3. intermediate waves (2) and (4) are much longer in duration than primary wave 2, one degree higher. they should be more brief.
4. the Fibonacci ratio between primary waves 3 and 1 is much weaker; primary 3 is $44 longer than 1.618 the length of primary wave 1. this is just less than a 10% variation so I would consider it acceptable, but the main weekly wave count has a much closer ratio of $12.53 off 1.618 the length of primary wave 1.
I have published this idea before in comments. I will never publish it as a viable alternate because it has a much lower probability than the main weekly wave count.
If there is a wave count which resolves all of the above problems, has a close Fibonacci ratio between the first and third wave, has perfect alternation and almost perfect proportion between the second and fourth waves then that is much more likely. While alternates should be considered, if they suffer from as many big problems as this one does they should not be given undue weight.
Lara, was there supposed to be a chart included here? I’m guessing that you may have added one and it didn’t post. I added a chart last Friday after you switched to WordPress comments and it showed the image in a little thumbnail, but it never showed up after I submitted the comment. There may be an issue with posting an image.
Yes, there is an issue, and it will be fixed ASAP.
Since there is no chart and I cannot see exactly what you are referring to, so I will take your word for it. I know that you have discussed all of these ideas at length in the past, was just having trouble locating them.
I look forward to the day that sideways movement is over. This can be profitable for some, but for me it is just tiresome.
Thank you for the thorough reply.
I’m sorry. Technical issues I am having.
Trying again to upload the chart….
and yes, my comment makes little sense without it!
I look forward to that day very much too. This sideways chop is a nightmare to analyse and get right.