
Upwards movement was expected. The main Elliott wave counts remain the same, and a new bearish alternate will be added to daily analysis.
Summary: Both bull and bear wave counts still expect upwards movement for a few days. The bull wave count has a minimum requirement at 1,232.49 and a maximum at 1,242.91. Upwards movement for the bull count may last about another four days. The bear count requires upwards movement to a minimum at 1,233.82 and its maximum is the upper maroon trend line on the daily chart. It may last a little longer, maybe a further seven days. I favour the bull wave count.
To see weekly charts for bull and bear wave counts go here. Changes to last analysis are italicised.
Bull Wave Count
Click chart to enlarge.
The bull wave count sees primary wave 5 and so cycle wave a a complete five wave impulse on the weekly chart.
Pros:
1. The size of the upwards move labelled here intermediate wave (A) looks right for a new bull trend at the weekly chart level.
2. The downwards wave labelled intermediate wave (B) looks best as a three.
3. The small breach of the channel about cycle wave a on the weekly chart would be the first indication that cycle wave a is over and cycle wave b has begun.
Cons:
1. Within intermediate wave (3) of primary wave 5 (now off to the left of this chart), to see this as a five wave impulse requires either gross disproportion and lack of alternation between minor waves 2 and 4 or a very rare running flat which does not subdivide well.
2. Intermediate wave (5) of primary wave 5 (now off to the left of the chart) has a count of seven which means either minor wave 3 or 5 looks like a three on the daily chart.
3. Expanding leading diagonals (of which intermediate wave (A) or (1) is) are are not very common (the contracting variety is more common).
4. The possible leading diagonal for minor wave 1 and particularly minute wave ii within it look too large.
For volume to clearly support the bull wave count it needs to show an increase beyond 187.34 (30th April) and preferably beyond 230.3 (9th April). Only then would volume more clearly indicate a bullish breakout is more likely than a bearish breakout.
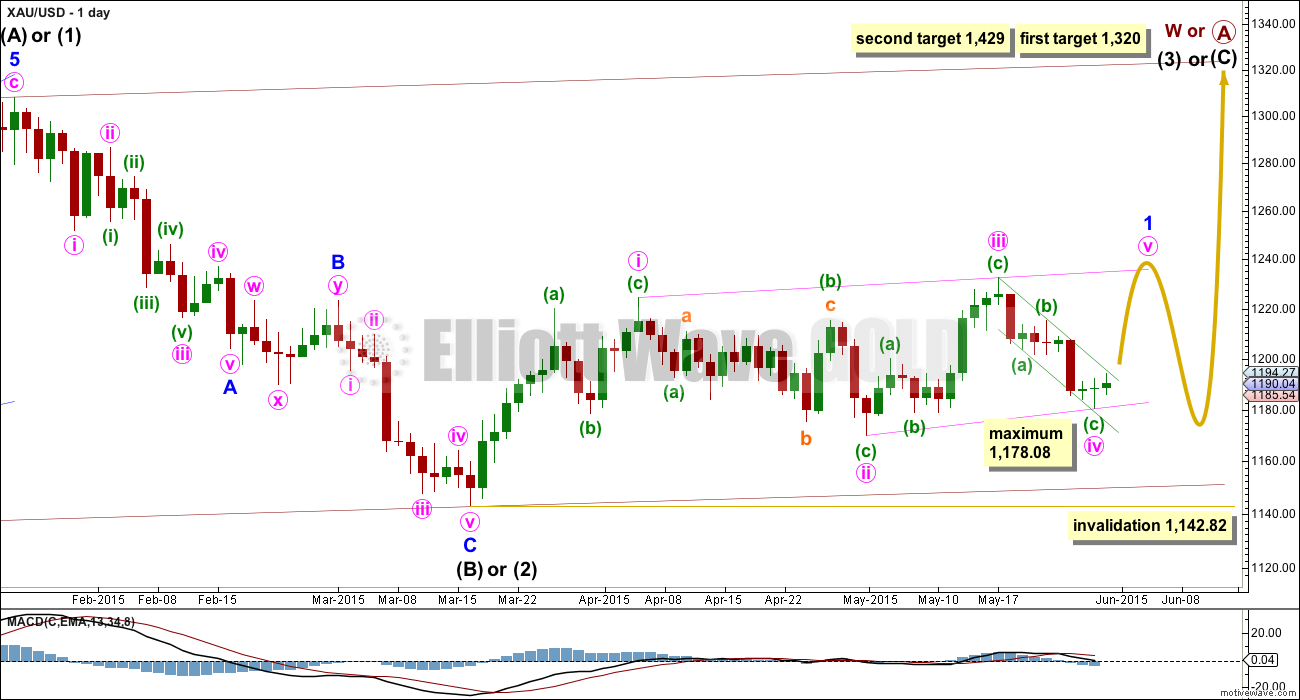
Within cycle wave b, primary wave A may be either a three or a five wave structure. So far within cycle wave b there is a 5-3 and an incomplete 5 up. This may be intermediate waves (A)-(B)-(C) for a zigzag for primary wave A, or may also be intermediate waves (1)-(2)-(3) for an impulse for primary wave A. At 1,320 intermediate wave (C) would reach equality in length with intermediate wave (A) and primary wave A would most likely be a zigzag. At 1,429 intermediate wave (3) would reach 1.618 the length of intermediate wave (1) and primary wave A would most likely be an incomplete impulse.
Intermediate wave (A) subdivides only as a five. I cannot see a solution where this movement subdivides as a three and meets all Elliott wave rules (with the sole exception of a very rare triple zigzag which does not look right). This means that intermediate wave (B) may not move beyond the start of intermediate wave (A) below 1,131.09. That is why 1,131.09 is final confirmation for the bear wave count at the daily and weekly chart level.
Intermediate wave (C) is likely to subdivide as an impulse to exhibit structural alternation with the leading diagonal of intermediate wave (A). This intermediate wave up may be intermediate wave (3) which may only subdivide as an impulse.
It is possible that the intermediate degree movement up for the bull wave count is beginning with a leading diagonal in a first wave position for minor wave 1.
A leading diagonal must have second and fourth waves which subdivide as zigzags. The first, third and fifth waves are most commonly zigzags, but sometimes they may be impulses. The fourth wave must overlap first wave price territory.
Within diagonals, the most common depth of the second and fourth waves is between 0.66 and 0.81. Minute wave ii is 0.67 of minute wave i. So far minute wave iv is 0.83 of minute wave iii, a little deeper than normal range.
The maximum depth for minute wave iv is at 1,178.08 where it would reach equality in length with minute wave ii. Because the diagonal is contracting the fourth wave may not be longer than equality with the second wave, should be shorter, and the trend lines should converge. Minute wave iv is now extremely likely to be over.
Second wave corrections following leading diagonals in first wave positions are commonly very deep. When this leading diagonal structure for minor wave 1 is complete, then minor wave 2 should unfold lower, may be expected to reach at least the 0.618 Fibonacci ratio of minor wave 1 or may be quite a bit deeper than that, and may not move beyond the start of minor wave 1 below 1,142.82.
Click chart to enlarge.
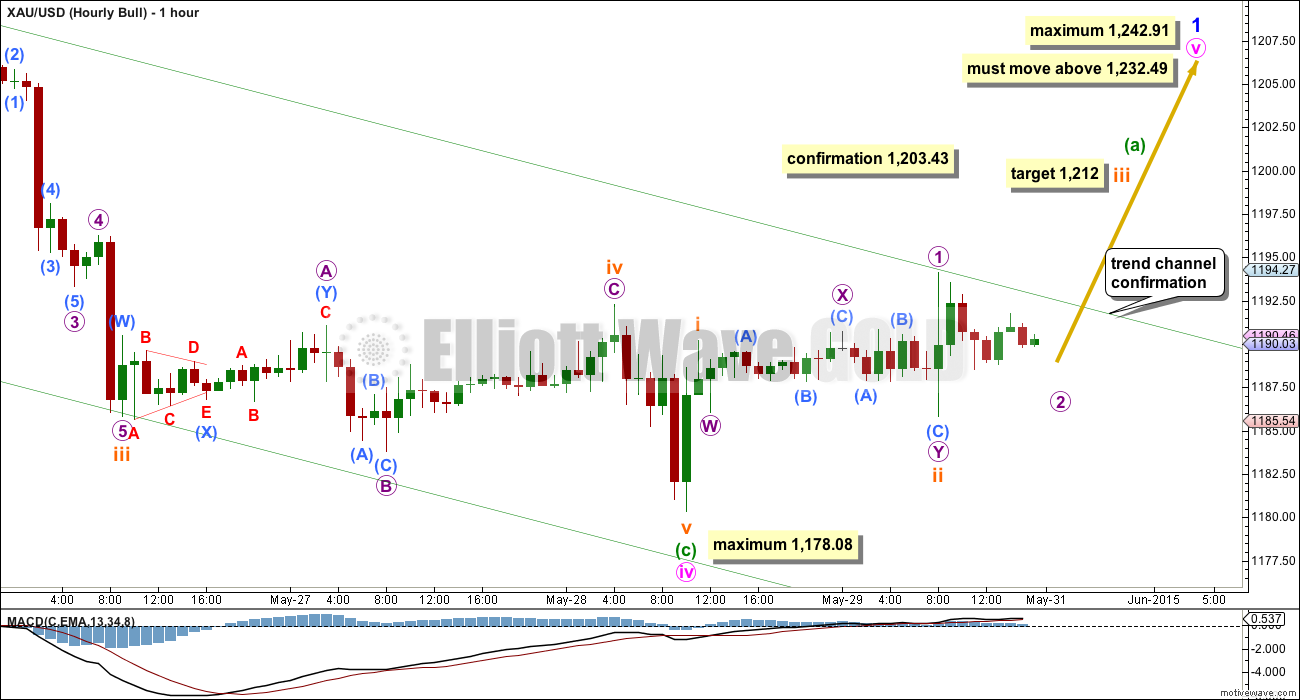
Minuette wave v may have begun with two overlapping first and second waves. When price breaks through resistance at the upper edge of the channel copied over here from the daily chart, then upwards momentum may increase as the middle of a third wave unfolds.
Minute wave v is most likely to be a zigzag. Because the diagonal is contracting, minute wave v may not be longer than equality with minute wave iii and may not move above 1,242.91.
For a leading diagonal, minute wave v may not be truncated and must move above the end of minute wave iii at 1,232.49.
When minuette waves (a) and (b) are complete, then a target may be calculated using the Fibonacci ratio between minuette waves (a) and (c).
The risk remains that my wave count is wrong and the next move may be down not up, while price remains within the downwards sloping channel. At this stage I would judge this wave count to have a slightly better than 50% probability compared to the bearish alternate below. When this channel is breached the probability will increase that the next move is up and should then be in its early stages. At that stage I would have a reasonable level of confidence that the next upwards swing has begun. While price remains within the channel I will leave the invalidation point at 1,178.08. If minute wave iv continues any further it may not move below this point.
At 1,212 subminuette wave iii would reach 2.618 the length of subminuette wave i.
A new high above 1,203.43 would invalidate the alternate bear wave count below. At that stage I would have a lot of confidence that upwards movement should continue to above 1,232.
Main Bear Wave Count
Click chart to enlarge.
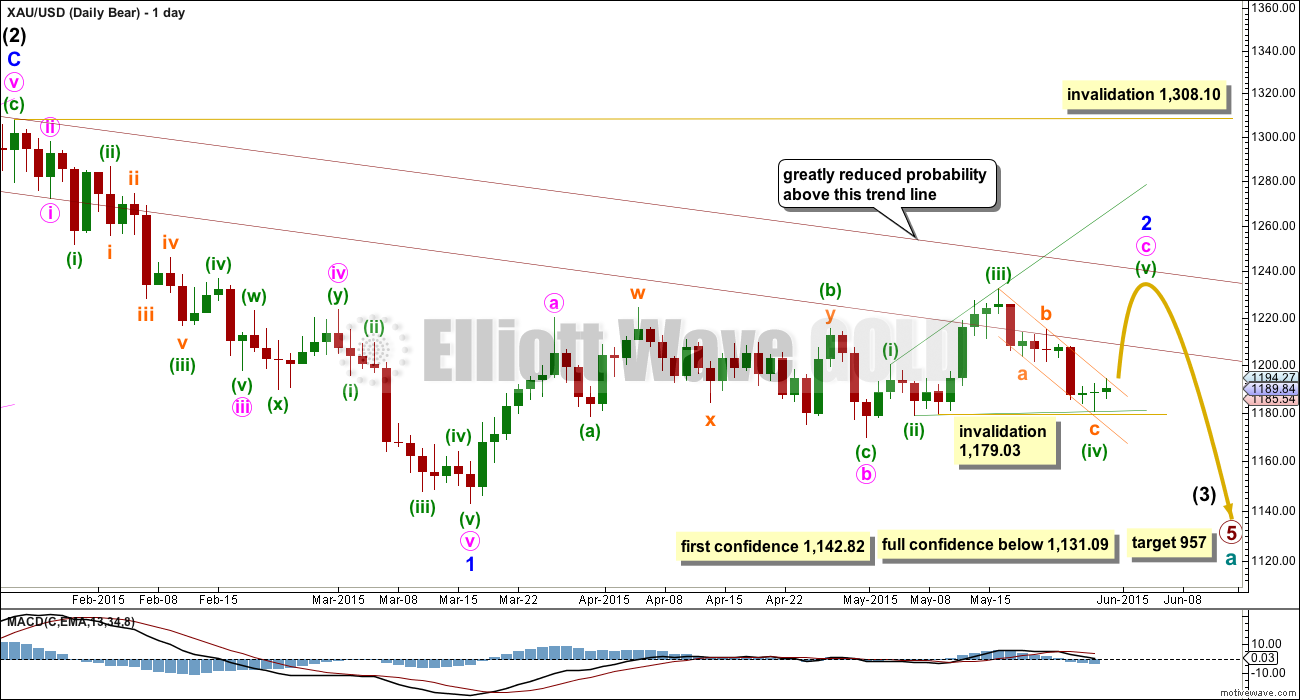
This wave count follows the bear weekly count which sees primary wave 5 within cycle wave a as incomplete. At 957 primary wave 5 would reach equality in length with primary wave 1.
Pros:
1. Intermediate wave (1) (to the left of this chart) subdivides perfectly as a five wave impulse with good Fibonacci ratios in price and time. There is perfect alternation and proportion between minor waves 2 and 4.
2. Intermediate wave (2) is a very common expanded flat correction. This sees minor wave C an ending expanding diagonal which is more common than a leading expanding diagonal.
3. Minor wave B within the expanded flat subdivides perfectly as a zigzag.
Cons:
1. Intermediate wave (2) looks too big on the weekly chart.
2. Intermediate wave (2) has breached the channel from the weekly chart which contains cycle wave a.
3. Minor wave 2 is much longer in duration than a minor degree correction within an intermediate impulse normally is for Gold. Normally a minor degree second wave within a third wave should last only about 20 days maximum. This one is in its 53rd day and it is incomplete. It is now starting to look ridiculous; this is becoming a serious problem for the bear wave count.
4. Within minor wave 1 down, there is gross disproportion between minute waves iv and ii: minute wave iv is more than 13 times the duration of minute wave i, giving this downwards wave a three wave look.
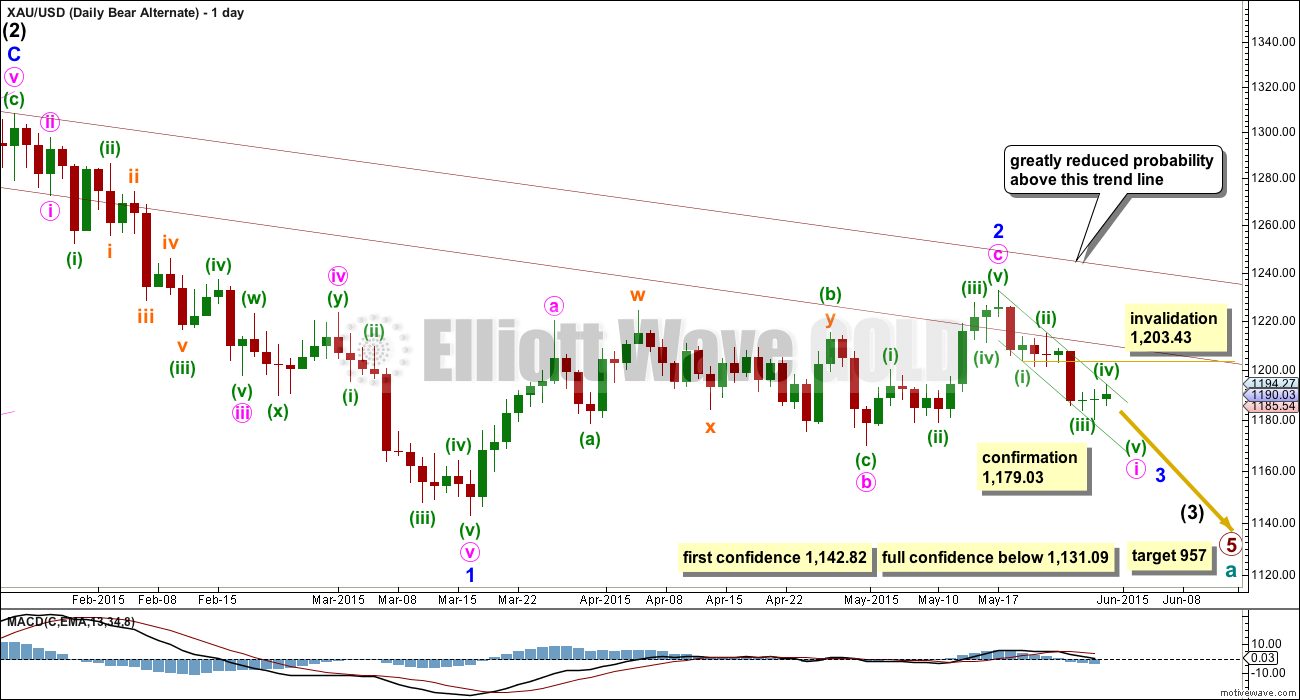
This bear wave count now needs minute wave c upwards to complete as a five wave structure which looks most likely at this stage to be an ending expanding diagonal.
Minor wave 2 may not move beyond the start of minor wave 1 above 1,308.10. However, this wave count would be substantially reduced in probability well before that price point is passed. A breach of the upper maroon trend line, a parallel copy of the upper edge of the channel copied over from the weekly chart, would see the probability of this wave count reduced so much it may no longer be published before price finally invalidates it.
When the ending diagonal structure is complete, then this bear wave count expects a strong third wave down for minor wave 3 within intermediate wave (3). At that stage, a new low below 1,142.82 would provide strong indication that the bear wave count would be more likely than the bull wave count. Only a new low below 1,131.09 would provide full confidence.
Click chart to enlarge.
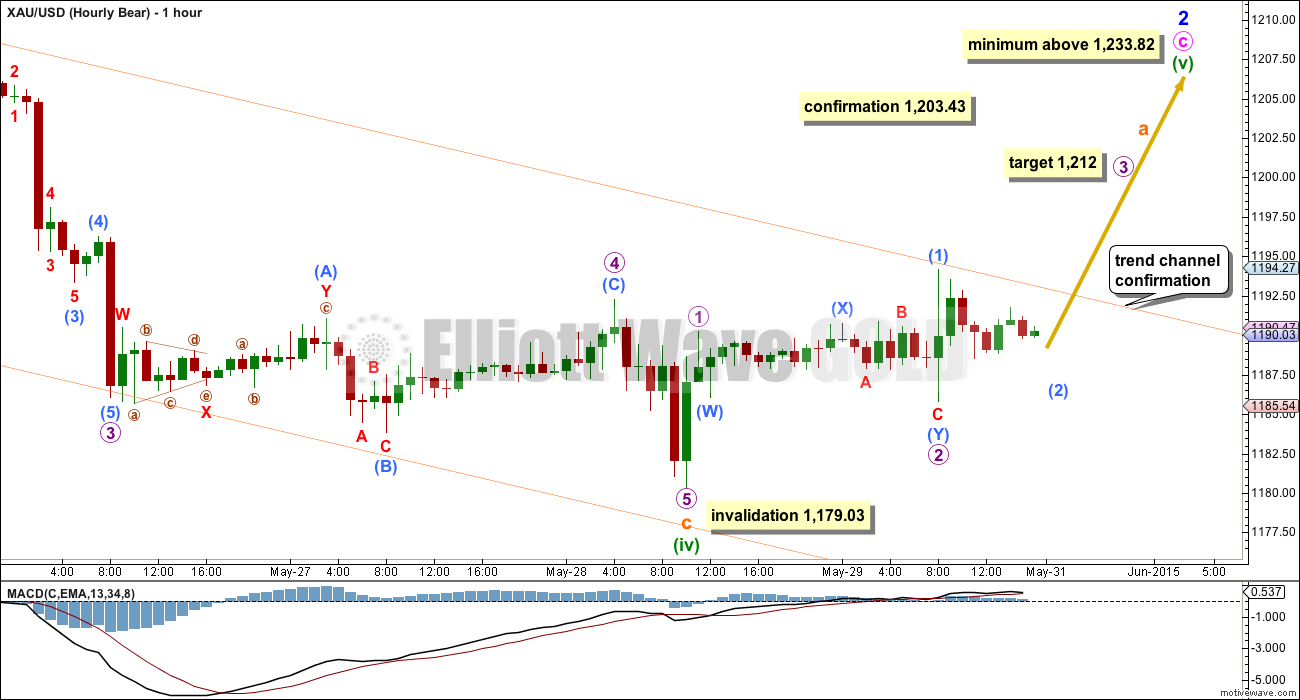
This bear wave count also expects a zigzag up to have recently begun.
The ending diagonal of minute wave c is expanding. Minuette wave (v) must be longer than equality in length with minuette wave (iii), so it must move above 1,233.82.
Trend channel confirmation is still required for a reasonable level of confidence that the upwards wave has begun.
If minuette wave (iv) continues it may not move beyond the end of minuette wave (ii) below 1,179.03.
Alternate Bear Wave Count
Click chart to enlarge.
It is possible for the bear wave count that minor wave 2 is over as a zigzag. Minute wave c does not have a very good five wave look to it on the daily chart.
A strong third wave down has begun, if this wave count is correct. A new low below 1,179.03 would increase the probability of this wave count to over 50%.
Within minor wave 3, minute wave i may be an incomplete impulse. Within minute wave i, minuette wave (iv) may not move into minuette wave (i) price territory above 1,203.43. This is why 1,203.43 would provide confidence in the main wave counts.
Technical Analysis
Click chart to enlarge.
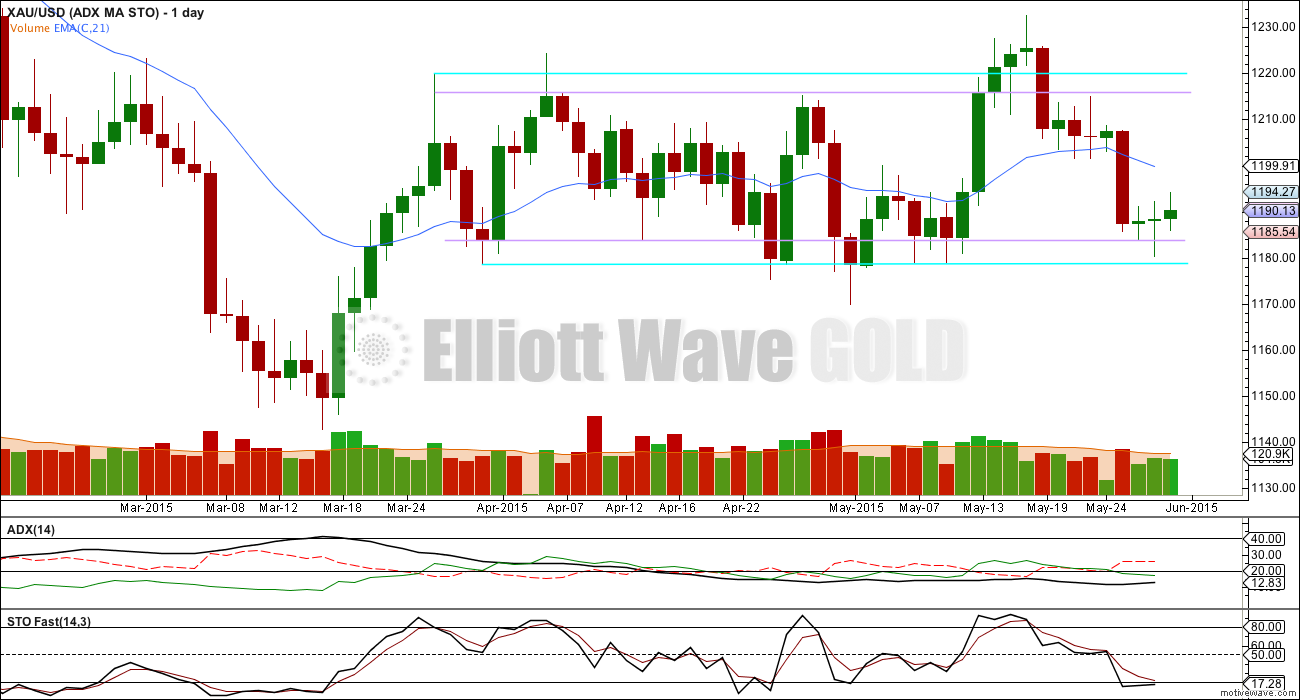
ADX remains below 15. No clear trend is evident still. A range bound trading system (sometimes called a swing trading system) should be employed as opposed to a trend following system.
An oscillator should be used to indicate support and resistance, and in this case for Gold the horizontal trend lines also show nicely where price is finding support and resistance. At this stage this approach expects an upwards swing from here, back up to the upper trend lines. I have chosen to use fast Stochastics as an oscillator because it nicely shows overbought and oversold, and is showing where each swing ended and the next began.
When using a range bound trading system the +DX and -DX lines are not used to indicate direction. Direction is indicated by Stochastics and the trend lines. Support and resistance are used.
The risk with this approach is that price could move lower and overshoot the lower aqua blue trend line before it returns to the upper trend lines.
A close of 3% or more of market value above or below the outer aqua blue trend lines, along with ADX moving higher above 15, is required to indicate an end to this range bound market and the start of a new trend.
This analysis is published about 05:15 p.m. EST.
GLD, GDX, GDXJ, and JNUG are all on the Buying on Weakness list at wsj.com.
This was updated afterhours. GLD was on the buying on weakness list to the tune of $97 million…that number is extremely large, probably the biggest I can remember in months.
To be clear, it was $97M in block trades, $99.85M in uptick money flow.
Hi Ben (MTLSD). Glad you are still here! Sorry I could not respond to you sooner–had some urgencies come up aside from market decision making.
Good info on the buying on weakness & block trades. Thanks for sharing. Signing off till tomorrow.
I am going to keep publishing that bearish alternate with some adjustment. It now sees a series of four overlapping first and second waves; it would expect an extremely strong move down from here. The confirmation point for it initially is 1,184.58. Next confirmation 1,180.36. Of the two bear wave counts it does have some points in its favour, particularly a shorter duration of minor wave 2. I do think it has a lower probability than the main bull wave count which I still favour at this stage.
The velocity of upward movement hints at the main counts being correct.
On the hourly chart I now have two overlapping first and second waves. This indicates a strong increase in upwards momentum for the next third wave up. It should be the middle of a third wave. The target for the next wave up is at 1,220. The invalidation point is so close by at 1,184.58.
For the bearish alternate it is only possible now if there is a series of overlapping first and second waves down. This idea has so many problems with it at the moment I am considering not publishing it at all.
If Lara’s wavecounts are correct, get ready for explosive upside movement from here. A 3rd wave should be underway momentarily.
That is what I am thinking, looking at the 3min nugt, today’s high was the end of wave 5 of one, and now we got a deep wave 2. Big upside move coming up next in a 3rd wave.
The next target should be close to the 1220 area, but will wait for today’s analysis.
Lara: while we got some solid upside confirmations today, could you please confirm that today’s high was not simply a 2nd wave retracement of the movement from 1232-1180. Thanks.
I can’t give 100% confirmation that this downwards move is over. What I can say is the prior up move subdivides nicely as an impulse on the five minute chart, and this down move can be either a five or a three. So far it’s an 83.5% correction. It’s an extremely deep second wave. The probability that it is over now is very high, but I can’t say it’s 100%.
It’s finding support close to the upper edge of the channel which previously provided resistance, another indicator that the probability that downwards movement is over here is very high.
The next wave should be a third of a third. It should be strong.
This should be it for downward movement. If gold goes below 1185 now, I would abandon long positions.
Agreed. My invalidation point will have to be 1,184.58. And that’s very close by indeed. On a positive note though, it does offer a very low risk at this time. If I’m wrong we shall know quickly… If I’m right then a strong third wave up should begin pretty much now. Although… with Gold’s recent behaviour I wouldn’t be surprised if it drifts sideways in a narrow range from here for several hours testing our patience.
I am assuming that the current movement is some kind of 1-2, 1-2. Aside from the confirmation point being successfully broken, there was a lot of power behind today’s earlier movement, so it may turn up soon. If I am viewing this correctly, the breached channel is now providing some support.
Gold has now achieved all 3 of Lara’s confirmation targets.
1st was Friday above 1192.29
2nd has today moved above 1203.43 at 9:53 am
3rd has today achieved trend channel confirmation with 2 hours 10:00 to 12:00 with at least one hour above the upper trend channel on the main bear daily & hourly charts.
A new high above 1,203.43 would invalidate the alternate bear wave count below. At that stage I would have a lot of confidence that upwards movement should continue to above 1,232.
Gold Forms Bullish Outside Day
http://www.kitco.com/news/2015-06-01/Gold-Forms-Bullish-Outside-Day-Watch-Dow-Theory-Divergence.html
Looks like we just his the 61.8 retrace on gold from the 1184 to 1204 move.
.618 target is at 1,192.19
1204.38 high at 9:54 am
1184.66 low at 6:43 am
19.72 difference x .618 = 12.19
1204.38 – 12.19 = 1,192.19 retrace .618 target
This may or may not happen or may stay above .618 or go even lower. This calculation may not be correct as could use low of a prior day?
Any wave counts or retrace projections anyone?
2 more US news came out at 10:00 am that were stronger than expected and immediately the US dollar spiked up and gold began dropping from 1,204.38 the high of the day.
Gold doesn’t yet have ‘trend channel confirmation’ for Lara of 1 full hourly candlestick above upper trend channel on daily/hourly bear count.
Gold went above 1,203.43 at 9:53 am = Full Confirmation.
At that stage above 1,203.45 I would have a lot of confidence that upwards movement should continue to above 1,232.
1,203.43 would provide confidence in the main wave counts.
A new high above 1,203.43 would invalidate the alternate bear wave count below.
Richard,
Good morning! Looks like we are headed, atleast short-term, for an up move. May I ask how are you going to play this. FX or in stock? And are you going to play it now, or wait further? Just curious really. Were’s Tham been lately? Glad you’re posting- otherwise been rather quiet. No MTLSD, mortgagefree, Mark, oh well.
I’m here. (MTLSD).
I am currently long full position in JNUG. Sold some last week at $23.80, bought it back at $22.27.
I started with some GDX today and should of sold it at today’s high.
I did buy more GDX at 19.57 as gold already retraced .618 although it may move lower. All 3 of Lara’s confirmations are now achieved, which is a more confident time to buy. I will just hold GDX and wait for Lara’s comments. I only trade gold miners ETFs.
This news Spiked Gold up $14 in 24 minutes to $1,202.77 high
– Reduction in US Consumer spending news – issued 9:00 am
http://www.marketwatch.com/story/consumer-spending-softens-again-in-april-2015-06-01
looks like 5 waves down from $1197.50ish possibly trying to complete. Is minute i trying to complete for the alternate bear count?
Commercial reduced short by huge amount and Spec reduced long at the same time. Expect Gold to go up in near term to 1230 area????
On 5/22 just the opposite happen and gold was taken down.
——————————————————–
Recent trend in COT:
Commercial shorts:
5/29: 322849 -38800
5/22/: 361651 +52850
5/15: 308799 +9000
5/8: 299017 -neg
5/1: 317220 -neg
4/24: 319988 -neg
4/17: 321752
—————————————
Spec Longs:
5/29 : 196803 -11254
5/22: 208057 + 25344
5/15: 182713 +up
5/8: 177256 -neg
5/1: 197331 +up
4/24: 194116 +up
4/17: 193390
S7P still bullish and will not change for some time. Here is a simple analysis using MA and ratio.
Market SPX
I have to agree with Syed, I almost always play the short side of Gold because I have felt we must have capitulation in Gold and I don’t want to get caught long when it happens. However it looks like we are stuck in a range between 1180 and 1220, so I’m hesitant to go short here, when a return to the 1220s looks likely, and maybe this sideways correction that we have been in for so long is it! my head hurts, I’m going to be patient and wait for a more obvious entry point, good luck!!
And yes, thank you Lara for all the hard work! I love the fact your adding more TA with no increase in price!!
Lara, thanks for your, One of a Kind, Legendary Analysis, truly a pleasure to receive and to enjoy reading and viewing. Two Thumbs Up!
The legendry analysis I hope gets us to see Gold price down to $957 (I believe it will!)…. SENTIMENT: Mondays trade looks to be bottoming at currents levels but also don’t expect Gold price to rise much above 1194 for possible 1196-97 (50dma) for a drop back down to take out the 1186 low made on Friday (Gold price is bearish down trending; stochastic is bearish but Fast SlowK is up for a likely up move to occur…. 20dma looks like heading to drop below 50dma, that should cause some turbulence signaling short sell and close)…. On Weekly Outlook basis, although upside move is expecting, would look to initiate shorts (Fast stochastic SlowK crossed below SlowD). Perhaps retracement levels from H 1232 / L 1180 would be the likely place to go short from…. First off, as Lara has mentioned Gold price would need to rise above 10dma which is dropping and likely to break below 20dma creating bearish pressure; then there is 20weekMA (1207-08) that would provide resistance…. Basically, as long as Gold price is below 100dma/200dma, I am bearish Gold and keeping it short~!
You’re welcome as always Richard