
Lower highs and lower lows and volume continue to favour the bear Elliott wave count.
Summary: In the very short term one final small fifth wave down to 1,177 would complete an impulse for both wave counts at the hourly chart level. Thereafter, they again diverge. The bear count then expects a fourth wave correction which may not move into first wave price territory above 1,195.49. The bull wave count expects new highs. The mid term target for the bear wave count remains the same at 1,081 and may be met in six more days. The bull wave count requires movement above 1,224.35. Volume again favours the bear wave count.
Click on charts to enlarge.
To see weekly charts for bull and bear wave counts go here.
Bull Wave Count
The bull wave count sees primary wave 5 and so cycle wave a a complete five wave impulse on the weekly chart. In order for members to judge for themselves I will list all points for and against for bull and bear wave counts.
Pros:
1. The size of the upwards move labelled here intermediate wave (A) looks right for a new bull trend at the weekly chart level.
2. The downwards wave labelled intermediate wave (B) looks best as a three.
3. The small breach of the channel about cycle wave a on the weekly chart would be the first indication that cycle wave a is over and cycle wave b has begun.
Cons:
1. Within intermediate wave (3) of primary wave 5 (now off to the left of this chart), to see this as a five wave impulse requires either gross disproportion and lack of alternation between minor waves 2 and 4 or a very rare running flat which does not subdivide well.
2. Intermediate wave (5) of primary wave 5 (now off to the left of the chart) has a count of seven which means either minor wave 3 or 5 looks like a three on the daily chart.
3. Expanding leading diagonals are are not very common (the contracting variety is more common).
4. Volume continues to not support this bull wave count. If a third wave up is beginning volume should show an increase, not a decrease. “When prices are rising volume decreasing is questionable.” (Kirkpactrick and Dahlquist)
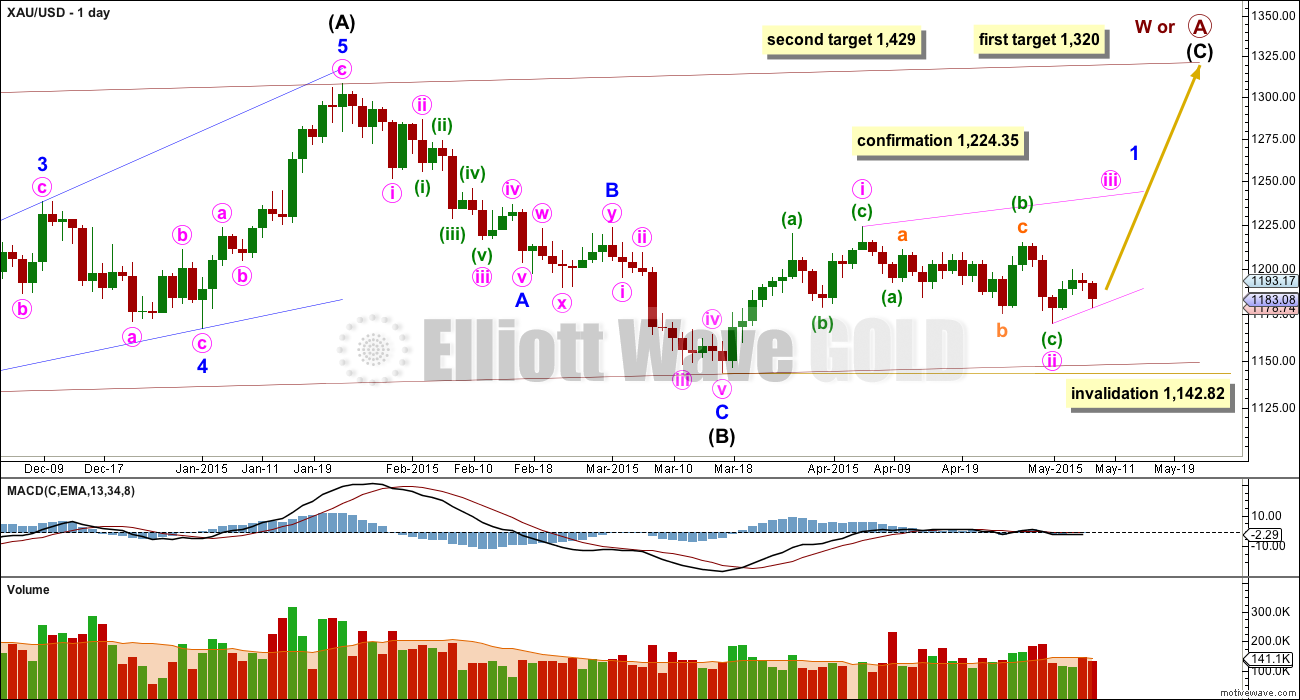
Within cycle wave b primary wave A may be either a three or a five wave structure. So far within cycle wave b there is a 5-3 and an incomplete 5 up. This may be intermediate waves (A)-(B)-(C) for a zigzag for primary wave A, or may also be intermediate waves (1)-(2)-(3) for an impulse for primary wave A.
Intermediate wave (A) subdivides only as a five. I cannot see a solution where this movement subdivides as a three and meets all Elliott wave rules (with the sole exception of a very rare triple zigzag which does not look right). This means that intermediate wave (B) may not move beyond the start of intermediate wave (A) below 1,131.09. That is why 1,131.09 is final confirmation for the bear wave count at the daily and weekly chart level.
Intermediate wave (B) is a complete zigzag. Because intermediate wave (A) was a leading diagonal it is likely that intermediate wave (C) will subdivide as an impulse to exhibit structural alternation. If this intermediate wave up is intermediate wave (3) it may only subdivide as an impulse.
At 1,320 intermediate wave (C) would reach equality in length with intermediate wave (A), and would probably end at the upper edge of the maroon channel. At 1,429 intermediate wave (C) or (3) would reach 1.618 the length of intermediate wave (A) or (1). If this target is met it would most likely be by a third wave and intermediate wave (C) would most likely be subdividing as a five wave impulse.
It is possible that the intermediate degree movement up for the bull wave count is beginning with a leading diagonal in a first wave position for minor wave 1.
A leading diagonal must have second and fourth waves which subdivide as zigzags. The first, third and fifth waves are most commonly zigzags but sometimes they may be impulses.
Within diagonals the most common depth of the second and fourth waves is between 0.66 and 0.81. Minute wave ii is 0.67 of minute wave i.
Minute wave ii may not move beyond the start of minute wave i below 1,142.82.
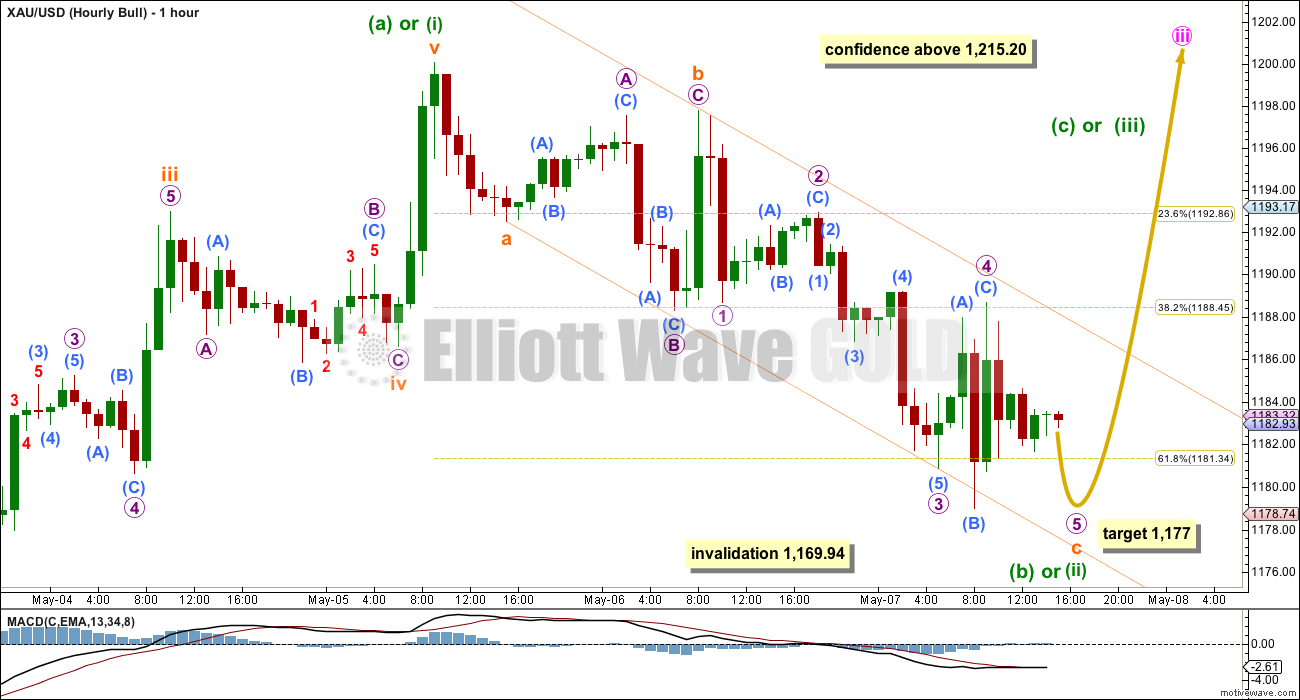
Minute wave iii may subdivide as either a zigzag or an impulse. This bull wave count must consider both structural possibilities. So far only minuette wave (a) or (i) would be complete. Minuette wave (b) or (ii) is almost complete.
Within minuette wave (b) or (ii) subminuette waves a and b are complete. Subminuette wave b is a common expanded flat correction. Subminuette wave c is extending. At 1,177 subminuette wave c would reach 2.618 the length of subminuette wave a, and micro wave 5 within it would reach equality in length with micro wave 1.
The channel drawn here is a best fit. When it is clearly breached by upwards movement that shall be an indication that minuette wave (c) or (iii) up may be underway.
Minuete wave iii must move beyond the end of minute wave i above 1,224.35.
I would have some confidence in this bull wave count if price moves above 1,215.20.
Bear Wave Count
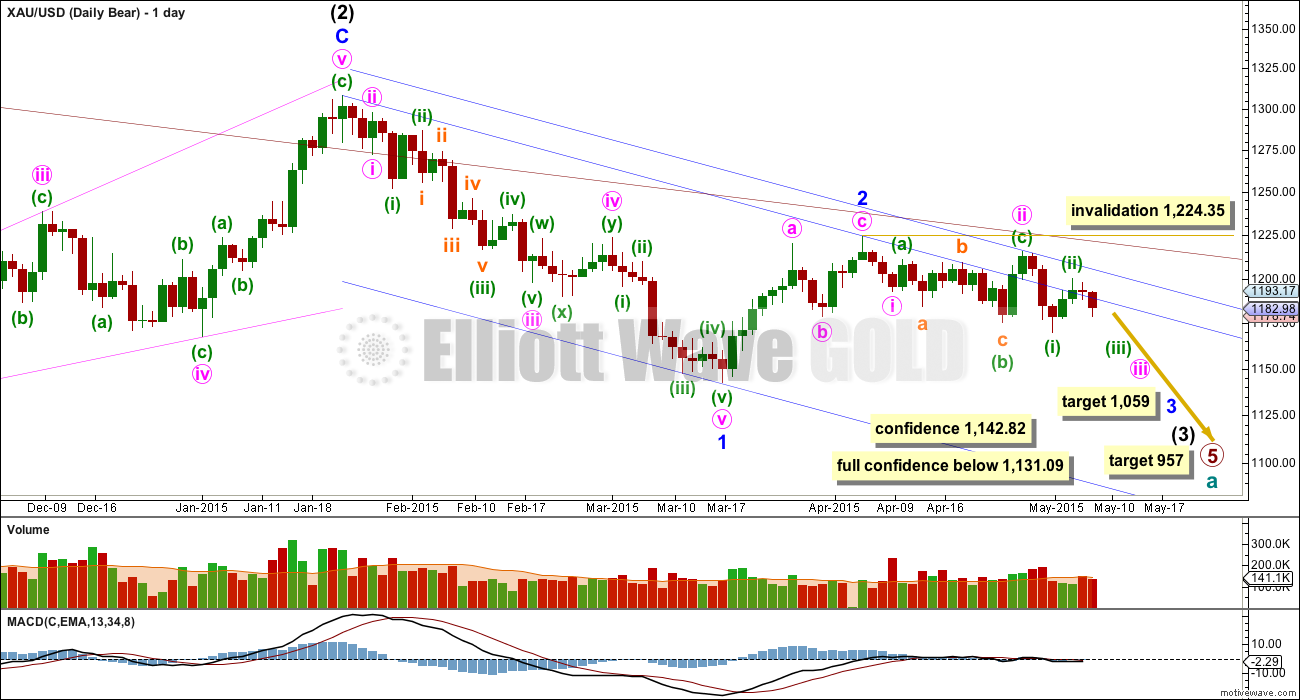
This wave count follows the bear weekly count which sees primary wave 5 within cycle wave a as incomplete. At 957 primary wave 5 would reach equality in length with primary wave 1.
Pros:
1. Intermediate wave (1) (to the left of this chart) subdivides perfectly as a five wave impulse with good Fibonacci ratios in price and time. There is perfect alternation and proportion between minor waves 2 and 4.
2. Intermediate wave (2) is a very common expanded flat correction. This sees minor wave C an ending expanding diagonal which is more common than a leading expanding diagonal.
3. Minor wave B within the expanded flat subdivides perfectly as a zigzag.
4. Volume consistently supports the idea that the trend is currently down.
Cons:
1. Intermediate wave (2) looks too big on the weekly chart.
2. Intermediate wave (2) has breached the channel from the weekly chart which contains cycle wave a.
3. Minute wave ii breaches a base channel about the first and second wave one degree higher, minor waves 1 and 2. It is deeper and longer lasting than normal for a low degree second wave within a third wave one and two degrees higher.
4. Within minor wave 1 down there is gross disproportion between minute waves iv and ii: minute wave iv is more than 13 times the duration of minute wave i, giving this downwards wave a three wave look.
This wave count now expects to see a strong increase in downwards momentum as a third wave unfolds. At 1,059 minor wave 3 would reach equality in length with minor wave 1, and both would be extended.
Within minor wave 3, if minute wave ii continues further as a double flat or combination then it may not move beyond the start of minute wave i above 1,224.35.
Draw a blue base channel about minor waves 1 and 2. Create a parallel copy and push it up to sit on the high of minute wave ii, then copy these trend lines over to the hourly chart. Look for upwards movement to find resistance at the blue trend lines.
Volume for Thursday is slightly lower than Wednesday, but both days saw price move lower on volume which was higher than the prior two up days. Volume is clear, bears are more active pushing price lower. Volume consistently indicates a downward breakout is more likely than upward.
The bear wave count now sees Gold as within a subminuette degree first wave, within a minuette degree third wave, within a minute degree third wave, within a minor degree third wave, within an intermediate degree third wave. The trend at cycle degree remains down.
Once subminuette waves i and ii are complete then downwards movement should begin to show a very strong increase in downwards momentum, and down days should continue to show higher volume than up days.
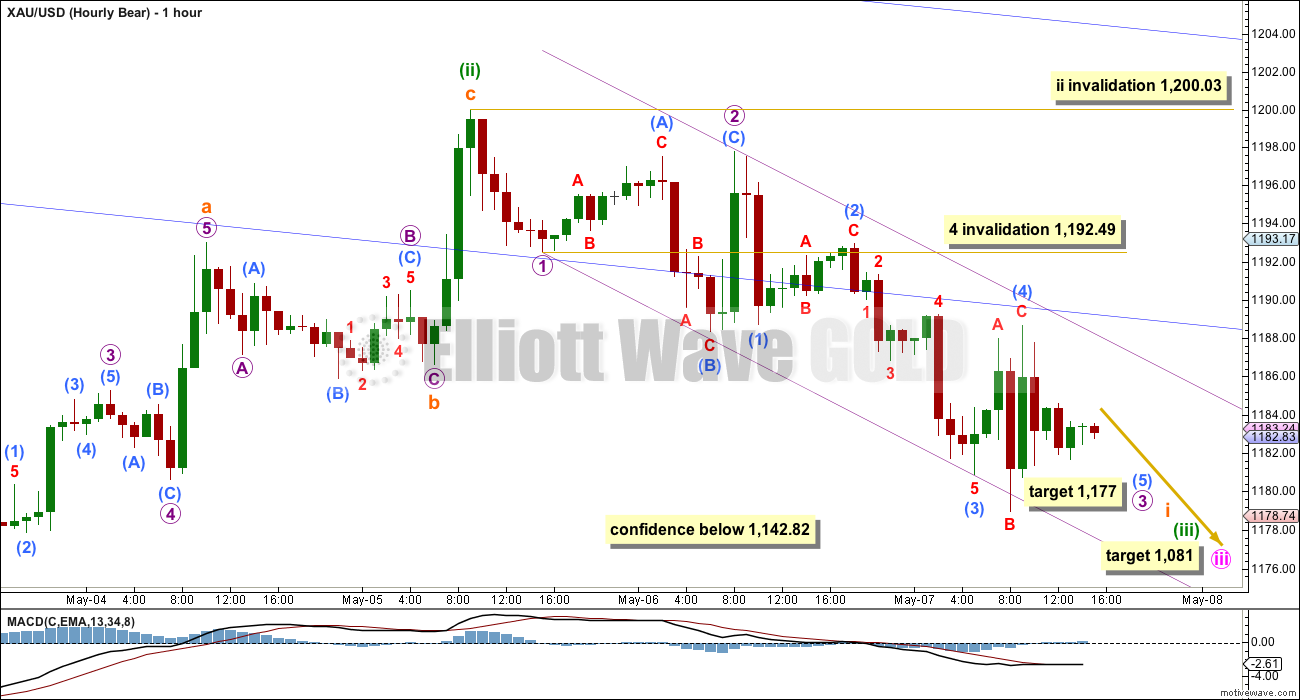
In the very short term downwards movement for bull and bear wave counts is seen in the same way, because A-B-C of a zigzag and 1-2-3 of an impulse both subdivide 5-3-5 (they are exactly the same).
Once micro wave 3 within subminuette wave i is complete then this bear wave count would expect a small fourth wave correction which may not move back into micro wave 1 price territory above 1,192.49.
When micro waves 4 and 5 complete an impulse for subminuette wave i, then the bear wave count would expect a second wave correction for subminuette wave ii which may not beyond the start of subminuette wave i above 1,200.03.
The mid term target for minute wave iii remains the same at 1,081 where it would reach 4.236 the length of minute wave i. I will not have confidence in this target until price makes a new low below 1,142.82.
So far minute wave iii has lated seven days. It may end in another six days if it totals a Fiboancci thirteen. It may do this with a swift strong fifth wave extension; sometimes impulses for Gold start more slowly than they end.
This analysis is published about 04:11 p.m. EST.
I’m looking to sell DUST between 1180.10 as per Tham (below) or 1177 as per Lara.
Friday analysis is published about 04:34 p.m. EST.
So close! No cigar.
I am working on a bullish alternate, and I think I can find a solution for the bull wave count which resolves many problems I had with that leading diagonal.
The outcome is that for this idea it requires downward movement in the short term, very likely to below 1,169.94, to complete minor wave 2.
And that right there is why I will keep reiterating that only a new low below 1,142.82 would provide a substantial level of confidence in the bear wave count. While price remains above 1,142.82 the bull wave count will remain valid and possible.
I will not quite manage to get analysis out before NY closes today (not for lack of effort, it is just taking time). So here’s my summary:
The bear wave count requires a very strong downwards move from here. A new low below 1,169.94 would provide some confidence that price is breaking out downwards, but to have a substantial level of confidence in the bear wave count a new low below 1,142.82 is required. The mid term target remains the same at 1,081, it may be met in five days or it may now need longer, maybe thirteen days. The bull wave count requires a new high above 1,200.03 for initial confidence.
Lara, thanks for the insight, enjoy the weekend.
Gold COT (no bear here) and
GDX:GLD ratio (no bear here either)
I’ve been looking at weekly $GOLD:GDXJ, looks bullish.
I really like the bullish tilt to this weeks COT. The Swat/MM positions resemble week of 3/17. Additionally, MM Net position as a % of total open interest is back to single digits, which has led to bull moves in the past, included late march of 2015, late dec of 2014, early nov 2014, late sept of 2014.
Staying long 75% JNUG.
Positive Jobs Data. Conservative win in UK. Greece outcome looking positive for Monday. May is traditionally weak for Gold. In a huge H&S formation.
Good luck MTLSD. If this pays off I will tilt my cap your way.
Thanks!
SWAP net short position dropped by 20,000 from last week. MM reduced net long position my 28,000 contracts.
No wonder we haven’t been dropping, the bullion banks are covering shorts and adding longs.
I did buy DUST, however a top trader I know who uses an very expensive custom overbought/oversold indicator with a high success rate told me today he bought and sold and bought back today a huge amount of NUGT and JNUG today in the hundreds of thousands $.
Yes the manipulators were covering but they had to cause the specs were going short. Only watching Gold ‘s COT ‘s will cost you a lot of money. We still have big divergence between Gold and Silver.In Silver there is no covering and The big 4 are still short with 50 days of world production, the big 8 still 73 days of world produciton short. the most likely scenario is we will se another rise to 1240 in Gold and maybe 18 Dollar Silver before the next drop will start.
for Gold data is to good for a big drop and for Silver to bad for a mid term rise. thats it. good luck
Tham
Now that Lara thinks subminuette wave ii is complete, as per her comment below. Is this where you buying into DUST?
It’s where you remortgage, shake the old people down for change and put it in DUST. Sit back and wait for the account to double up, sell out and buy a holiday home in X and see out your days laughing about how easy life is 🙂
o my gosh!
Dsprospering, I’ve sent you a couple of emails. Please check your in box and reply today or early tomorrow. Thanks very much!
I did buy more DUST tonight based on Lara’s bearish comments. Good luck to up both.
Did a quick scalp when market opened today. Will load more next week.
Yes Dust was a good price at the open today, almost same as the price I added more before the close today. Prosperous trading in DUST.
Hi Richard, just to add an afterthought after I had a good night’s sleep.
I was hesitant at the close on Friday. I assumed that (1) the bear count is THE count, and (2) micro 1 ended at the low of 1180,80 (and I bailed out there mainly because a quick rise followed by a quick drop does not portend good things because the action is too quick and a knee-jerk reaction appears to be in order; good to take profits and fight another day). The subsequent micro 2 second wave for the bear count looked incomplete up to the market close. It should be a 3-wave affair and I could not see the c wave yet (1181.80 – 1193.04 – 1184.37 – 1190.10?). 1190.10 looks too low for the c-wave unless micro 2 is a running flat, which has low probability. I inferred that Monday should see a rise above 1193.04 before the big drop in micro 3 starts.
On the other hand, a drop on Monday would fit the bull count well. Sub-minuette 2 of minuette 3 so far is 1193.94 – 1181.80 – 1190.10 – ? The next move would be a low below 1181.80 to avoid a truncation. In that case, the next move would be up in sub-minuette 3.
So, if I had bought some DUST on Friday, I would monitor price action closely at 1181.80. If it falls below 1178.97, the start of sub-minuette 1 of minuette 3 of the bull count, then my reading of the bull count is wrong and the bear is strongly favoured. If it turns upwards around 1180.10, I would exit.
Good luck in trading DUST. May the 8 (Chinese homonym for prosperity) be with us all. (Sorry for the humour, May 4 being booked by Star Wars as its lucky day, since it can be read “may the force”, still sticks in my mind after four days).
Tham – thanks for the warning about selling DUST. I may sell DUST between 1180.10 and 1177.
Lara – “In the very short term one final small fifth wave down to 1,177 would complete an impulse for both wave counts at the hourly chart level. Thereafter, they again diverge. The bear count then expects a fourth wave correction which may not move into first wave price territory above 1,195.49. The bull wave count expects new highs.”
Fascinating situation. 15 May puts on GLD would return 10X if gold moves from 1290 to 1080 next week. Who feels lucky?
I think you mean from 1188 to 1081 target next week.
Yes, thanks Richard.
I expect a really big move down for the bear wave count should be imminent. The bull count requires upwards movement. The short term invalidation / confirmation points are 1,200.03 and 1,169.94. I will favour the bear wave count by 60%, with the bull count the remaining 40%.
I’m leaving comments to write that up now, and my aim is to get your analysis out before NY closes today. Good luck everybody!
Lara is subminuette wave ii completed?
Yes, I think so.
And the problem I now have is that upwards movement just will not subdivide as a five, it will only work as a three.
Which does not fit the bull wave count at all well.
It means ANOTHER leading diagonal is the only structure that will fit if the trend is up. Every time I run into that problem the wave count which requires it turns out to be wrong.
So although volume is giving a bit of a warning today for the bear count, I’m going to favour the bear count now.
Something big is going to happen soon, volatility has decreased, it’s coiled like a spring ready to release.
Perhaps this is another second wave, subminuette wave 2 showing up on the daily chart?
Or maybe minuette 2 is continuing longer and its just in a smaller c wave now?
Bear wave getting a little more likely i think. The dollar may have finally bottomed out. you could call a double bottom on the 4 hour chart and count a fully formed second or fourth wave correction there.
This would make sense with the data. It wasn’t a slam dunk but makes an increase of interest rates a question of when, not if.
Still all a bit up in the air and nothing settled for sure yet so far, which is surprising to me
Speaking of the dollar, I wanted to share w/ everyone a quick picture of what I see.
Yeah that’s the double bottom i was looking at. Still, it hasn’t really confirmed a break out of its downtrend. Needs a bigger move up but that could be the beginning of it and the only big ‘tell’ i can identify a this time.
Lara : Updated bear hourly wave count so far seems to be working. Thanks for the timely update.
Cosidering today’s price action does gold have better chance in bear trend?
Wave seems extended slightly over your target. It should not matter as long as price remained below invalidation point 1200.
Thanks.
I’m looking at volume (always) and it’s slightly higher today for an up day. It’s higher than the prior two down days, but it’s still not higher than 30th April six days ago.
This is a very small concern for the bear wave count. But it’s not really enough of an increase to favour the bull wave count.
What it does is muddy the picture really.
Gold seems to be in a pattern now where it ends it’s direction towards the end of the NY session. So I’d expect that to be it for today.
The bear wave count should see a big move down… but we’re still waiting for that aren’t we.
The bull wave count must see upwards movement from here.
I’ve only just begun this morning looking in more depth at the hourly chart, but my first impression is this upwards movement subdivides best as a three. I need to check the possibility of a leading diagonal, a five, though to be confident.
Looks like we could get an extremely low volume hanging man backtest on the GDX daily today. BB width is amazingly low so brace yourself for a big move soon.
Mark F I sure hope the GDX big move will be Down.
well that’s where my money is positioned!
Really good looking setup on the DUST daily. Extremely constructive and bullish backtest/flag.
Typically NUGT will be pulled up with a big day in the stock market
even if gold is down. With gold up, it seems unusual for NUGT to only be up 3%
Not loving the action but seems typical of a wave II
SENTIMENT: Is this sideways consolidation by Gold price setting up for the next move? There is a NO TRESPASSING flag up at 1190 (50dma) and 1193 (20dma) anything further, the Gold bulls will probably walk through to the abattoir at 1197…. So far Gold price appears to be having a narrow trade range indicative for range expansion to follow….
Thanks for putting up the, NO TRESPASSING flag up at 1190 (50dma) and 1193 (20dma).
Has Subminuette wave ii completed?
Can gold go down yet or not yet finished going back up to complete Sub ii ?
Looking good. Both GOLD and GDX look to be completing II
Should be a nice gap down on Monday to kick off i of III
That’s funny you say that. I was just looking at my GDX fractal chart and was thinking a gap down Monday would follow the script perfectly. Not that I’m expecting it but the fit would be uncanny. I inserted green arrows showing where we may be today in comparison if the fractal continues to play out.
V, I would think that subminuette ii back up has already been completed? Otherwise if gold still has to move up towards 1190 to 1200 I’d rather sell DUST now and buy it cheaper when gold goes higher up?
Anyone have a wave count?
Inverse silver ETF setting up very bullishly. It’s a bit too illiquid for my tastes but the pattern speaks volumes. Just another piece of data that paints the market picture for me.
Same chart and trade setup from Rambus. Good charting. I like your style.
Truly amazed that the bear count, if in play, would be giving an entry point after market opens following data release. That’s the last thing i expected to happen today!
Yes, doesn’t the bear count need to start plunging from here, now?
I think so. Pretty much here or around here. It could wait until monday i suppose after all the position unwinding today which may keep it in a relatively tight range. We’ll have to see
Gold dropped since the open and DUST has climbed back up.
I was getting ready to sell out of DUST if it had gone back above the spike again at 1193.
I added to JDST on opening GDX/GDXJ pop. I suspect my bearish back test scenarios are in play.
Today may have been the last chance you get for a while to pick up JDST in the $7’s.
So far picture perfect, bearish backtest on the GDX hourly. Good entry location to add short.
Following this rejection at former support turned resistance, I’m looking for GDX to head down from here with no material support until it fills the gap just below $19.
This is also possible retest of breakout
If gold goes above 1200.03 I will sell DUST
Gold Modestly Up After U.S. Jobs Data that Met Market Expectations By Jim Wyckoff, Kitco News Friday May 08, 2015 08:55 –
http://www.kitco.com/news/2015-05-08/Gold-Modestly-Up-After-US-Jobs-Data-that-Met-Market-Expectations.html
Gold met Lara’s latest requirement to 1193. Now trading at 1186ish.
The bear count calls for gold to move lower from here????
Is that way everyone is reading??
Looks like it’s time to play the whipsaw song
LOL!!!!
HATE the Whipsaw Song. It’s stuck in my head.
Yes, I think gold is in another 2nd wave as Lara shows in her chart below. Should turn south soon. Gold is tracking the dollar very closely today. Dollar seems to be stabilizing at these levels.
I am expecting a Weak NFP data means weak USD and gold up..
weekly closing is important.
unless it closes below 1174.. we will get a buy signal in weekly candle
Can you clarify why you think that chart is such a sure buy ?
A VIEW: With 9EMA at 1189/90, 5dma at 1188-89 and 50dma at 1189-90 is a congestive resistive confluence for Gold price to punch through which would then likely seek 1193-4, a break above here may see acceleration to 1197-98… Basing off 1184/83 does Gold price have so much thrust in it? There are three sides to a coin, Gold price sits on its side, which way will it flip is hard to tell, oh well lol…. 🙂
GOLD HnS and a triangle. Once the dotted red triangle is broken up/down gold will define bull/bear.
Wave 5 ending at 1178.97 gold needs to fall below this today for bear count to stay alive after small bounce. Gold just finished the bounce at 1189 and hope it holds this level here.
Gold also is trading below 9ema (1189.99).
Gold and Silver long term charts from StockTradingHelp on Stocktwits
I think a lot of us are seeing things the same way. You can see Ive been watching the same thing on my charts since Feb as well.
and here on arithmetic scale the picture looks even more clear.
It looks like we shall not see a small final fifth wave down and my expanded flat for that fourth wave was wrong. The fifth wave would have been at the low of 1,178.97.
So now the bull count expects a third or C wave up, while the bear count needs only a small fourth wave which may not move above 1,192.49.
I can see another possible wave count for this downwards move which sees a five wave impulse complete at the low of 1,178.97 for the bear wave count, chart attached. If this possibility is correct then another second wave could move higher, not above 1,200.03. It may end either now at the 0.382 Fibonacci ratio, or may move higher to the 0.618 Fibonacci ratio at 1,192.
Maybe tomorrow we will finally learn which count is accurate….although if both expect up moved, my guess is we make it to about 1192 so people get to think about it all weekend again.
Well, true confirmation cant be obtained until we can view it in the rear view mirror. The best we can hope for is market behavior in the present that appears to be best following one of the two counts. There’s always the possibility that the answer is “neither” so this is really about trying to be positioned based on increased probability….as opposed to one of the counts must be right and one must be wrong. At least that’s the way I view things.
Scanning my charts tonight, looks like today’s close created a lot of backtests, including this bearish backtest on NUGT.
Here’s the backtest on the GDX hourly.
Here’s a good view of the back test on my GDX 30-min chart where I started documenting the transition from bullish to bearish internal structure in the overall bearish channel.
and speaking of backtests, the S&P seems to be in a similar situation where broken support has now morphed in resistance.
The readings I have H 1192 / L 1177.9…. Does that mean Lara’s downside target of 1177 has already been met, when did that happen, or do we get to see a dip to 1177 from CMP 1183?…. Anyhow expecting Gold price to rally to possibly be contained by 1190 or anywhere between 50/20dma 1189/94 with a break above here to possibly seek 1198-99 (for a good short! lol) with upside risk 1210-11…. Gold price remains bearish; a good downward move is also expecting. I wonder how this week will close. Hmmm…. Good luck all, and have a great weekend!
Syed, sounds bearish so I like it.
I also just got word of more bearish news on gold. Friday could be a day of decision between gold bulls and bears.
What is the bearish news? Psssss!!!
A top gold trader is NOW bearish on gold. The names is confidential. I’ll be waking up early Friday to watch everything.
Typically, a breakout to the downside of Wednesdays inside day range on Thursday has more or less indicated continuation of the downtrend…. Expecting to see Gold price flirt with 1171 today…. 🙂
I look at it from the 50,000 foot view. In every instance over the past 3+ years, you can sell resistance as shown by the weekly and monthly trend channels and always make a profit. I will continue to do this until the trend changes. It’s all about the odds to me….it wont always work but it will until it doesn’t. Buying support and selling resistance is simply a method of placing odds in your favor in the context of a well defined trend.
1177 drop hasn’t happened yet and still needs to happen for both bull and bear.
Dust is forming a HnS in 2 hour period.
DUST right shoulder may be it’s Friday low before it begins Friday ascent towards $23 in six days. May great golden fortunes rain down on me Friday and next week.
DUST didn’t truly breakout today as shown on the hourly. Like I mentioned earlier in the day, there was a gap fill near $15 that was going to pose near term resistance. Prices got to $14.90 on the gap fill before retreating.
Owning DUST and with 8:30 am Friday US non-farm payroll, I am dreading the completion of final fifth and rebound. One final small fifth wave down to 1,177, Once micro wave 3 within subminuette wave i is complete then this bear wave count would expect a small fourth wave correction which may not move back into micro wave 1 price territory above 1,192.49. When micro waves 4 and 5 complete an impulse for subminuette wave i, then the bear wave count would expect a second wave correction for subminuette wave ii which may not beyond the start of subminuette wave i above 1,200.03.
Hopefully it happens all painlessly before the market opens then drops the rest of Friday. I am dreaming.
Ha, gold will stagnate over night and wont touch 1177 as it hasn’t been able to for a while now.
The news will decide the direction of travel.
Kind of wishing I sold out today… may cost me dear tomorrow.
Yes selling at Thursday high then jump in at the peak of subminuette wave ii for the trip down.
Hopefully Dust rallies even higher Friday. Hindsight is 20/20.
Good makes you sleep better. Trades are always there in the market place and there is no reason to loos sleep during uncertainty even though traders know market direction in medium term.
Good luck next trade!!!
Agreed. I will never climb into a position that doesn’t allow me to sleep. If you think you’re in over your head and worried about what happens overnight or in reaction to morning news, you’re better off daytrading and sitting in cash overnight so you can sleep.
Thank you Lara. Looking forward to updated Gran SuperCycle on monthly chart.
You’re welcome. I’ll be doing the Grand Supercycle update separately from the regular daily update. Otherwise it would make for a ridiculously long video.