
A small range for Friday with a small red doji fits the bear Elliott wave count slightly better than the bull.
Notice: The website will be unavailable from Saturday evening to Sunday morning EST for necessary updates. Downtime expectation of only 3-4 hours, but may be longer.
Summary: The bull wave count expects the middle of a third wave up to show a strong increase in momentum. A short term target is at 1,209, and the mid / long term target for the third wave to end is still at 1,288. A new alternate hourly chart for the bull also requires upwards movement on Monday, but the final invalidation point for it is 1,169.60. A new high above 1,192.44 would be short term bullish. The bear wave count expects another five wave move down which may be a third wave or a C wave. A new low below 1,169.60 would be short term bearish, and more downwards movement to at least 1,165.76 should be expected.
To see the bigger picture and weekly charts go here.
Changes to last analysis are italicised.
Bull Wave Count
Click chart to enlarge.
The bull wave count sees primary wave 5 and so cycle wave a a complete five wave impulse on the weekly chart.
Pros:
1. The size of the upwards move labelled here intermediate wave (A) looks right for a new bull trend at the weekly chart level.
2. The downwards wave labelled intermediate wave (B) looks best as a three.
3. The small breach of the channel about cycle wave a on the weekly chart would be the first indication that cycle wave a is over and cycle wave b has begun.
Cons:
1. Within intermediate wave (3) of primary wave 5 (now off to the left of this chart), to see this as a five wave impulse requires either gross disproportion and lack of alternation between minor waves 2 and 4 or a very rare running flat which does not subdivide well. I have tried to see a solution for this movement, and no matter what variation I try it always has a major problem.
2. Intermediate wave (5) of primary wave 5 (now off to the left of the chart) has a count of seven which means either minor wave 3 or 5 looks like a three on the daily chart.
3. Expanding leading diagonals (of which intermediate wave (A) or (1) is) are are not very common (the contracting variety is more common).
4. Volume does not support this bull wave count.
For volume to clearly support the bull wave count it needs to show an increase beyond 187.34 (30th April) and preferably beyond 230.3 (9th April) for an up day. Only then would volume more clearly indicate a bullish breakout is more likely than a bearish breakout.
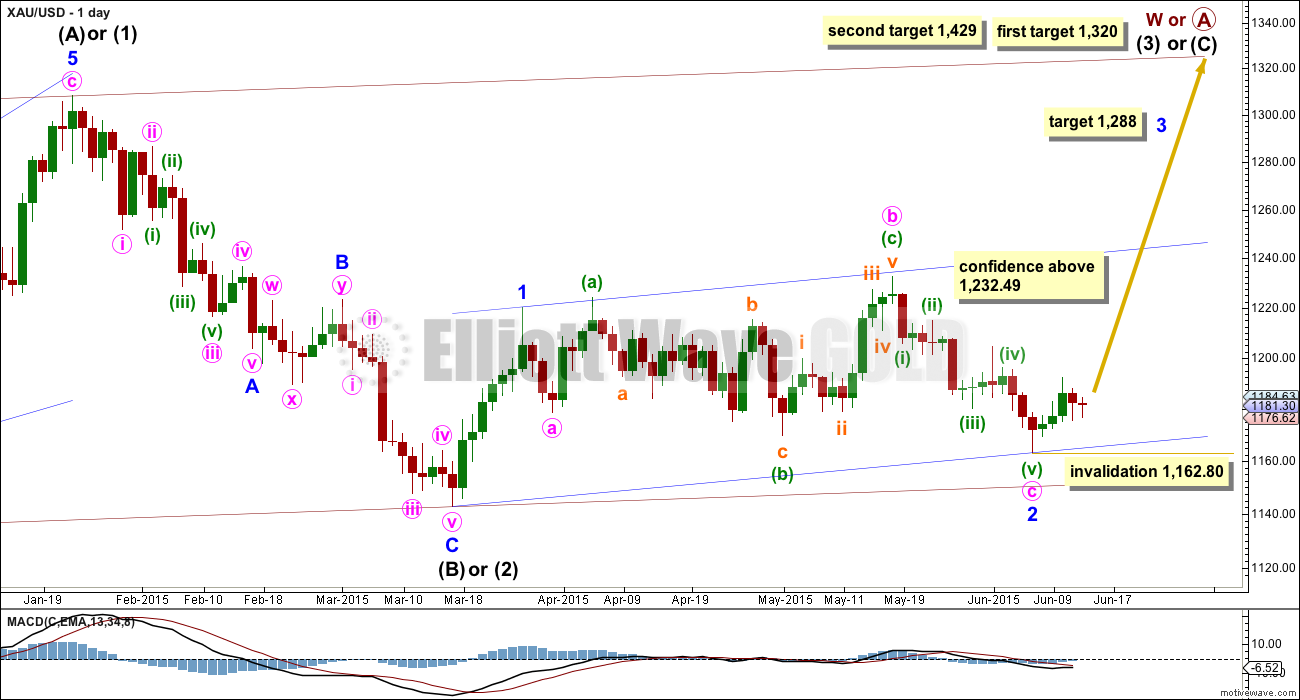
Within cycle wave b, primary wave A may be either a three or a five wave structure. So far within cycle wave b there is a 5-3 and an incomplete 5 up. This may be intermediate waves (A)-(B)-(C) for a zigzag for primary wave A, or may also be intermediate waves (1)-(2)-(3) for an impulse for primary wave A. At 1,320 intermediate wave (C) would reach equality in length with intermediate wave (A) and primary wave A would most likely be a zigzag. At 1,429 intermediate wave (3) would reach 1.618 the length of intermediate wave (1) and primary wave A would most likely be an incomplete impulse.
Intermediate wave (A) subdivides only as a five. I cannot see a solution where this movement subdivides as a three and meets all Elliott wave rules (with the sole exception of a very rare triple zigzag which does not look right). This means that intermediate wave (B) may not move beyond the start of intermediate wave (A) below 1,131.09. That is why 1,131.09 is final confirmation for the bear wave count at the daily and weekly chart level.
Intermediate wave (C) is likely to subdivide as an impulse to exhibit structural alternation with the leading diagonal of intermediate wave (A). This intermediate wave up may be intermediate wave (3) which may only subdivide as an impulse.
Minor wave 2 is over here. Minute wave c is just 2.7 longer than 1.618 the length of minute wave a. At 1,288 minor wave 3 would reach 1.618 the length of minor wave 1.
Within minor wave 3, no second wave correction may move beyond its start below 1,162.80.
A new high above 1,232.49 would eliminate the bear wave count and provide full confidence in the targets.
Main Hourly Bull Wave Count
Click chart to enlarge.
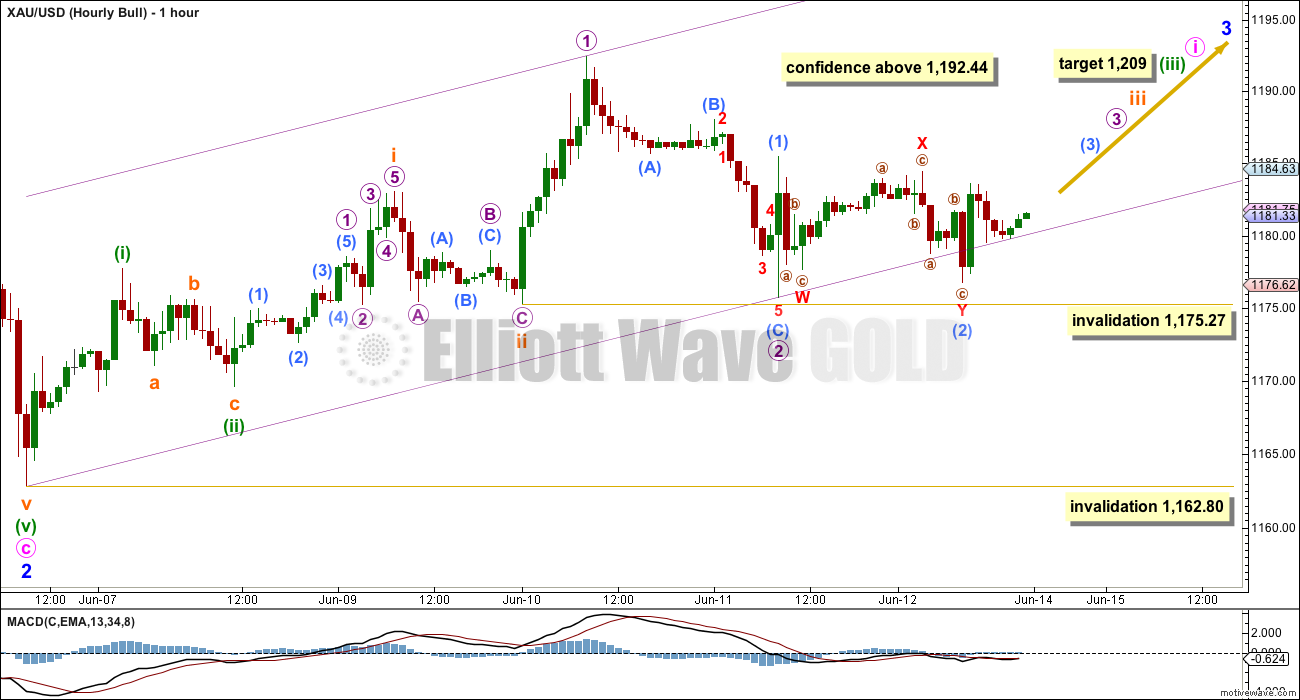
It is highly concerning today that the bull wave count cannot manage to complete a five wave structure upwards. If a third wave has begun at minor degree then within it a five wave structure up must begin.
Now there is a series of four overlapping first and second wave corrections. This wave count expects a very strong increase in upwards momentum from here as the middle of a third wave must begin, within minute wave i.
The channel drawn here is a best fit.
If micro wave 2 is continuing sideways, then it may not move beyond the start of micro wave 1 at 1,175.27.
If the first invalidation point is breached, then I would use the alternate hourly bull wave count below.
Alternate Hourly Bull Wave Count
Click chart to enlarge.
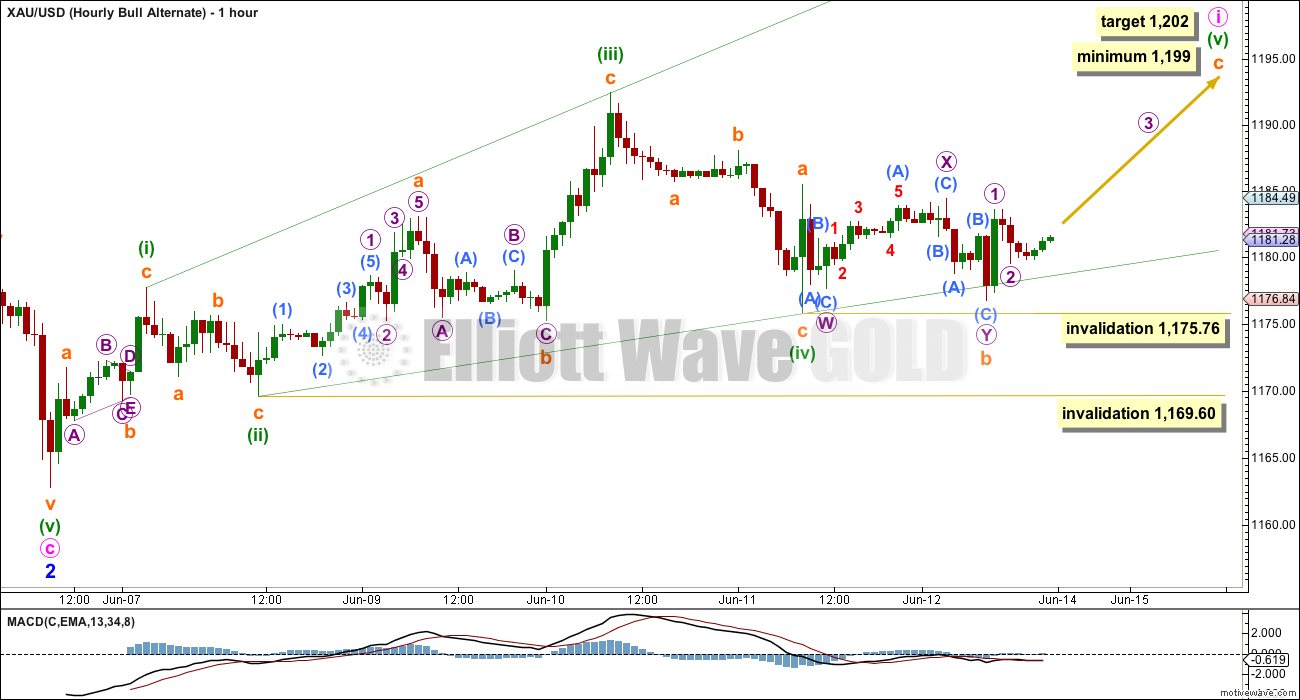
The other structural possibility for a first five up is a leading diagonal. For a leading diagonal the contracting variety is more common (leading expanding diagonals are not rare but they’re not very common either). This reduces the probability of this wave count.
The subdivisions do have a better fit here though.
Within a leading diagonal, sub waves 2 and 4 must be zigzags and sub waves 1, 3 and 5 are most commonly zigzags but may also be impulses. Here minuette wave (i) fits perfectly on the five minute chart as a zigzag and minuette wave (iii) fits on the hourly chart as a bigger zigzag. The diagonal would be expanding.
The most common depth for fourth and second wave corrections within diagonals is between 0.66 to 0.81 the prior wave. Here minuette wave (ii) is 0.54 of minuette wave (i), shallower than normal. Minuette wave iv is 0.73, within normal depth.
Because the diagonal is expanding minuette wave (v) must be longer than equality in length with minuette wave (iii) at 1,199. At 1,202 subminuette wave v would reach 2.618 the length of subminuette wave a and the minimum length would be met.
The rule for the end of a fourth wave of a diagonal is it must overlap back into first wave price territory. This one does. If it continues any lower the rule states it may not move beyond the end of the second wave below 1,169.60.
If minuette wave (iv) is over now, then within the final zigzag of minuette wave (v) subminuette wave b may not move beyond the start of subminuette wave a below 1,175.76.
Bear Wave Count
Click chart to enlarge.
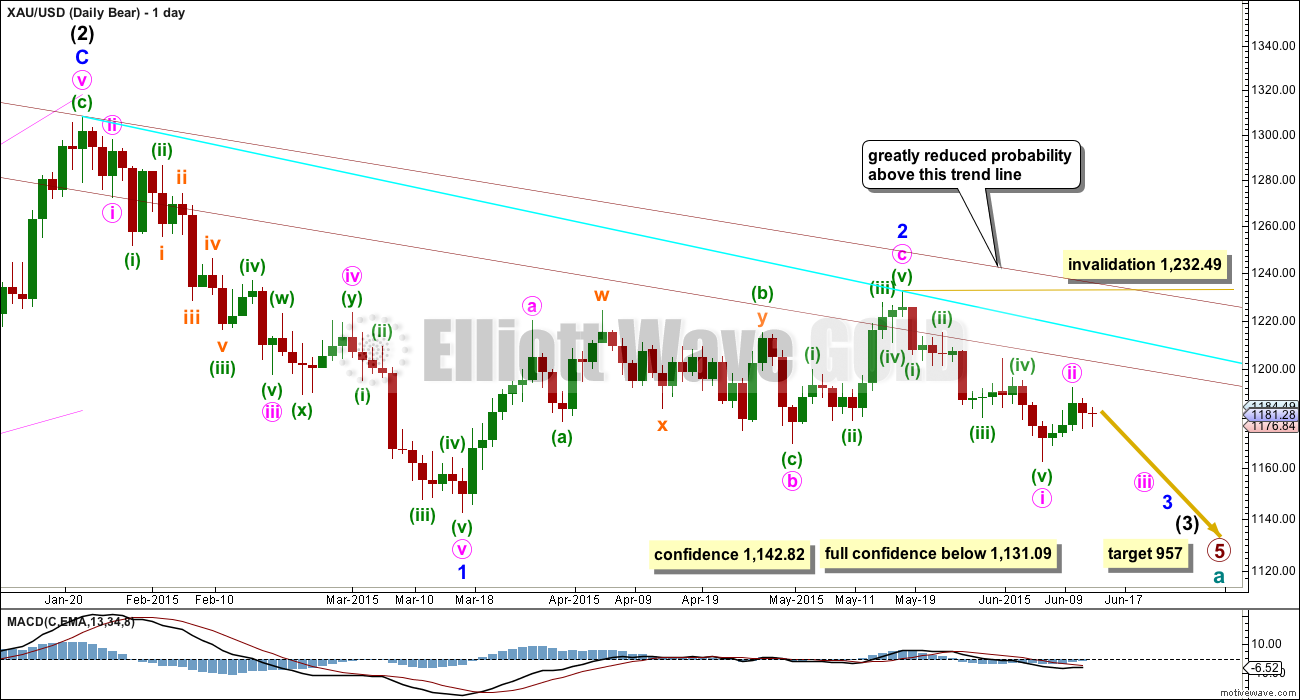
This wave count follows the bear weekly count which sees primary wave 5 within cycle wave a as incomplete. At 957 primary wave 5 would reach equality in length with primary wave 1.
Pros:
1. Intermediate wave (1) (to the left of this chart) subdivides perfectly as a five wave impulse with good Fibonacci ratios in price and time. There is perfect alternation and proportion between minor waves 2 and 4. For this piece of movement, the bear wave count has a much better fit than the bull wave count.
2. Intermediate wave (2) is a very common expanded flat correction. This sees minor wave C an ending expanding diagonal which is more common than a leading expanding diagonal.
3. Minor wave B within the expanded flat subdivides perfectly as a zigzag.
4. Volume at the weekly and daily chart continues to favour the bear wave count. Since price entered the sideways movement on 27th March it is a downwards week which has strongest volume, and it is downwards days which have strongest volume.
5. On Balance Volume on the weekly chart recently breached a trend line from back to December 2013. This is another bearish indicator.
Cons:
1. Intermediate wave (2) looks too big on the weekly chart.
2. Intermediate wave (2) has breached the channel from the weekly chart which contains cycle wave a.
3. Minor wave 2 is much longer in duration than a minor degree correction within an intermediate impulse normally is for Gold. Normally a minor degree second wave within a third wave should last only about 20 days maximum. This one is 44 days long.
4. Within minor wave 1 down, there is gross disproportion between minute waves iv and ii: minute wave iv is more than 13 times the duration of minute wave i, giving this downwards wave a three wave look.
Minor waves 1 and 2 are complete. Minute wave i within minor wave 3 may be incomplete on the hourly chart.
Minute wave ii may not move beyond the start of minute wave i above 1,232.49.
A new low below 1,142.82 would provide a lot of confidence in this bear wave count. At that stage, the bull wave count may not be continuing its second wave correction. But only a new low below 1,131.09 would invalidate any variation of a bull wave count and provide full and final confirmation for a bear wave count.
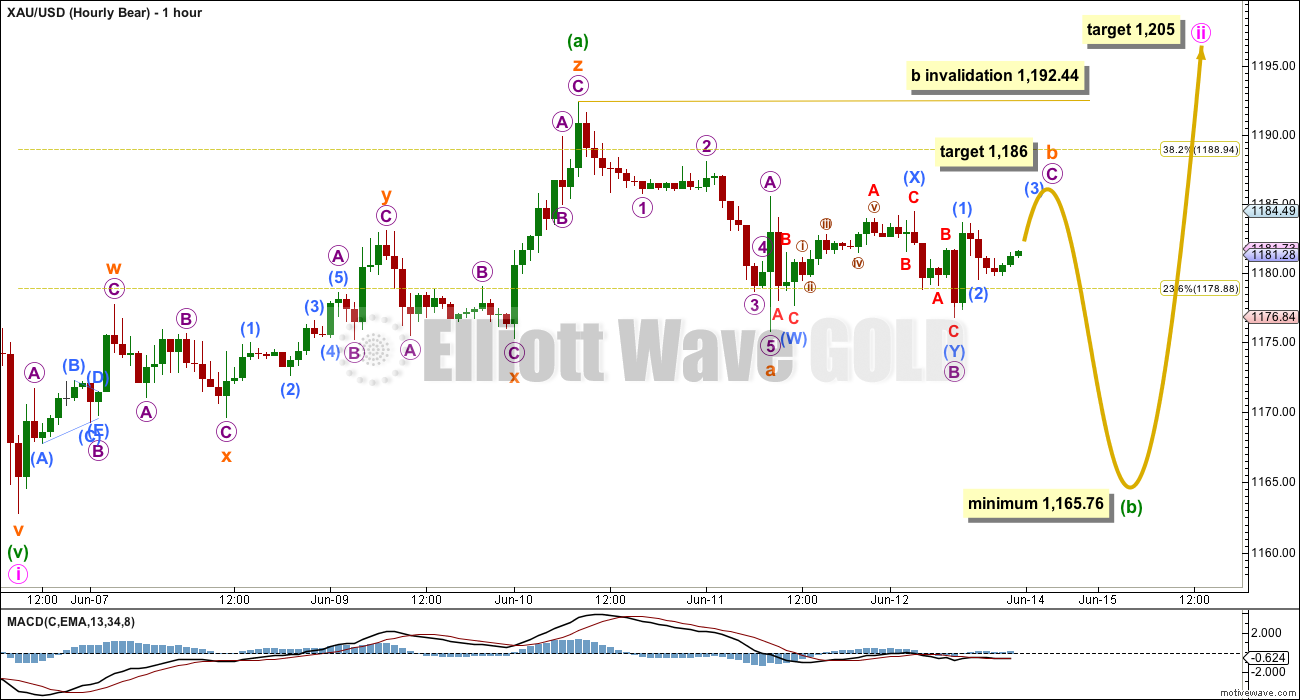
Main Hourly Bear Wave Count
Click chart to enlarge.
Because of the small inside day for Friday and the amount of time taken with this sideways movement, it looks more likely to be a B wave than a second wave correction. I am swapping over the main and alternate bear hourly wave counts for this reason today. I would consider this main hourly bear count to be about 55% likely, and the alternate below the remaining 45% likely.
Minute wave ii may be an incomplete flat correction. When an A wave subdivides as a “three” (a general term for a corrective structure) rather than a five then the correction must be a flat. Minute wave ii may not be continuing sideways as a combination because multiples may not exist within multiples.
If minute wave ii is continuing sideways as a flat correction, then within it minuette wave (b) must be a corrective structure and must retrace a minimum 90% of minuette wave (a) at 1,165.76. Minuette wave (b) may make a new low below the start of minuette wave (a) at 1,162.80. There is no maximum downwards limit for a B wave within a flat correction, but there is a convention that expects it is unlikely to be more than twice the length of the A wave. This limit would be at 1,133. The maximum common length of a B wave within a flat correction is 138% of the A wave, which would be at 1,152.
Because an A-B-C of a zigzag subdivides 5-3-5, it unfolds exactly the same as the start of an impulse. The next move down for the bear wave count may be subminuette wave c of a zigzag, or it may be a third wave as per the alternate below. If the next five down is about even in length with subminuette wave a at 17 and does not show a very strong increase in downwards momentum, then it may be a C wave. But if it is much longer than 17 and shows a strong increase in downwards momentum, then it would more likely be a third wave as per the alternate bear hourly count below.
At 1,186 micro wave C would reach equality in length with micro wave A. Subminuette wave b may not move beyond the start of subminuette wave a above 1,192.44.
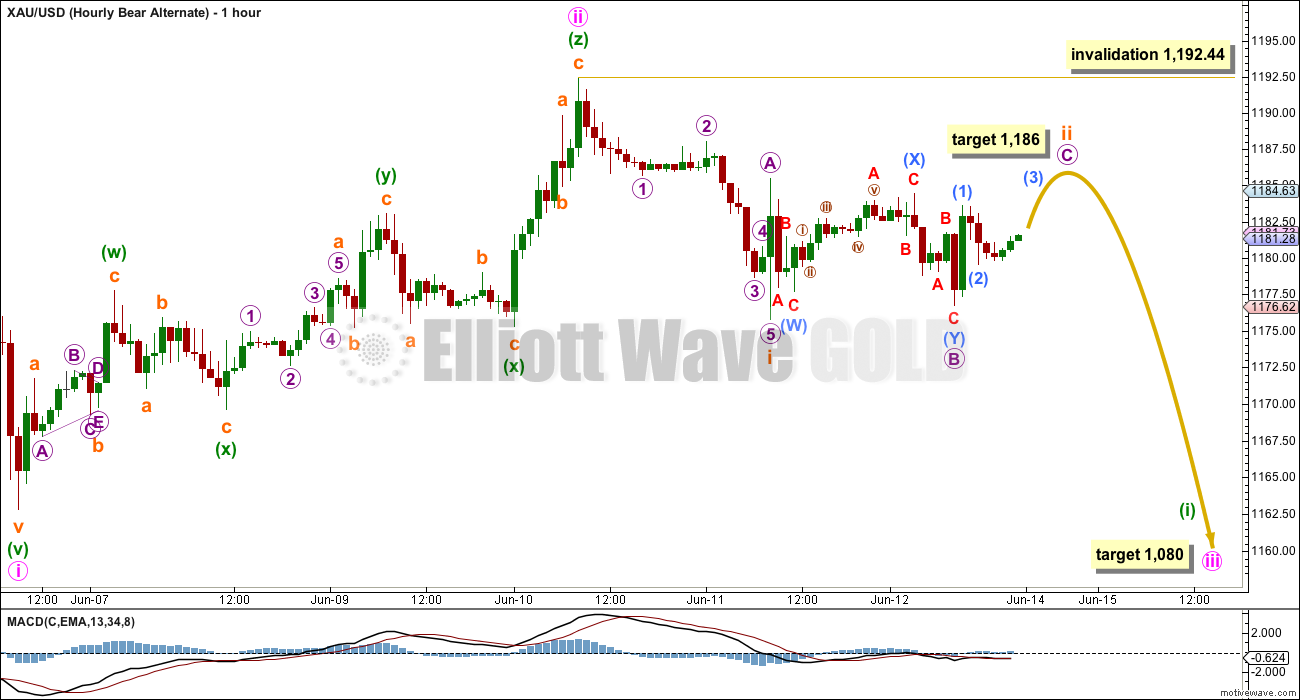
Alternate Hourly Bear Wave Count
Click chart to enlarge.
This alternate expects that a third wave for minute wave iii is beginning within a third wave at minor and intermediate degree. The next move down should be very strong indeed, if this wave count is correct.
Subminuette wave ii is incomplete. At 1,186 micro wave C would reach equality in length with micro wave A.
At 1,080 minute wave iii would reach 1.618 the length of minute wave i.
Subminuette wave ii may not move beyond the start of subminuette wave i above 1,192.44.
Technical Analysis
Click chart to enlarge.
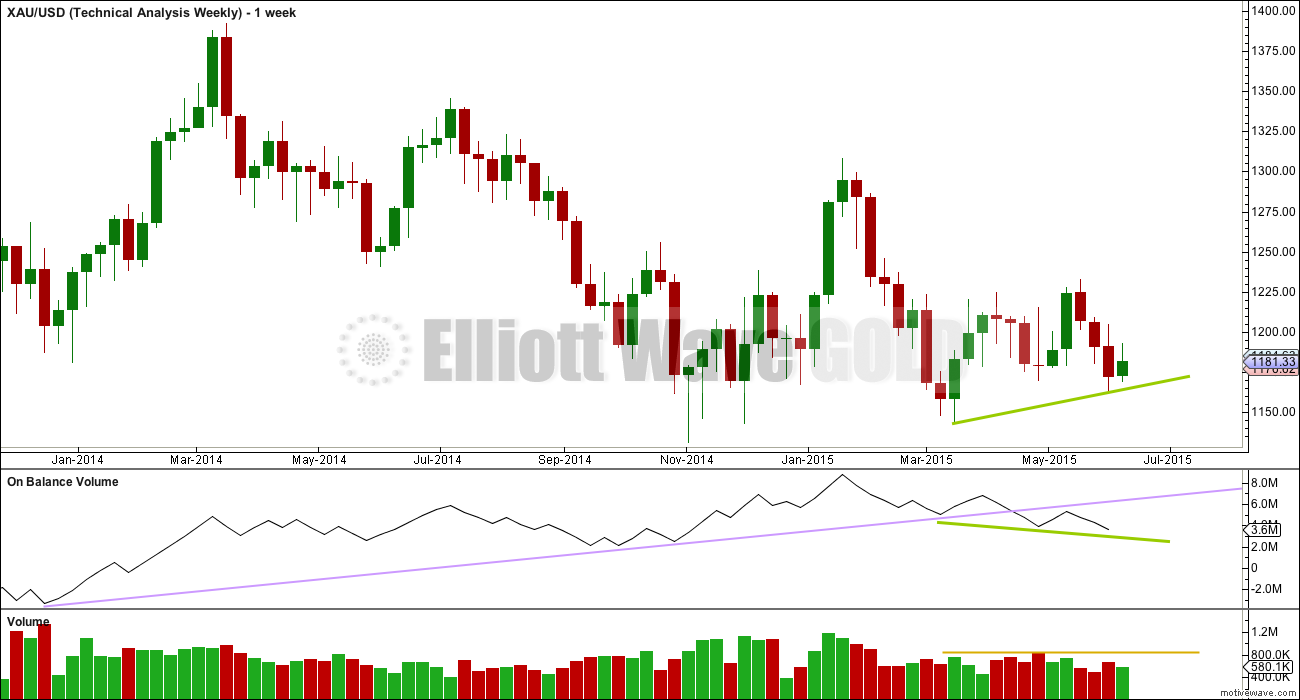
Weekly Chart: Overall volume still favours a downwards breakout eventually. During this sideways movement, it is still down days and a down week which have higher volume. On Balance Volume breaches a trend line (lilac line) which began in December 2013, and the breach is significant.
While price has made higher lows On Balance Volume has made lower lows (green trend lines). This small rise in price is not supported by volume, and it is suspicious.
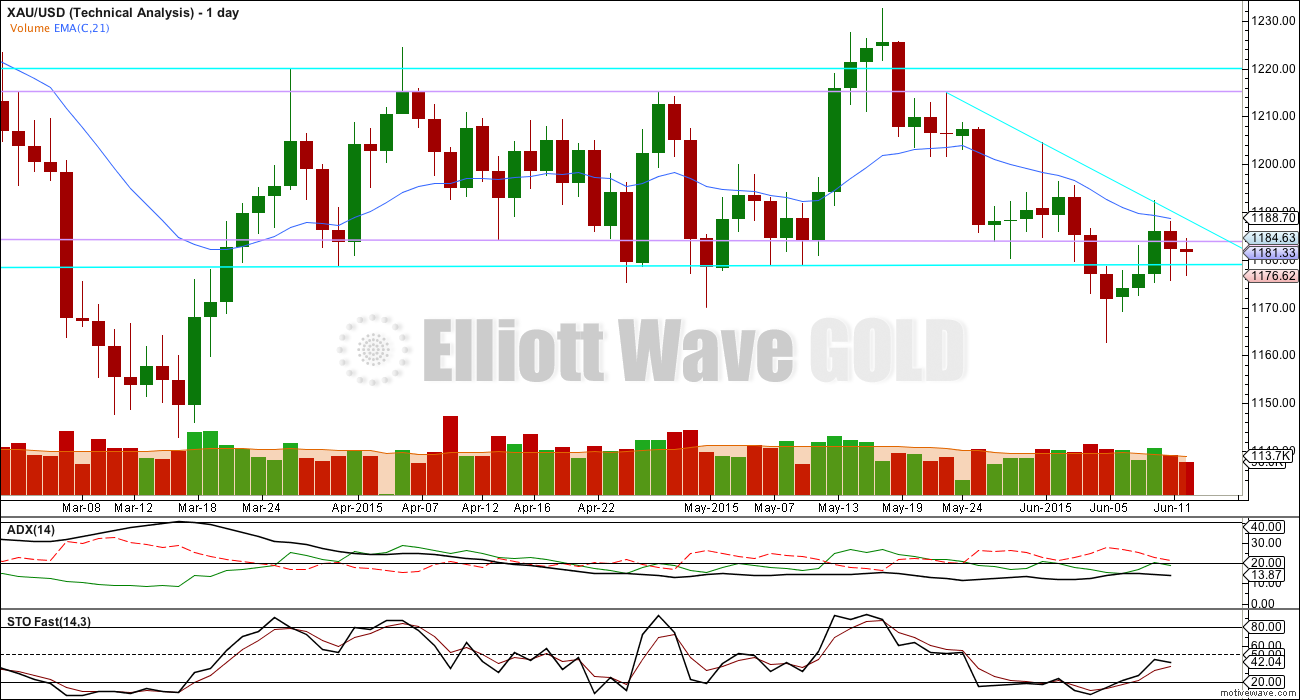
Click chart to enlarge.
Daily Chart: During the sideways range that Gold entered back on 27th March it is downwards days for 9th April, 29th April and 30th April which have the highest volume. This may be some indication that eventually when the breakout comes it may be more likely down than up. This does not always work, but it works often enough for it to be a tendency to look out for. It is a bearish indicator, but it is not definitive.
At 13.87 ADX is still below 15. ADX is still indicating no clear trend is yet evident. A range bound trading system is still better than a trend following system for this market.
This approach now would expect an upwards swing to continue from here because Stochastics is returning from oversold and price is moving up from support. However, the downwards sloping aqua blue trend line is providing strong resistance. With the weight of bearish volume indicators, it is possible that a bearish breakout from this range could be coming very soon. If traders are expecting price to make another upwards swing from here, then extreme caution is still advised. It may be wise to wait to see if that downwards sloping aqua blue trend line can be breached before any confidence can be had that the next upwards swing is indeed underway.
This analysis is published about 06:22 p.m. EST.
I can produce an hourly wave count for the daily bull wave count…. but it looks all wrong. It looks so wrong I don’t have confidence in it. Normally… I wouldn’t publish it. But this is the only solution I can see for the hourly chart.
This is a real problem for the bull wave count today.
This does not mean a reasonable wave count for the bull does not exist at the hourly chart level, it just means that so far I can’t figure it out. And I have tried. Will keep at it.
Lara, you’ve been working hard on these evasive gold counts for quite some time plus dealing with problems of website upgrades. Don’t burn out, take time for ocean air. Got to keep your inner Jedi happy!
Thanks Davey! The ocean has been flat or messy here, I haven’t surfed for weeks now, and when that happens I do get a bit down. Need to surf soon!
Lara, any kitesurfing where you are? Or not as much fun for you?
I saw some kitesurfers this month in a lake in my area and they were going forever in all directions at a high speed, amazing.
https://en.wikipedia.org/wiki/Kitesurfing
It’s not something that’s ever interested me. I’ve been a surfer for a long time. I have a 9’6″ longboard I’m learning to cross step on, and that’s not the kind of thing you do on a kite surfing board I think.
I’m just so hooked on my longboard 🙂 Cesar designed the artwork, it’s amazing, I love it (you can see it on the “about” page).
Lara, congrats on improvements to website. A comment / suggestion for forum.
When scanning thru the forum to see the latest replies to a previous comment it’s kinda difficult to visually identify the replies.
Possibly you could have more indent on a reply following a comment? Make it easier to differentiate between comment and reply. Possibly removing some white / open space currently between comment and reply might help.
Maybe other forum members might comment on this issue as I don’t want to suggest a change detrimental to others.
it’s on the list
Whichever wave count is in play (alternative hourly bull I think), the weekly H 1191.80 / L 1168.50 has not yet been taken out yet…. Upside appears to be curtailing now at 1188-90 (under 20dma) with 1191-92 on the outside… Downside appears to be a tough ask to have to take out 1177, 1174-73 all over again with 1162-61 holding…. Hard to say what Gold price is up to lol…Maybe some sideways drift before a drop kicks in?
Lara,
Is the main hourly bear in play and still in it’s 5 waves up? How long might it take to compete the 5 waves and at about what target and still below 1192.44? Then the approximate retrace lower target? Then still up to 1,205 before a deeper retrace? Thanks.
Yes, the main hourly bear count is the best fit.
I think the reason for the whipsawing today was a very rare expanding triangle. The subdivisions fit perfectly, it has a pretty good look.
If the triangle was subminuette wave b then it’s over now; the last wave up was the final E wave of the triangle and so should subdivide as a three.
It’s also possible though that the expanding triangle was micro wave B within subminuette wave b; if that’s the case then a final fifth wave up should complete subminuette wave b.
Because subminuette wave a may be seen as either a three or a five I have to remove the invalidation point at 1,192.44 for subminuette wave b. It may make a slight new high above that point and still be a B wave.
For the bigger picture for the bear we still absolutely must reach down to a minimum at 1,165.76 before minuette wave (b) is complete. It must be 90% of minuette wave (a) because (a) is a three and will not subdivide as a five.
What we are seeing is a B wave within a B wave. It’s a low degree. If members are trying to trade B waves…. at a low degree within a range bound market…. I just don’t know if there are any clearer warnings I can give that I have not already given. I wouldn’t touch this with a barge pole.
My analysis indicates that, as most of you folks say, the Bear is in play. Subminuette B looks to be an expanded flat. In Lara’s chart, micro b may need to be revised to today’s low of 1172.85. Micro c will be a 5-wave impulse. I can only count three waves completed at the moment at the high of 1190.54. I am waiting for the fifth wave to complete before shorting. Price cannot move higher than 1192.44, the beginning of Minuette B. It would then ought to drop below 1165.75 (to complete Minuette B) before going up towards 1205. So there are two short-term possible trades.
Good analysis and strategy. Thanks a lot Tham.
Consider micro wave B as an expanding triangle. The subdivisions are perfect.
On http://www.pmbull.com gold looks like at 11:44 am 1190.54 peak it hit the top of the trend line for all time frames from 1 hour down to 1 minute, I’d take that as a sell signal then wait for another low and Lara or Tham comment on next lower retrace target.
GDX open 18.51, high 18.83, low 18.42, last 18.63 at 1:01 EST High volatility day.
Greece back in the spotlight and of course the fed speech on Wednesday. Volatile week.
http://www.cnbc.com/id/102758264
Looks like gold maybe in Hourly bear with target $1,205?
or Did Gold just hit a 5 wave peak at 1190.54 at 11:44 am?
Gold got stronger and US stocks dropped and US dollar up slightly since 9:15 am news EST US manufacturing is in a recession.
Any wave counts?
Correction: US dollar down slightly since 9:15 am negative news that US manufacturing in depression and also New York 8:30 am
June Empire State index well below forecast of 5.7
Main hourly bear looks to be in play. Target of 1205. When would be the first retrace point on the way up?
I thought that gold needs to retrace a minimum of 90% before moving up to 1205? It’s a hard rule in this case. If gold doesn’t go down from here, the wavecount will need to be reworked. It’s going to be a very volatile week.
Yes. It does need to reach 1,165.76 minimum.
Don’t know what to make of today’s movement, except to assume it is some nasty B wave that is going to buck in every which direction. Gold can’t go any higher, if Lara’s bear counts are to remain valid. Only the main bear is really in play right now.
Bought back some gold longs this morning – JNUG at 20.62, and NUGT at 9.50.
Why? What is your reasoning that miners are going higher? Certainly not saying you a wrong, with these erratic gold moves what gives you confidence in a move up?
The GDX bounce off of 18.46 area is what got me interested.
In combination with last Friday’s COT, over sold on 30/60 minute.
One other reason I went long – I sold last week a portion of my position at about 8% higher, bought some of it back today, and I’m looking out to Friday Opex, where the gdx sweet spot is a ways north of here.
We have now moved below 1173, so both bull hourly counts are invalid and the bull daily is at risk if we drop below 1162.80. Both bear hourly counts are in play.
I agree to your evaluation. Just to add on.
A drop to slightly less than 1165 would favour the Bear count. If it doesn’t, then the Alternate Bear is more likely.
If I interpret Lara’s evaluation correctly, then the Alternate Bull will be invalidated below 1169.60.
I thought both bear counts expect downward movement to 1165 or below?
Only one of the bear counts is really in play anymore.
Sorry, I misread.
Matt, you are absolutely correct. Thanks for pointing it out. I saw the wrong figures from my table. I was looking at two degrees lower. The alternate bear expects a very strong move down.
Alternate Bull has second invalidation price 1169.6????
Now the going gets tough for the gold-bears – Rambus June 14, 2015
Great detailed gold article and charts.
http://www.gunner24.com/newsletter/nl-061415/
Your link is a good read, but it’s not from Rambus. Latest Rambus public post is
Weekend Report…Part 1…The End is Nigh ?
http://rambus1.com/?p=39013
He’s bearish on gold miners.
Thanks for the post. Gunner24 validates my post comment on COT below. Comm have reduced shrts by 60000 contrcts over last three weeks. Plus I agree seasonal is in play. June low is here and jul Aug high is coming then Summer low.
Looks like Hourly Bear counts are playing out with high around 1186 and turned back down to 1180 already.
I agree but what is next after the low of 1170-1165?? Deep correction up!!!
Papudi. Not necessary. A sizeable bounce can happen should the Bear be in play, possibly up to about 1200 (depends on where it bottoms). But if it is the Alternate Bear, then the rise is not really much. It cannot exceed 1186.22, the last high. In fact, it would keep on falling within a strong third wave after a small bounce. (I will have a first target 1150-1160, subminuette 3).
By the way, the bull is at risk of getting slaughtered. See my discourse with Dreamer above.
$HUI seems to be weaker than both GDX and GDXJ. Last week, $HUI started to break below support. Will GDX and GDXJ follow $HUI to the downside?
GDX – no breakdown yet
Lara, new look is great! One suggestion – would be nice if new comment entry was at the top of existing comments instead of at the bottom. Will just be a bit easier, especially when we have a big comments day and there could be 100-200 comments to scroll below for new comment entry.
will do, and good point
A VIEW: The weekly H 1191.80 / L 1168.50 is an inside week to previous week H 1204.70 / L 1162.10…. Will Gold price break above or below either of the weekly H/L?…. On Friday Gold price had an inside day to Thursday (which itself was an inside day) and also had a narrow trade range…. It appears Gold price has been winding up and traders should really be best prepared for a strong impulse move (possibly large) which can go in either direction…. Even if some upturn is seen, the moving averages are short and I would continue to favor the downside as long as Gold price is below 100dma/200dma (1204-1210) on closing basis.
WOW!!! Bravo!!!!!! This is a new facelift. Congratulation. Looks great and easy to read.
Edit: All the features including Edit is here back again!!!
Yes, it should be much more user friendly than the last comments system.
If any members notice any problems with the new look site, or have any suggestions for further improvement, please let us know.
The real time comments feature is set to update once every 60 seconds. If charts appear as a link they should appear as a chart within the comments if you refresh the page.
Thanks Lara. Nice improvement. Love the font type too. Nice look to site. One question, will the older archives be available to members or have you a cut-off for older analysis?
No cutoff for older analysis that I am aware of.
Check right side of website.
Archives: 2013 – 2015
no cutoff, and check out the new archives calendar. it used to be a list.
can you please show the time elapsed for the comments i.e posted an hour ago etc as its much easier than trying to figure out local time.
I like the time rather than elapsed time. However there can be a selection for Time zone for each member;s time zone in a member profile.
The new look is appealing. I only have one gripe. I need to scroll all the way half-way down the page in order to log in. If there are others who feel the same, then I would request that the log in be near the top of the page. If not, then it is not a big issue. I’ll get used to it. Thanks.
That’s the new iPad/tablet layout. The PC layout still has all of the items below the comments on the right like it as always been. I use both. It is nice that the posts are bigger and easier to read with the right column moved to the bottom. I think we just need to get used to it.
Mine is the same for iPad and PC versions. Probably due to using Google Chrome. I’ll try to use another platform to see if there are two columns instead of one long page.
COT for 6/12——- Comm short : 300870 -16640, Spec longs: 186795 -9840——— Ever since COT data is improving gold has turned up. 6/ 12 data is more bullish for an up days in few sessions. Since bottom commercial shorts have reduced by 62000 from 362000 to 300870.
Rambus sees breakdown coming in miners. Link