
A channel breach on the hourly bull Elliott wave count indicated a small correction may have arrived.
Summary: Friday should see a little upwards movement most likely to end about 1,188. Thereafter, another five down should begin. If it makes a new low below 1,162.80, then the bear wave count would be strongly favoured. Warning: the bear wave count sees a small second wave correction ending, which is close to the middle of a big third wave, and it is possible it could end quickly and be followed by a very strong move down.
To see the bigger picture and weekly charts go here.
Changes to last analysis are italicised.
Bull Wave Count
Click chart to enlarge.
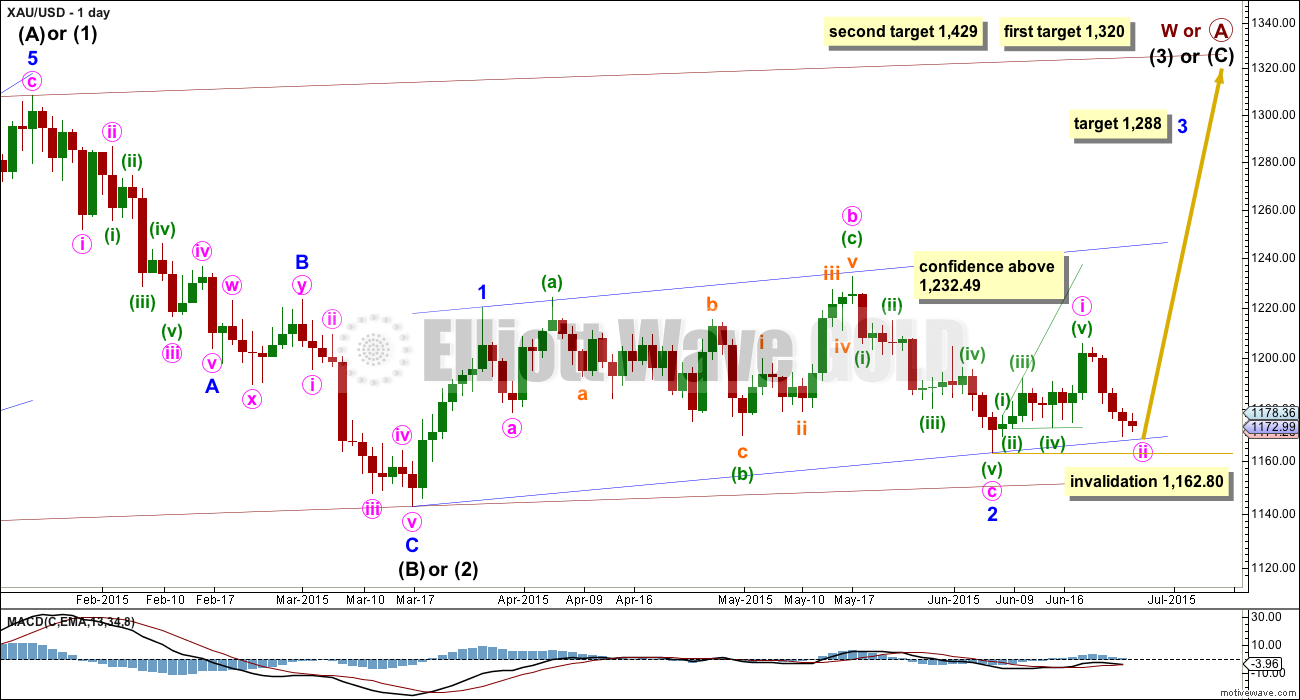
The bull wave count sees primary wave 5 and so cycle wave a a complete five wave impulse on the weekly chart.
Pros:
1. The size of the upwards move labelled here intermediate wave (A) looks right for a new bull trend at the weekly chart level.
2. The downwards wave labelled intermediate wave (B) looks best as a three.
3. The small breach of the channel about cycle wave a on the weekly chart would be the first indication that cycle wave a is over and cycle wave b has begun.
Cons:
1. Within intermediate wave (3) of primary wave 5 (now off to the left of this chart), to see this as a five wave impulse requires either gross disproportion and lack of alternation between minor waves 2 and 4 or a very rare running flat which does not subdivide well. I have tried to see a solution for this movement, and no matter what variation I try it always has a major problem.
2. Intermediate wave (5) of primary wave 5 (now off to the left of the chart) has a count of seven which means either minor wave 3 or 5 looks like a three on the daily chart.
3. Expanding leading diagonals (of which intermediate wave (A) or (1) is) are are not very common (the contracting variety is more common).
4. Volume does not support this bull wave count.
For volume to clearly support the bull wave count it needs to show an increase beyond 187.34 (30th April) and preferably beyond 230.3 (9th April) for an up day. Only then would volume more clearly indicate a bullish breakout is more likely than a bearish breakout.
Within cycle wave b, primary wave A may be either a three or a five wave structure. So far within cycle wave b there is a 5-3 and an incomplete 5 up. This may be intermediate waves (A)-(B)-(C) for a zigzag for primary wave A, or may also be intermediate waves (1)-(2)-(3) for an impulse for primary wave A. At 1,320 intermediate wave (C) would reach equality in length with intermediate wave (A) and primary wave A would most likely be a zigzag. At 1,429 intermediate wave (3) would reach 1.618 the length of intermediate wave (1) and primary wave A would most likely be an incomplete impulse.
Intermediate wave (A) subdivides only as a five. I cannot see a solution where this movement subdivides as a three and meets all Elliott wave rules (with the sole exception of a very rare triple zigzag which does not look right). This means that intermediate wave (B) may not move beyond the start of intermediate wave (A) below 1,131.09. That is why 1,131.09 is final confirmation for the bear wave count at the daily and weekly chart level.
Intermediate wave (C) is likely to subdivide as an impulse to exhibit structural alternation with the leading diagonal of intermediate wave (A). This intermediate wave up may be intermediate wave (3) which may only subdivide as an impulse.
Minor wave 2 is over here. Minute wave c is just 2.7 longer than 1.618 the length of minute wave a. At 1,288 minor wave 3 would reach 1.618 the length of minor wave 1.
Within minor wave 3, no second wave correction may move beyond its start below 1,162.80.
A new high above 1,232.49 would eliminate the bear wave count and provide full confidence in the targets.
Hourly Bull Wave Count
Click chart to enlarge.
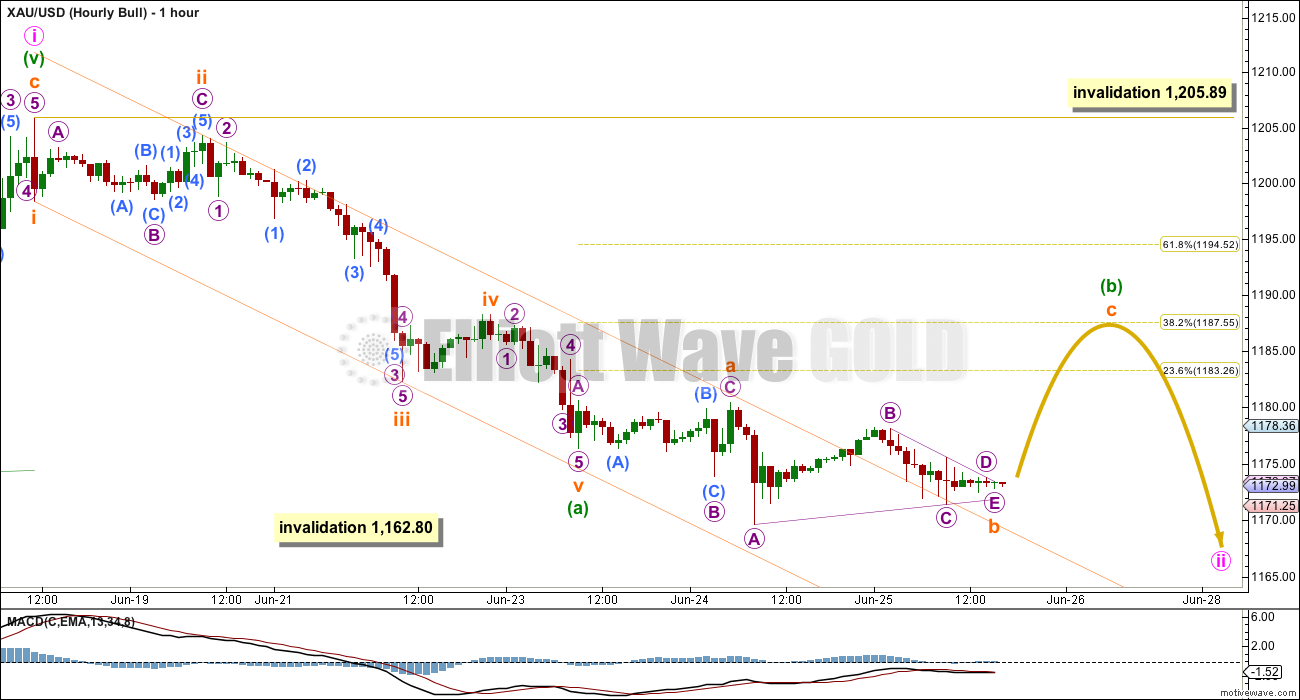
Again, as yesterday, both of the ideas presented on the hourly charts work in the same way for bull and bear wave counts. Today this first idea has a higher probability because the second idea includes a truncation which reduces its probability.
An impulse may have ended at 1,176, labelled minuette wave (a). A correction may have begun there, unfolding as a flat.
Subminuette wave a subdivides as a three. Subminuette wave b may be an almost complete triangle. When it is done, then subminuette wave c upwards may end about the 0.382 Fibonacci ratio of minuette wave (a) about 1,188. Subminuette wave c is extremely likely to make at least a slight new high above the end of subminuette wave a at 1,180.42 to avoid a truncation and a very rare running flat.
Minuette wave (b) may not move beyond the start of minuette wave (a) above 1,205.89.
Bear Wave Count
Click chart to enlarge.
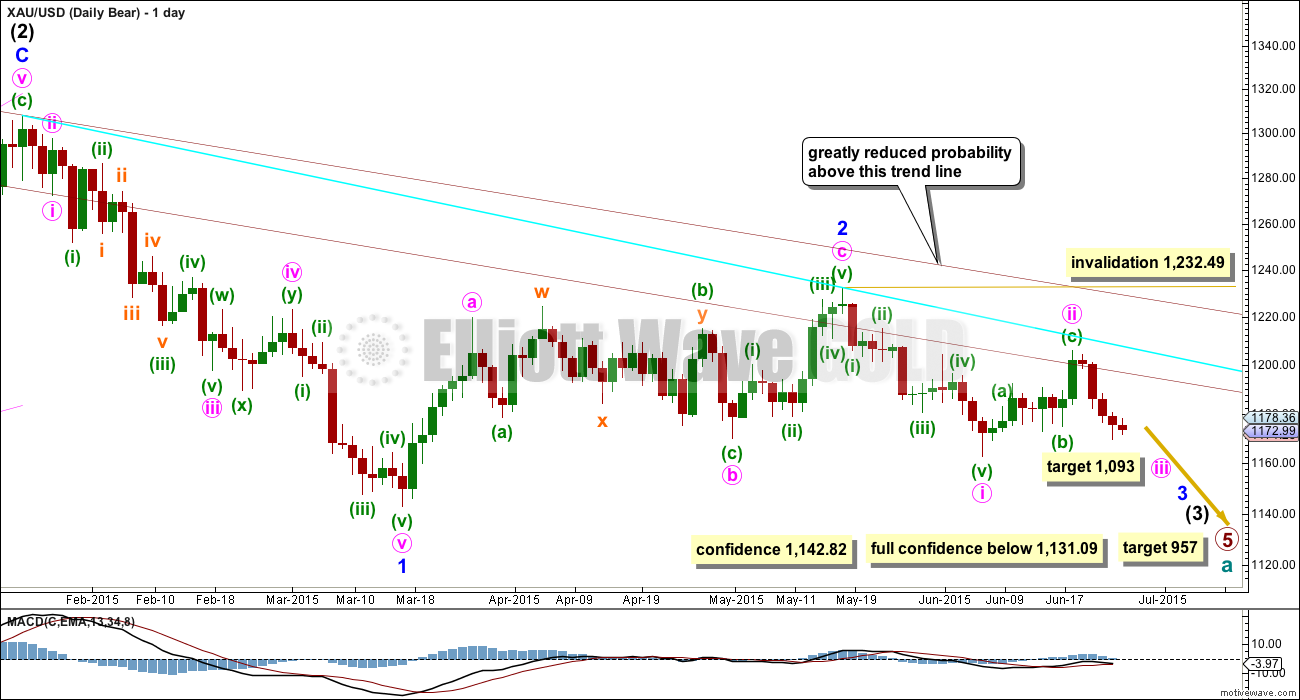
This wave count follows the bear weekly count which sees primary wave 5 within cycle wave a as incomplete. At 957 primary wave 5 would reach equality in length with primary wave 1.
Pros:
1. Intermediate wave (1) (to the left of this chart) subdivides perfectly as a five wave impulse with good Fibonacci ratios in price and time. There is perfect alternation and proportion between minor waves 2 and 4. For this piece of movement, the bear wave count has a much better fit than the bull wave count.
2. Intermediate wave (2) is a very common expanded flat correction. This sees minor wave C an ending expanding diagonal which is more common than a leading expanding diagonal.
3. Minor wave B within the expanded flat subdivides perfectly as a zigzag.
4. Volume at the weekly and daily chart continues to favour the bear wave count. Since price entered the sideways movement on 27th March it is a downwards week which has strongest volume, and it is downwards days which have strongest volume, five of them.
5. On Balance Volume on the weekly chart recently breached a trend line from back to December 2013. This is another bearish indicator.
Cons:
1. Intermediate wave (2) looks too big on the weekly chart.
2. Intermediate wave (2) has breached the channel from the weekly chart which contains cycle wave a.
3. Minor wave 2 is much longer in duration than a minor degree correction within an intermediate impulse normally is for Gold. Normally a minor degree second wave within a third wave should last only about 20 days maximum. This one is 44 days long.
4. Within minor wave 1 down, there is gross disproportion between minute waves iv and ii: minute wave iv is more than 13 times the duration of minute wave i, giving this downwards wave a three wave look.
Minor waves 1 and 2 are complete. Minute wave i within minor wave 3 may be incomplete on the hourly chart.
Minute wave ii may not move beyond the start of minute wave i above 1,232.49.
At this stage, a new low below 1,162.80 would provide a lot of confidence in the bear wave count. Further confidence would come with a new low below 1,142.82 and final confidence would come only with a new low below 1,131.09.
Minute wave ii is now very likely to be over here. If it moves any higher, then it should find strong resistance at the blue trend line.
Hourly Bear Wave Count
Click chart to enlarge.
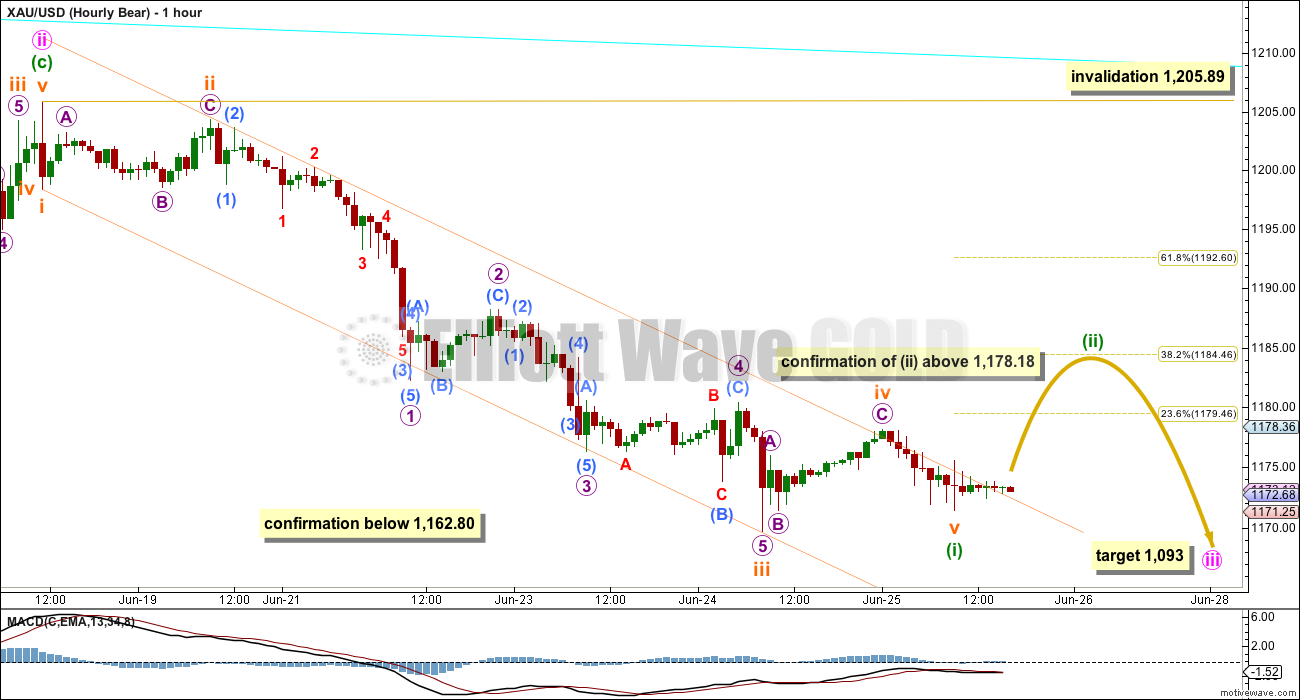
Again this second idea works in exactly the same way for both bull and bear wave counts, because A-B-C of a zigzag and 1-2-3 of an impulse subdivide in exactly the same way.
It is possible that the downwards impulse ended at Thursday’s low with a truncated fifth wave. The truncation reduces the probability of this wave count.
However, while price remains below 1,178.18, it may also be possible that subminuette wave v is not over and will move lower, and may resolve the problem of a truncation. A new high above 1,178.18 would indicate for both hourly chart ideas that the correction is completing upwards.
I am labelling subminuette wave v over here because the channel about minuette wave (i) is now slightly breached, and the sideways movement which breached the channel does not look like part of subminuette wave v.
Minuette wave (ii) may end only about the 0.382 Fibonacci ratio of minuette wave (i). There should be a strong downwards pull exerted from the middle of intermediate wave (3), at this stage, forcing second wave corrections to be brief and shallow.
Minuette wave (ii) may not move beyond the start of mineutte wave (i) above 1,205.89.
Technical Analysis
Click chart to enlarge.
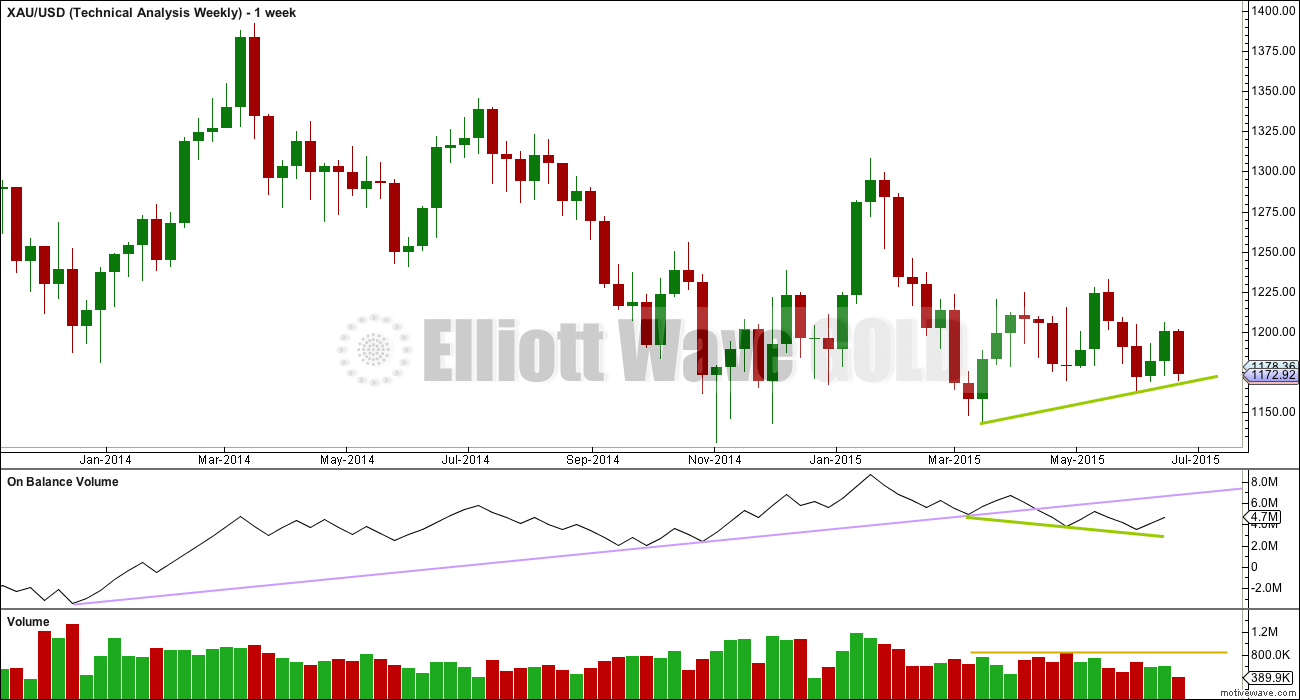
Weekly Chart: Overall volume still favours a downwards breakout eventually. During this sideways movement, it is still down days and a down week which have higher volume. On Balance Volume breaches a trend line (lilac line) which began in December 2013, and the breach is significant.
While price has made higher lows, On Balance Volume has made lower lows (green trend lines). This small rise in price is not supported by volume, and it is suspicious.
At the weekly chart level, volume consistently favours a bearish breakout: over the last three weeks, the two up weeks have lower volume than the prior down week; and, this pattern was also seen for prior moves within this sideways range, with the four down weeks from 29th March to 26th April stronger than the following two up weeks.
Click chart to enlarge.
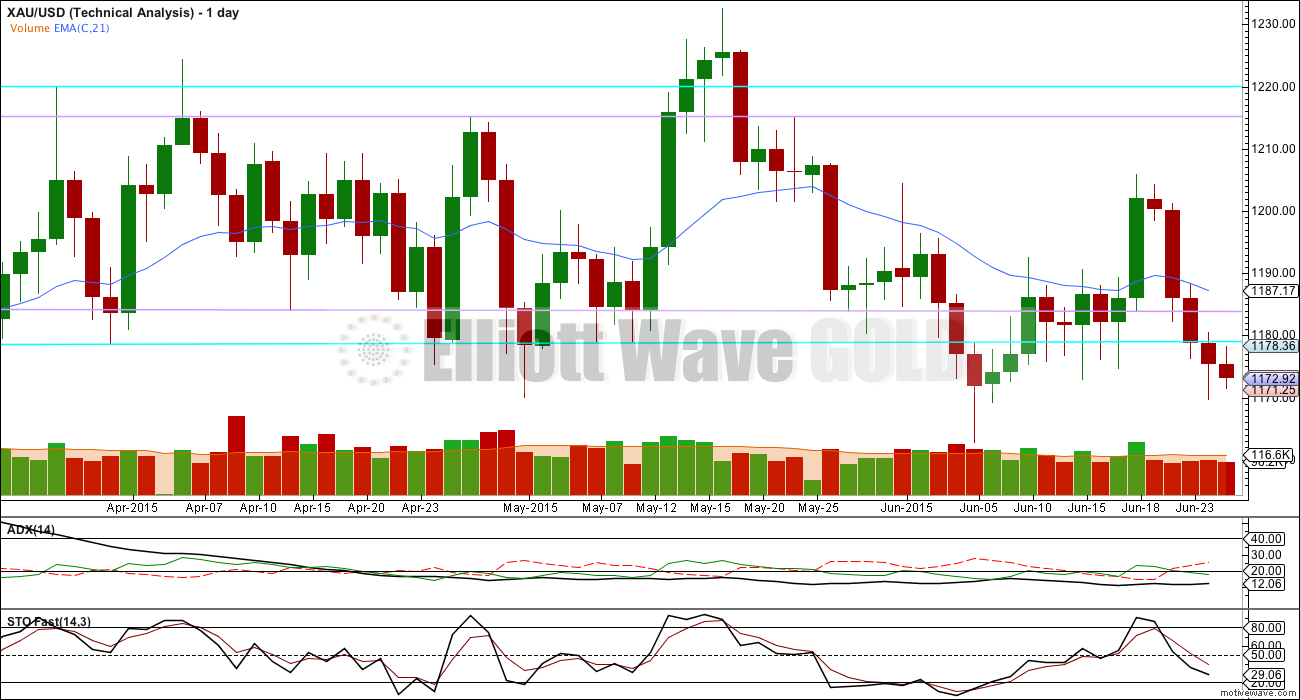
Daily Chart: ADX still indicates there is no clear trend. A range bound trading system would be better employed than a trend following system. Trading in a range bound market, as Gold has been in since the 27th of March, is inherently more risky than trading a trending market. Careful money management rules are essential to avoid wiping out your account. A good rule to follow would be to invest no more than 2% of the equity in your account on any one trade.
The range bound system illustrated here uses horizontal lines of support and resistance along with fast Stochastics to illustrate overbought and oversold. The idea is to expect the end of one swing and the start of another when price is at support or resistance and Stochastics is at oversold or overbought.
Stochastics reached overbought six days ago, but price did not reach resistance and has turned strongly down. Again, this illustrates why trading this market is so risky when using this method, because it is impossible to tell exactly where one swing ends and the other begins; it is only possible to get a general idea.
Eventually Gold will break out of this range it entered on 27th March; a breakout is 100% certain. What is uncertain is what direction the breakout will be. When the breakout comes, then this range trading system will be expecting a move in the opposite direction and the final swing will never come. Additionally, ADX may be slow to indicate the existence of a trend when it finally arrives, which again illustrates why trading this market is so risky.
Gold has been within this range now for 64 days. The longer price remains in this range the closer the breakout will be and the risker it is to expect the sideways swings to continue.
The weight of volume indicators is pointing to a downwards breakout as more likely. This is not definitive and only is indicative. Extreme caution is advised, particularly with any trades to the upside at this stage.
Upwards movement is finding resistance as expected at the lower blue line. Very slightly lower volume for Thursday’s session indicates a small correction may be unfolding, which fits perfectly with the Elliott wave counts. If price breaks through resistance at the lower blue line, it may then find resistance at the lower lilac line.
Stochastics is not yet oversold, so this range trading system would expect an upwards swing to not quite be ready to begin.
This analysis is published about 05:41 p.m. EST.
Gold bull needs to go at least slightly above subminuette wave a at 1,180.42 to target 1188 before dropping. Bear, subminuette wave c is extremely likely there to move at least slightly above a at 1,178.78 to avoid a truncation before dropping.
So gold may be very close to a near term top before dropping. Will it happen before or after Monday open and should we buy GDX or DUST now or then?
For both hourly wave counts I still cannot yet see a completed correction. For the wave count presented on the bull chart: this downwards move was a continuation of subminuette wave b. This wave count now has a problem though. Subminuette wave b is 2.9 X subminuette wave a, longer than the convention of 2 X (the convention which says this is acceptable, there is actually no rule for the length of a B wave within a flat correction). So the probability is lower there. But the subdivisions fit perfectly, it does look like an expanded flat. So now subminuette wave c must move up to at least slightly above subminuette wave a at 1,180.42. Target remains 1,188.
For the hourly count presented for the bear: the truncated fifth wave still reduces the probability there. Alan is right, fifth waves truncate only after a third wave which moves “too far too fast”. I think that the end of subminuette wave iii may fit that description, it was a sharp downwards spike. But the truncation is 1.78 which isn’t really that small…. so on balance I do think this is a problem. That wave count too expects that the correction isn’t over yet. It is still seen as a flat, subminuette wave b ends at today’s low and is 138% of subminuette wave a, exactly the maximum common length. Subminuette wave c is extremely likely there to move at least slightly above a at 1,178.78 to avoid a truncation.
I’m still concluding the correction isn’t over and we should see at least a little upwards movement at least above 1,178.08 before it may be done.
I’m leaving comments now to write that up.
Just for info: Gold price first dropped to 1169.60, went up from there in double quick time to 1177.90 only to drop back down to 1168.10…. IMHO this price movement fits perfectly with Lara’s above suggested bull or bear wave counts A-B-C of a zigzag and 1-2-3 of an impulse…. Question is: Does one expect Gold price to move on up from here or is there another leg down to follow…. With 1170-68 holding, upside looking likely restricted to 1177-79 with 1190-91 on the outside…. Appears to me, Gold price is looking to top //// A cycle turn is due early next week. The moving averages are in the red; which favors looking for potential sell signals at the 5dma/20dma levels….
Gold has started back up. It does look like the short term low is in now. I doubt though that gold will finish its correction today.
Because of the Greek ordeal happening over the weekend, there may also be some quick up and down movement when markets reopen Sunday night (futures).
Lara did mention gold may first drop, which it did down to 1170.31 at 3:03 am leaving a truncation of only 2 cents. Then we had confirmation of wave (ii) above 1178.18 when gold peaked at 1178.76 at 4:33 am. Lara mentioned for both wave counts we should have quite a lot of confidence above 1178.18. Also that price should move up a bit longer, however cautioned that hourly bear could be quite quick and shallow. Gold then dropped to today’s low of 1168.68 at 9:18 am. When I saw that this morning I thought the correction up was over and gold was in the big third wave down to end either above 1162.80 for the bull or below 1162.80 for the bear.
Therefore I was surprised when I read comments that wave v (i) ended at 1168.68 and of expectations of a 5 wave up in wave (ii)? So many Elliott Wave rules that effect interputation of gold movement
A truncation is unusual. I remember reading from Prechter that a truncated fifth wave occurs usually because the third wave prior rose / dropped too far too fast. It does not appear to be so in this price movement. Hence, we are trying to figure out wave counts that avoid a truncation. And the low of 1168.68 happens to fit. (Only thing is that I was too lazy to count the subwaves at different timeframes to verify this; just go for the bigger picture).
1168.68 completed subminuette b for the bull and this calls for a 5 wave up for subminuette c.
It also completed minuette 1 for the bear, and this calls for a 3 wave up for minuette 2.
Let’s see how this plays out.
Tham thanks for your clarification.
This may be a chance to buy GDX today but would need to sell it today due to over the weekend “risk of breakouts to the downside” as per Lara.
However the miners are struggling to move up off their lows for today.
Strong US data Friday showed that U.S. consumer sentiment climbed in June to 96.1 — a five-month high. US dollar has moved up a little to 95.62 from the open at 95.435. Oil is dropping today which puts down pressure on gold.
Also the pending Greece deal is putting downward pressure on gold. If a deal is made gold may drop. Some are saying Monday is the deadline because June 30th their payment is due. However a deal may be delayed longer.
On the TOS trading platform the TTM indicators are giving mixed signals now, no trend near term and longer term is bearish.
Richard. You are right. It is too risky to buy GDX today. I don’t envisage the current rise in gold price to go beyond 1190. And the larger trend is down. I am waiting for the top to buy DUST. Probably happen early next week.
Tham I agree. I am also looking to buy DUST at the next high was hoping for this week instead may be early next week. Hoping it will happen during NYSE market hours. If possible I am willing to buy GDX intraday only if can do it Monday on the way up then sell at 1184 – 1188 or above or else wait for top and buy DUST.
GLD had $258M in positive money flow yesterday.
I think the hourly Bear wave count just played out with a drop to 1169.60 and a quick hike to 1177.90 and now on its way back down. Really need to see Gold price take out 1169.58 whilst upside remains limited to 1178-79 with 1192-93 on the outside.
The drop today to 1170.31 could make the bear count more respectable. It could mean that subminuette 5 is just truncated by only 0.02, and that it becomes a WXY zigzag. This would substantially improve the bear count probability. (Of course, there is the possibilty of a low less than 1170.31 as the very short term price movement is still down).
It could also mean that the bull count is not a triangle by itself for subminette b of minuette a of minute 2, but rather a combination to reach 1170.31.
So, both wave counts will now expect a rise in 5 waves towards the stated targets. It makes analysis easier. Any alternative views?
Sounds fair. However, as you state, there is still the possibilty of further lows. Having no truncation is even better than having a small one. Looking back to the days following the May high, on a daily chart, there is a somewhat similar pattern of a sideways/ down movement. The eventual retracement then was something like 43% and quick.
Looking again, I see 1170.51 as the most recent low. The former low was higher at 1170.79, so there was no truncation. That is quite a bit different than your number. I have had these discrepancies before though. Either way, now I really agree with your assessment that a 5 up is probable at this time!
This is even better. The most recent low at 1168.68. Completely no truncation. The drop may still not be over though.
Yup, looks like 1 down finally over for the bear count
Dollar is breaking higher, so be cautious.
I should have said that the dollar is attempting to break higher. So far, it bounced back some. Gold has a small window of time here.
Matt (or anyone)–continuing my question from 24 June forum. I have held roughly same bear position as yours on gold direction, price etc for some time but recently have some doubts.
Either bull or bear can take gold below 1000 but can bear (after new low below 1000) take gold back up over next 2-5 years to 3-5000 range?
My understanding of Lara’s analysis is as follows:
Only the current bear count can take gold below $1000. Cycle wave (a) for both the bull and bear counts divides as a 5 wave structure. Therefore the following cycle wave (b) (which may or may not have already commenced) can not exceed the 2011 high at $1920. In the less likely event that cycle wave (a) is a 3 wave structure then the 2011 high could be exceeded by way of an expanded flat.
Cycle wave (b) will take a year or more to play out and the following cycle wave (c) will also take a year or more. Consequently, according to Lara’s analysis and depressingly for long term bulls, any new highs beyond $1920 are several years away at best.
Johno (as distinct from the other John on the forum)
Johno, are we in bull or bear–an important question.
I used to believe gold had to be on bear count because I believed bull could not move below 1000 but I asked Lara–she indicated it was possible but not likely ( but within EW rules) that bull could get to 1000 within 12 months . Lara may correct me if I am wrong.
So if both bull and bear can take gold below 1000 the next decision point seems to be which (bull or bear) can take gold substantially higher, possibly 2-5000 in the next several years. Assuming one believes (I do) that world economic conditions will dictate much higher gold in the future.
For me ( not attempting to speak for anyone else) a correct decision on primary bull vs bear clears up lots of questions both short or long term.
I’m looking for thoughts, comments, opinions to help clarify my bull vs bear decision.
Near and short term clarification is more important than clarification about 1 or several years from now. Yes both can go below $1,000 eventually and the bear would get there sooner. As per higher in the long run, not sure which one but they both will go higher.
Gold is surely headed to $25,000, but maybe not until next century
June 26, 2015 12:49 p.m. ET – MARK HULBERT
http://www.marketwatch.com/story/gold-is-surely-headed-to-25000-but-maybe-not-until-next-century-2015-06-17?mod=MW_story_latest_news
Avi Gilburt’s 50-year EW expectation to $25,000
http://www.marketwatch.com/story/avi-gilburt-doubles-down-gold-is-going-to-25000-2015-06-12
Richard, respectfully, how is short-term clarification important?
Gold is in trading range, breakout will come sooner than later and breakout will be either bull or bear. Gold can dawdle in range and short-term traders might make 1% or 2% here or there (if they are very skilled or lucky) The most important decision, the decision that makes or loses 5%, 10%, 15% is primary bull vs bear.
Such a difficult question to answer!
For the bull, if cycle wave b hurry’s up (and it shows every inclination of taking it’s sweet time) then it may take price below 1,131 within 12 months.
Primary wave A may be a zigzag. When an A wave is a three then the following B wave may move beyond the start of the A wave. Primary wave B may move beyond it’s start below 1,131. It could move below 1,000.
If intermediate wave (C) completes within another two or three months…. and primary wave (B) is a quick zigzag down…. it may get below 1,000 within a year.
But B waves are the most difficult of all Elliott waves. They exhibit great variety in form and structure. They are quite often time consuming complicated affairs, horribly difficult to analyse, nightmares to trade….
Primary wave A may also be an impulse. If it is then primary wave B may not make a new low below 1,131. Cycle wave b could yet take price a lot higher over the next couple of years or so, but not above 1,921.15.
So in conclusion because for the bull it’s a cycle degree b wave… my answer must necessarily be vague. It’s possible. It’s likely. But I cannot tell you with any confidence it will happen.
I know that’s not what you want to hear. But it’s a b wave.
Lara, thanks. That’s a great answer because it is EW reality, I may want clarity but respect that you always give EW reality.
Davey , near term is important because I trade it. If you don’t trade it then it may be useless. Both of us will trade longer term so it is important for both of us.
I answered directly under the 24th. Anything involving a bull count taking gold to below $1000 sounds highly unlikely.
Reply above was intended for Davey.
Yes, I believe gold will eventually reach those highs in a few years.
Ha! Davey, I’ve been a proponent of the bear count over the winter, then the bull count through the spring and only recently started doubting and looking at
the bear again….I’ll be selling longs on th next short move up and wait for confirmation.
Lady market has us right where she wants us ….doubting.