
A small green candlestick fits both hourly Elliott wave counts perfectly.
Summary: This correction is not done yet. Monday should see some upwards movement to at least a little above 1,178.78. Targets are either 1,181 or 1,186 – 1,188. When there is a complete small five up, then the next wave down should begin. Warning: the bear wave count is getting close to the middle of a big third wave and any surprises may be to the downside; the next wave down may be very swift and strong.
To see the bigger picture and weekly charts go here.
Changes to last analysis are italicised.
Bull Wave Count
Click chart to enlarge.
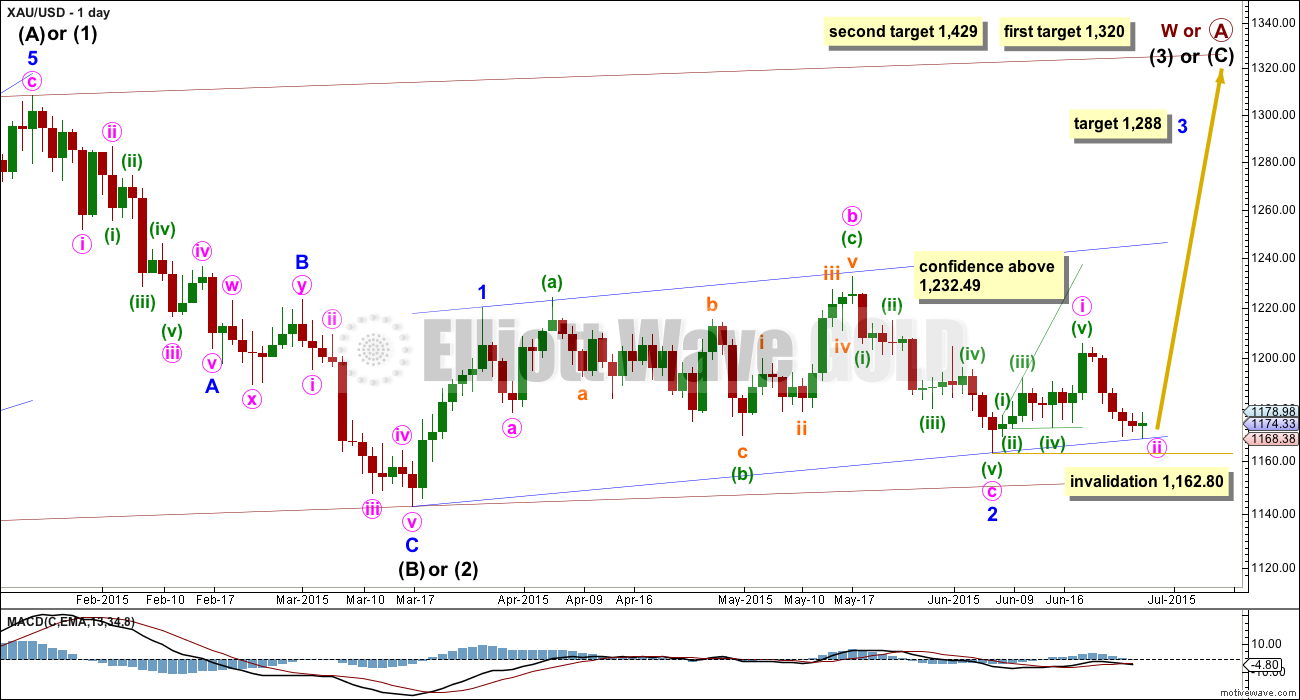
The bull wave count sees primary wave 5 and so cycle wave a a complete five wave impulse on the weekly chart.
Pros:
1. The size of the upwards move labelled here intermediate wave (A) looks right for a new bull trend at the weekly chart level.
2. The downwards wave labelled intermediate wave (B) looks best as a three.
3. The small breach of the channel about cycle wave a on the weekly chart would be the first indication that cycle wave a is over and cycle wave b has begun.
Cons:
1. Within intermediate wave (3) of primary wave 5 (now off to the left of this chart), to see this as a five wave impulse requires either gross disproportion and lack of alternation between minor waves 2 and 4 or a very rare running flat which does not subdivide well. I have tried to see a solution for this movement, and no matter what variation I try it always has a problem which violates an Elliott wave rule.
2. Intermediate wave (5) of primary wave 5 (now off to the left of the chart) has a count of seven which means either minor wave 3 or 5 looks like a three on the daily chart.
3. Expanding leading diagonals (of which intermediate wave (A) or (1) is) are are not very common (the contracting variety is more common). There is also now a second expanding leading diagonal for minute wave i.
4. Volume does not support this bull wave count.
For volume to clearly support the bull wave count it needs to show an increase beyond 187.34 (30th April) and preferably beyond 230.3 (9th April) for an up day. Only then would volume more clearly indicate a bullish breakout is more likely than a bearish breakout.
Within cycle wave b, primary wave A may be either a three or a five wave structure. So far within cycle wave b there is a 5-3 and an incomplete 5 up. This may be intermediate waves (A)-(B)-(C) for a zigzag for primary wave A, or may also be intermediate waves (1)-(2)-(3) for an impulse for primary wave A. At 1,320 intermediate wave (C) would reach equality in length with intermediate wave (A) and primary wave A would most likely be a zigzag. At 1,429 intermediate wave (3) would reach 1.618 the length of intermediate wave (1) and primary wave A would most likely be an incomplete impulse.
Intermediate wave (A) subdivides only as a five. I cannot see a solution where this movement subdivides as a three and meets all Elliott wave rules (with the sole exception of a very rare triple zigzag which does not look right). This means that intermediate wave (B) may not move beyond the start of intermediate wave (A) below 1,131.09. That is why 1,131.09 is final confirmation for the bear wave count at the daily and weekly chart level.
Intermediate wave (C) is likely to subdivide as an impulse to exhibit structural alternation with the leading diagonal of intermediate wave (A). This intermediate wave up may be intermediate wave (3) which may only subdivide as an impulse.
Minor wave 2 is over here. Minute wave c is just 2.7 longer than 1.618 the length of minute wave a. At 1,288 minor wave 3 would reach 1.618 the length of minor wave 1.
Within minor wave 3, no second wave correction may move beyond its start below 1,162.80.
A new high above 1,232.49 would eliminate the bear wave count and provide full confidence in the targets.
Hourly Bull Wave Count
Click chart to enlarge.
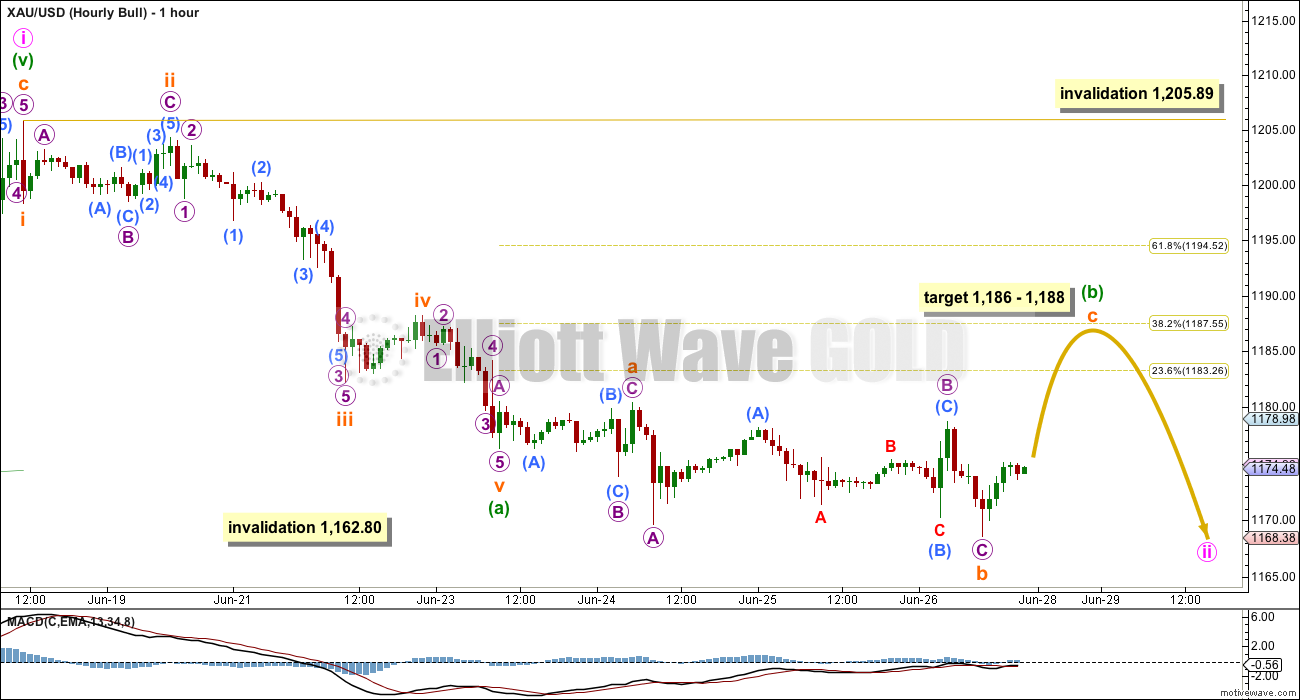
I am again presenting two different ways to see this downwards / sideways movement which fits in exactly the same way for bull and bear wave counts. This is because A-B-C of a zigzag and 1-2-3 of an impulse both subdivide 5-3-5, and they both look the same.
This first idea now has a problem which reduces its probability to about even with the second idea.
If minuette wave (a) (and for the bear it would be minuette wave (i)) ends earlier, then minuette wave (b) would be unfolding as a flat correction. The problem now is the length of submineutte wave b, which is now 2.9 times the length of subminuette wave a. There is no rule stating the maximum length for a B wave within a flat correction, but there is a convention that says when the B wave is more then 2 X the length of the A wave the probability of a flat is greatly reduced. I have seen flats with B waves up to 3 X the length of the A wave, so it certainly can happen, but it’s just not very common.
Subminuette wave a subdivides as a three. Subminuette wave b is now also a complete three. Subminuette wave c should move higher as a five wave structure. At 1,186 subminuette wave c would reach 4.236 the length of subminuette wave a, and at 1,188 minuette wave (b) would reach up to the 0.382 Fibonacci ratio of minuette wave (a). This gives a $2 target zone for upwards movement.
Bear Wave Count
Click chart to enlarge.
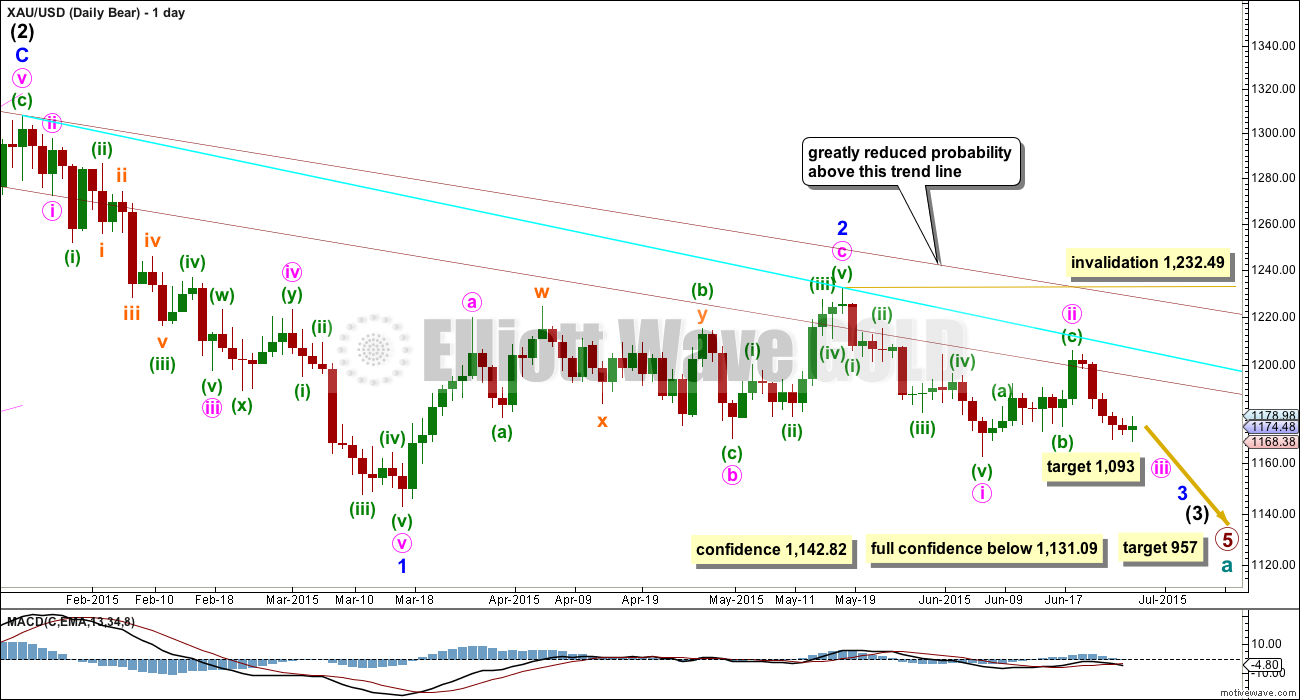
This wave count follows the bear weekly count which sees primary wave 5 within cycle wave a as incomplete. At 957 primary wave 5 would reach equality in length with primary wave 1.
Pros:
1. Intermediate wave (1) (to the left of this chart) subdivides perfectly as a five wave impulse with good Fibonacci ratios in price and time. There is perfect alternation and proportion between minor waves 2 and 4. For this piece of movement, the bear wave count has a much better fit than the bull wave count.
2. Intermediate wave (2) is a very common expanded flat correction. This sees minor wave C an ending expanding diagonal which is more common than a leading expanding diagonal.
3. Minor wave B within the expanded flat subdivides perfectly as a zigzag.
4. Volume at the weekly and daily chart continues to favour the bear wave count. Since price entered the sideways movement on 27th March it is a downwards week which has strongest volume, and it is downwards days which have strongest volume, five of them.
5. On Balance Volume on the weekly chart breached a trend line from back to December 2013. This is another bearish indicator.
Cons:
1. Intermediate wave (2) looks too big on the weekly chart.
2. Intermediate wave (2) has breached the channel from the weekly chart which contains cycle wave a.
3. Minor wave 2 is much longer in duration than a minor degree correction within an intermediate impulse normally is for Gold. Normally a minor degree second wave within a third wave should last only about 20 days maximum. This one is 44 days long.
4. Within minor wave 1 down, there is gross disproportion between minute waves iv and ii: minute wave iv is more than 13 times the duration of minute wave i, giving this downwards wave a three wave look.
Minor waves 1 and 2 are complete. Minute wave i within minor wave 3 may be incomplete on the hourly chart.
Minute wave ii may not move beyond the start of minute wave i above 1,232.49.
At this stage, a new low below 1,162.80 would provide a lot of confidence in the bear wave count. Further confidence would come with a new low below 1,142.82 and final confidence would come only with a new low below 1,131.09.
Minute wave ii is now very likely to be over here. If it moves any higher, then it should find strong resistance at the blue trend line.
Hourly Bear Wave Count
Click chart to enlarge.
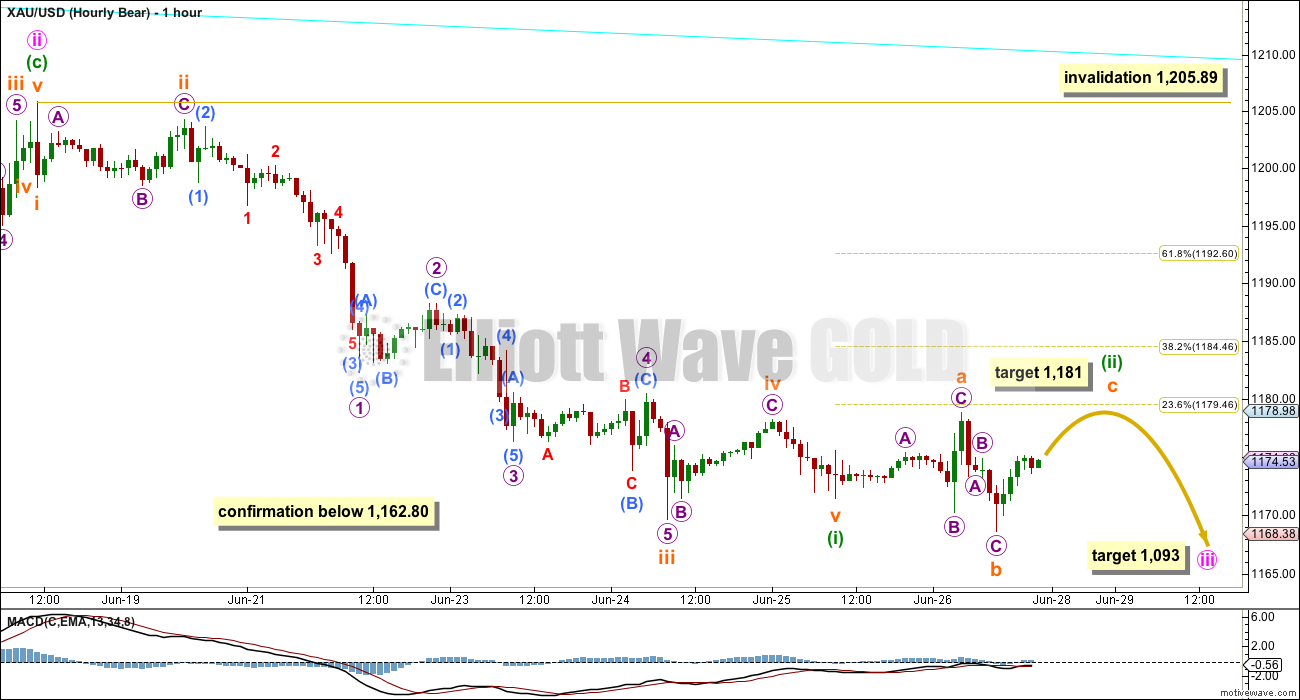
This second idea works in exactly the same way for the bull wave count.
The downwards impulse for minuette wave (i) (and for the bull count minuette wave (a)) may have ended with a truncated fifth wave. This truncation reduces the probability of this idea. Fifth waves are truncated when the prior third wave moves “too far too fast”. The end of subminuette wave iii was a sharp downwards spike which may possibly fit that description, but the truncation is not small at 1.78 and so on balance this is a problem for this wave count.
Minuette wave (ii) would be unfolding as a flat correction. Subminuette wave a subdivides as a three, and subminuette wave b looks like a three on the hourly chart. It is a 138% correction of subminuette wave a, right on the maximum common length which is 100% to 138%.
Subminuette wave c must subdivide as a five and it is extremely likely to make at least a slight new high above the end of subminuette wave a at 1,178.78 to avoid a truncation and a very rare running flat. At 1,181 subminuette wave c would reach 2.618 the length of subminuette wave a.
Warning: for this bear wave count the middle of intermediate wave (3) is getting quite close. Expect any surprises to be to the downside. With volume indicators pointing to a downwards breakout as more likely than upwards, and price below the lower horizontal support line on the TA chart, a downwards breakout might possibly be imminent. The next move may be a swift strong move down, if the bear count is the correct count.
Minuette wave (ii) may not move beyond the start of minuette wave (i) above 1,205.89.
Technical Analysis
Click chart to enlarge.
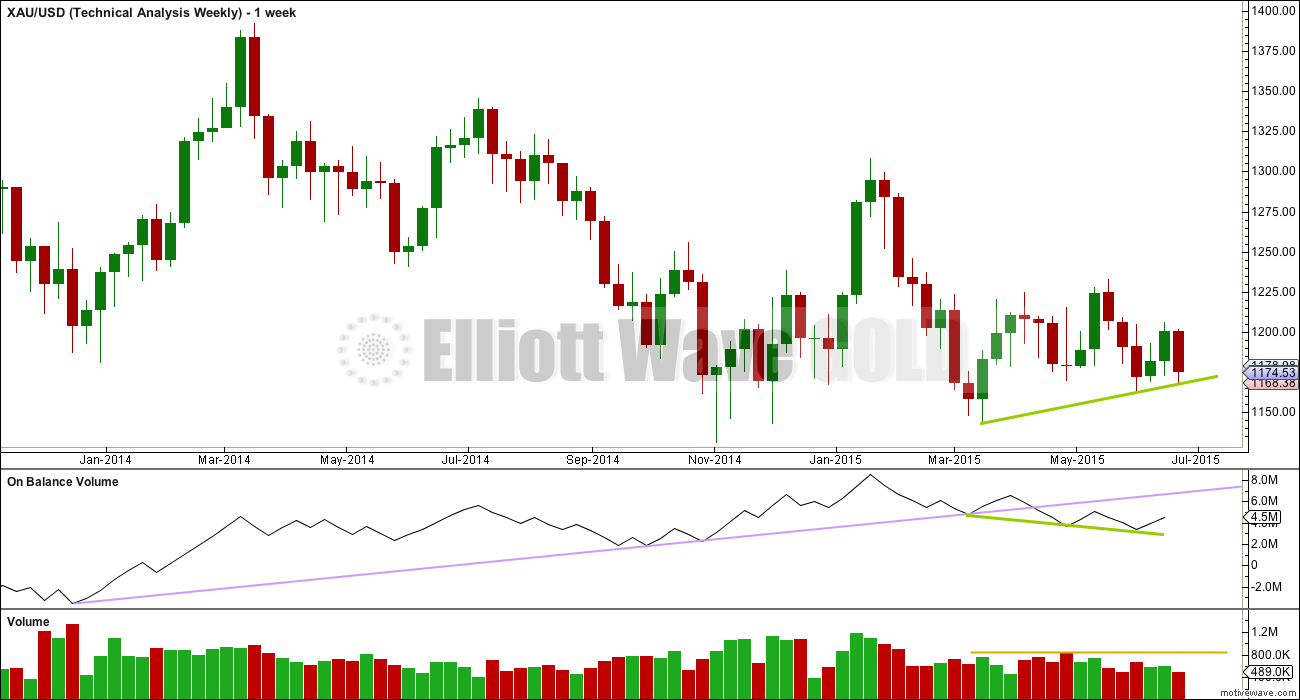
Weekly Chart: Overall volume still favours a downwards breakout eventually. During this sideways movement, it is still down days and a down week which have higher volume. On Balance Volume breaches a trend line (lilac line) which began in December 2013, and the breach is significant.
While price has made higher lows, On Balance Volume has made lower lows (green trend lines). This small rise in price is not supported by volume, and it is suspicious.
At the weekly chart level, volume consistently favours a bearish breakout: over the last three weeks, the two up weeks have lower volume than the prior down week; and, this pattern was also seen for prior moves within this sideways range, with the four down weeks from 29th March to 26th April stronger than the following two up weeks.
Click chart to enlarge.
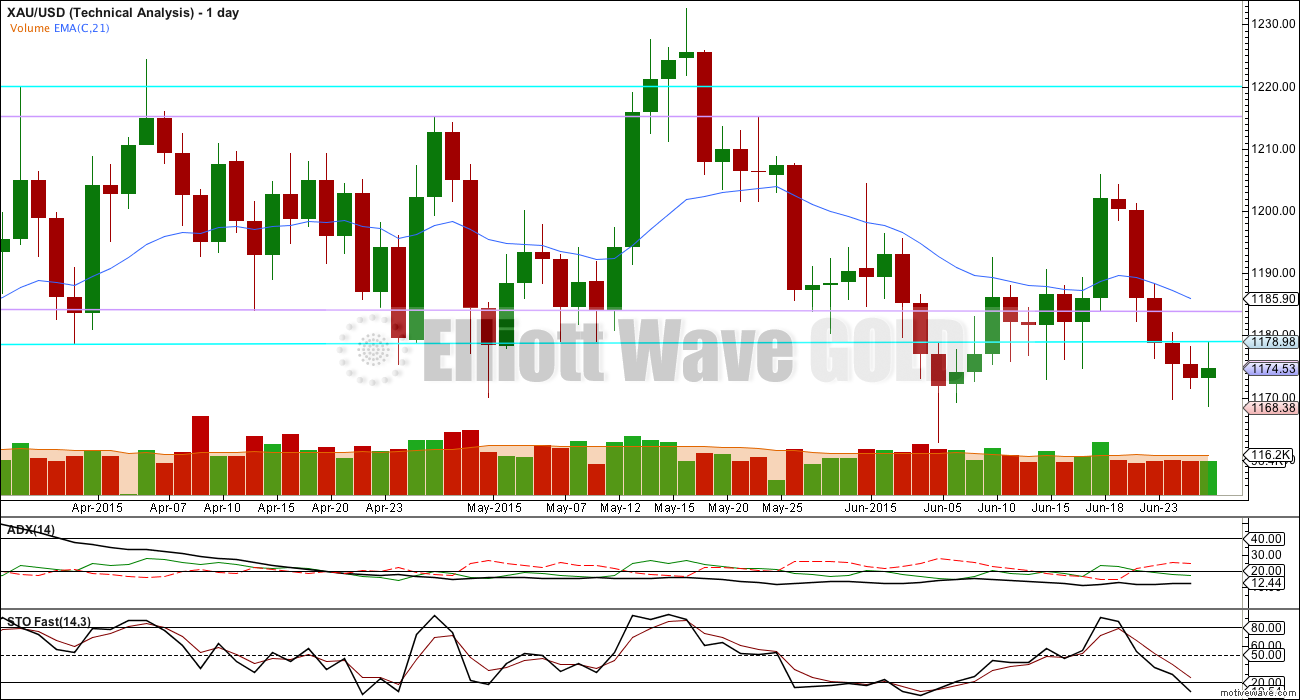
Daily Chart: ADX still indicates there is no clear trend. A range bound trading system would be better employed than a trend following system. Trading in a range bound market, as Gold has been in since the 27th of March, is inherently more risky than trading a trending market. Careful money management rules are essential to avoid wiping out your account. A good rule to follow would be to invest no more than 2% of the equity in your account on any one trade.
The range bound system illustrated here uses horizontal lines of support and resistance along with fast Stochastics to illustrate overbought and oversold. The idea is to expect the end of one swing and the start of another when price is at support or resistance and Stochastics is at oversold or overbought.
Stochastics reached overbought seven days ago, but price did not reach resistance and has turned strongly down. Again, this illustrates why trading this market is so risky when using this method, because it is impossible to tell exactly where one swing ends and the other begins; it is only possible to get a general idea.
Eventually Gold will break out of this range it entered on 27th March; a breakout is 100% certain. What is uncertain is what direction the breakout will be. When the breakout comes, then this range trading system will be expecting a move in the opposite direction and the final swing will never come. Additionally, ADX may be slow to indicate the existence of a trend when it finally arrives, which again illustrates why trading this market is so risky.
Gold has been within this range now for 65 days. The longer price remains in this range the closer the breakout will be and the risker it is to expect the sideways swings to continue.
The weight of volume indicators is pointing to a downwards breakout as more likely. This is not definitive and only is indicative. Extreme caution is advised, particularly with any trades to the upside at this stage.
Upwards movement continues to find resistance at the lower horizontal trend line. If price is finally breaking out downwards, then a throwback to that line would be most common. Volume is low for Friday’s session, lower than the downwards day two days ago, suggesting today’s green candlestick is a move against a downwards trend.
The upper and lower shadows for today’s candlestick are about even, suggesting indecision and a balance today of bulls and bears. Indecision is a feature of corrections.
Stochastics has reached oversold on yesterday’s candlestick suggesting at least a little upwards movement from here. Overall the regular TA picture fits both Elliott wave counts for the short term exactly.
This analysis is published about 04:32 p.m. EST.
Why I See Gold Headed For $880
Jun. 29, 2015 7:30 AM ET
http://seekingalpha.com/article/3289625-why-i-see-gold-headed-for-880
With 1174-73/70 holding, appears that gold price is set-up to rally for a test / take out of 1186-87…. for possible bullish reversal in play….
You may be right. I hope Lara gives us a comment before the close on the direction for gold near term like next 24 hours.
Yeah, I am hoping your .618 retrace works to hold gold price back lol
I’m here now. Have been looking at this little downwards move and I’m finding it hard to see it as a complete five.
I think it may be a series of 1-2, 1-2 waves.
OR… it may be another correction and we may possibly see a new high above 1,188.
And I have not yet determined if I can rule out that second option.
I conclude it is most likely the correction is over here and price is most likely to keep falling for at least a day.
If the bear count is correct then this week price should fall off a cliff, hard. Should.
If the bull count is correct then maybe just one more red daily candlestick will complete minute ii.
Lara, gold appears to have followed the bull hourly targets.
I estimated .618 retrace as possibly 1182.38.
Gold futures settled at 1-week high of 1,179.
Is this week more likely to have a higher rebound up in the trading range or deeper lows?
Perhaps the fact that miners are dropping hard the last two days even though gold is moving up is a leading indicator of more bearish times ahead?
Both wave counts are still possible. I tend to be bearish.
Siding very slightly with the bear count due to the weight of volume indicators, I’d be expecting a hard drop this week. Very hard.
The bull count remains valid though.
Gold futures settle at 1-week high on Greek turmoil
http://www.marketwatch.com/story/gold-futures-settle-at-1-week-high-on-greek-turmoil-2015-06-29
Strange that gold closes at 1 week high and miners are heading south today?
Gold 1179.85 up .52%
GDX 17.99 down .55%
DUST 17.57 up 1.97%
GDXJ 24.56 down 1.21
JDST 8.20 up 4.19%
Gold and GDX have very little in common wrt price
Over 80% of the time, they move in the same direction.
6 things U.S. investors need to know about Greece right now
http://www.marketwatch.com/story/6-things-us-investors-need-to-know-about-greece-right-now-2015-06-29?page=1
Today’s low at 1173.93 at 9:39 am looks to me like a 5 wave count down from Sunday’s high of 1187.61 at 7:39 pm EST.
Possible retrace target 1182.38.
1187.61 – 1173.93 = 13.68 x .618 = 8.45 + 1173.93 = 1182.38
Even though Gold moved back up today’s high of 1180.67 at 11:11 am the miners barely moved off of today’s lows. The market is afraid of gold and more afraid of the miners.
Any wave counts or opinions?
That 5 wave down looks like a diagonal, which means retrace up could easily be more than .618.
I agree. It looks like the next move up should be a deep second wave correction. Let’s see what Lara says.
Yes, it fits as a leading expanding diagonal.
It also fits as three overlapping first and second waves. Which is actually more likely, because leading expanding diagonals aren’t very common structures.
I’d go with the first and second wave idea. That’s actually really common.
Which means downwards movement from here.
Actually, upon further reflection it does look like a pretty nice leading expanding diagonal. The lower 1-3 trend line is slightly overshot, it has a pretty typical look.
I think because it fits so perfectly within its trend lines I may choose that option for this small downwards wave.
Which would expect a little upwards movement before the next wave down begins. Invalidation point 1,188, target for a little upwards movement above 1,183.
Agree with this count Richard.
If the bear count is right, we should decline from here with force
Thought upside over at 1187 but price is reversing to target 1192…Any suggestion from the experienced traders to go short>>>.
Greece stock market shut at least 1 day and banks shut until results of emergency July 5th referendum on Greece’s debt proposal to its international creditors.
Any opinions on how this may effect gold?
Would gold spike up on Sunday night and Monday?
already has, spiked to target 1186
A VIEW: Momentum seems to have slowed down for a possible snap rally / price rise to occur (for the short term). Got to be cautious here~!…. Remains to be seen if Gold price can get above 1190-91-93 which would then be the place to go long…. My sentiment remains for the downside looking for sell short signals at or around 20dma level (1182-83) or above between 20dma & 50dma for a take out of Friday low 1167.10 seeking 1165-64…. Gold price has not yet threatened to seek the initially projected downside 1158, I just wonder…. hmmm
Read the commentary
Which count is favored?
The bear count slightly, because of volume indicators.
But price must ultimately determine which count is correct. We need a breakout.
Looks like cot data looks mighty bearish!
Also looks like dust has started a 3rd of a 3rd, target 23.75-24. Cannot wait till next week, been waiting a long time for this breakout to occur!
Thanks to Lara, made a huge chunk of money in Feb-Mar. Looking to repeat starting next week. GLTA!!!
That’s awesome Shahab!
I too have been waiting far too long for this breakout. This is an exceptionally long time for Gold to remain range bound, it’s tested the patience of all here I think and many more indeed.