
Upwards movement to at least a little above 1,178.78 was expected for both Elliott wave counts.
Targets were either 1,181 or 1,186 – 1,188. Price moved higher as expected to reach up to just 0.16 above the second target.
Summary: It is most likely that downwards movement will continue from here. The target for the bull wave count would be at 1,168 and the target for the bear count at 1,110. It is possible that a B or second wave may drift sideways for much of this week first though; this is more possible for the bull than the bear. Warning: the bear wave count is getting close to the middle of a big third wave and any surprises may be to the downside; the next wave down may be very swift and strong.
To see the bigger picture and weekly charts go here.
Changes to last analysis are italicised.
Bull Wave Count
Click chart to enlarge.
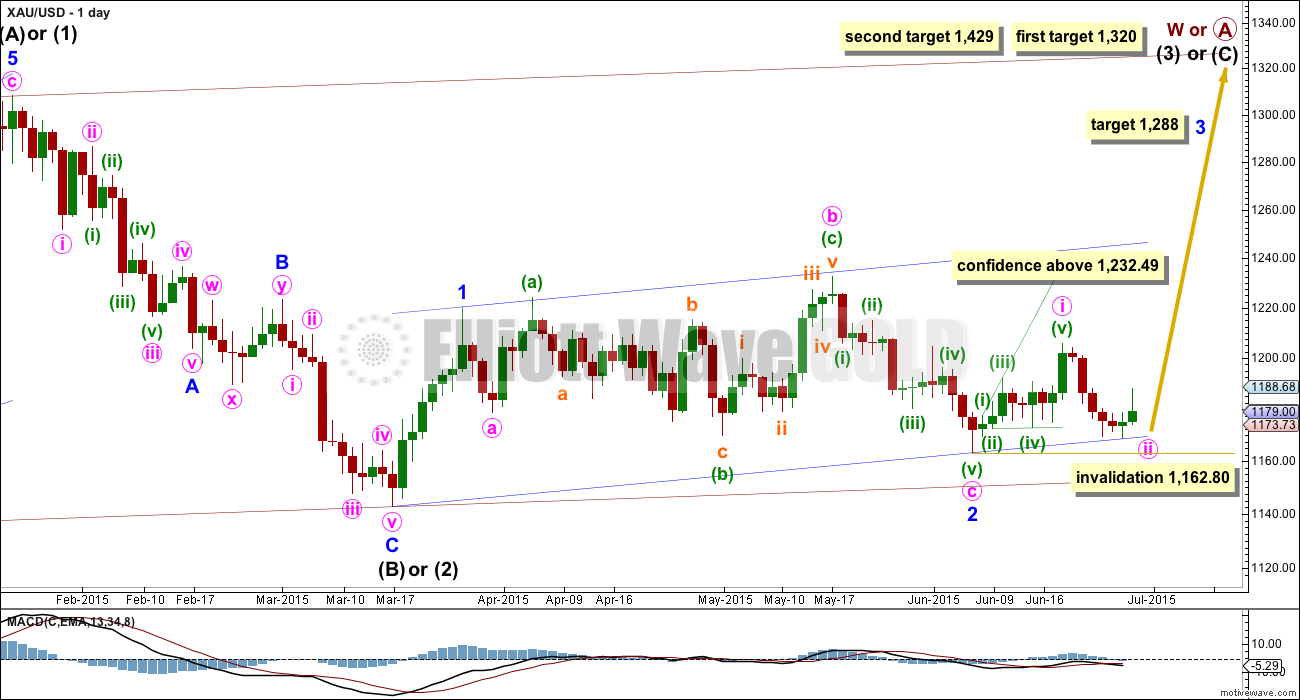
The bull wave count sees primary wave 5 and so cycle wave a a complete five wave impulse on the weekly chart.
Pros:
1. The size of the upwards move labelled here intermediate wave (A) looks right for a new bull trend at the weekly chart level.
2. The downwards wave labelled intermediate wave (B) looks best as a three.
3. The small breach of the channel about cycle wave a on the weekly chart would be the first indication that cycle wave a is over and cycle wave b has begun.
Cons:
1. Within intermediate wave (3) of primary wave 5 (now off to the left of this chart), to see this as a five wave impulse requires either gross disproportion and lack of alternation between minor waves 2 and 4 or a very rare running flat which does not subdivide well. I have tried to see a solution for this movement, and no matter what variation I try it always has a problem which violates an Elliott wave rule.
2. Intermediate wave (5) of primary wave 5 (now off to the left of the chart) has a count of seven which means either minor wave 3 or 5 looks like a three on the daily chart.
3. Expanding leading diagonals (of which intermediate wave (A) or (1) is) are are not very common (the contracting variety is more common). There is also now a second expanding leading diagonal for minute wave i.
4. Volume does not support this bull wave count.
For volume to clearly support the bull wave count it needs to show an increase beyond 187.34K (30th April) and preferably beyond 230.3K (9th April) for an up day. Only then would volume more clearly indicate a bullish breakout is more likely than a bearish breakout. Although volume for Monday at 166.8K is an increase, it is not enough for a bullish volume indicator.
Within cycle wave b, primary wave A may be either a three or a five wave structure. So far within cycle wave b there is a 5-3 and an incomplete 5 up. This may be intermediate waves (A)-(B)-(C) for a zigzag for primary wave A, or may also be intermediate waves (1)-(2)-(3) for an impulse for primary wave A. At 1,320 intermediate wave (C) would reach equality in length with intermediate wave (A) and primary wave A would most likely be a zigzag. At 1,429 intermediate wave (3) would reach 1.618 the length of intermediate wave (1) and primary wave A would most likely be an incomplete impulse.
Intermediate wave (A) subdivides only as a five. I cannot see a solution where this movement subdivides as a three and meets all Elliott wave rules (with the sole exception of a very rare triple zigzag which does not look right). This means that intermediate wave (B) may not move beyond the start of intermediate wave (A) below 1,131.09. That is why 1,131.09 is final confirmation for the bear wave count at the daily and weekly chart level.
Intermediate wave (C) is likely to subdivide as an impulse to exhibit structural alternation with the leading diagonal of intermediate wave (A). This intermediate wave up may be intermediate wave (3) which may only subdivide as an impulse.
Minor wave 2 is over here. Minute wave c is just 2.7 longer than 1.618 the length of minute wave a. At 1,288 minor wave 3 would reach 1.618 the length of minor wave 1.
Within minor wave 3, no second wave correction may move beyond its start below 1,162.80.
A new high above 1,232.49 would eliminate the bear wave count and provide full confidence in the targets.
Hourly Bull Wave Count
Click chart to enlarge.
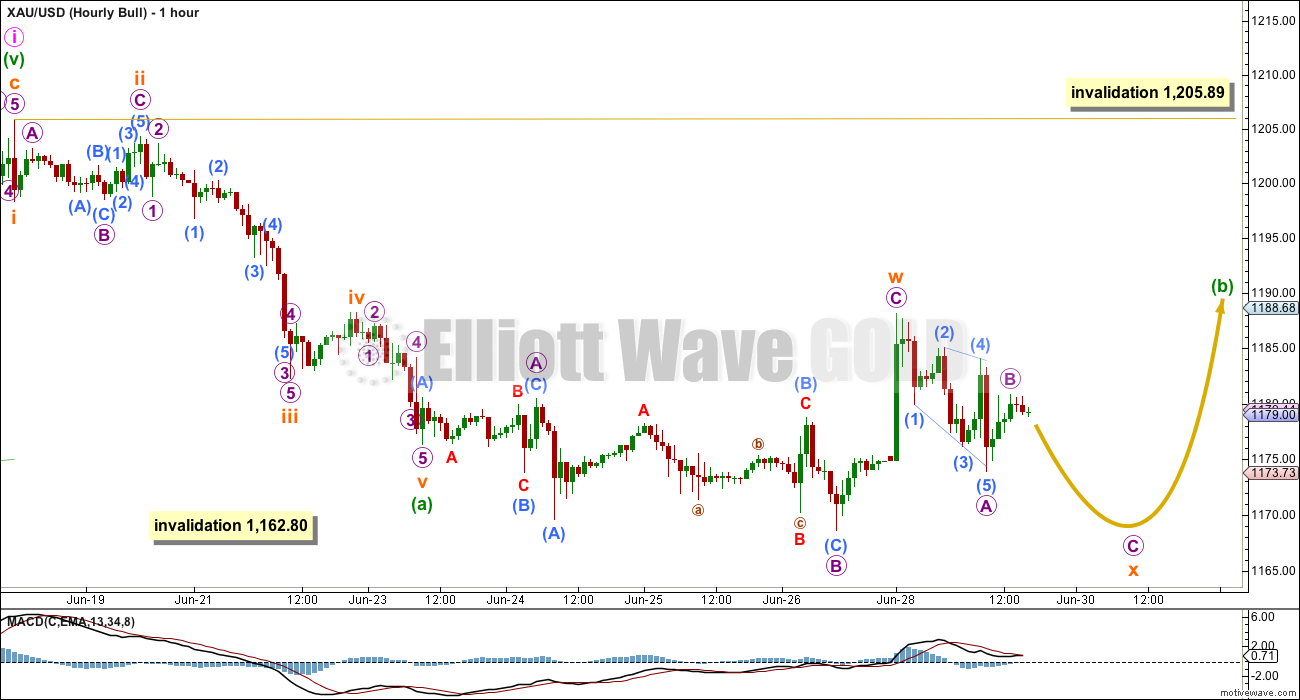
Again I am presenting two different ideas at the hourly chart level which work in exactly the same way for bull and bear wave counts. This is because A-B-C of a zigzag and 1-2-3 of an impulse subdivide in exactly the same way: 5-3-5.
This first idea is more likely for the bull wave count than the bear, so I present it under the bull wave count.
Minute wave ii down is unfolding as a zigzag. Minuette wave (a) is complete. Minuette wave (b) may also be complete (as per the idea presented for the bear hourly wave count) or it may yet drift sideways as a double flat or double combination this week.
The first structure in the double is an expanded flat labelled subminuette wave w. The double would be joined by a three in the opposite direction labelled subminuette wave x which is incomplete. Subminuette wave x may move beyond the start of subminuette wave w below 1,176.35, so there is no downwards invalidation point for this idea.
When subminuette wave x is complete, then a second structure may unfold sideways, which may be a flat, triangle or zigzag and would most likely end about the same level as subminuette wave w at 1,188.16 because the purpose of both double flats and double combinations is to take up time and move price sideways.
Minuette wave (b) may not move beyond the start of minuette wave (a) above 1,205.89.
Bear Wave Count
Click chart to enlarge.
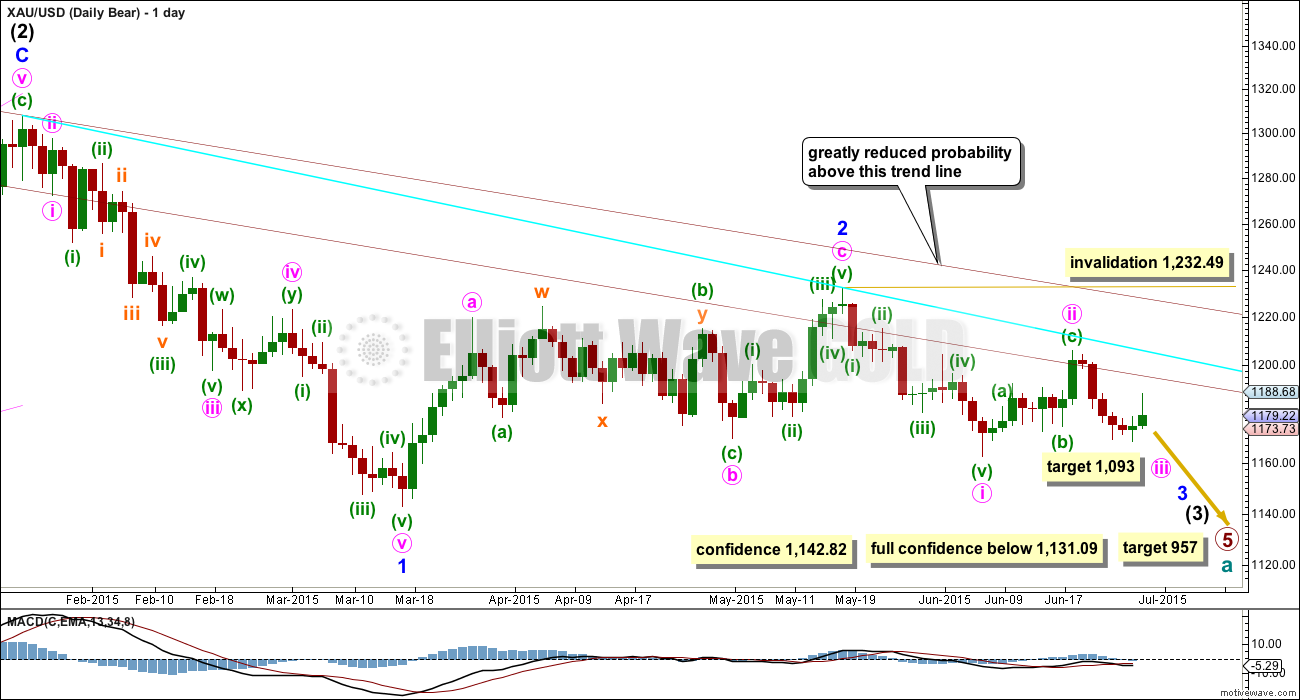
This wave count follows the bear weekly count which sees primary wave 5 within cycle wave a as incomplete. At 957 primary wave 5 would reach equality in length with primary wave 1.
Pros:
1. Intermediate wave (1) (to the left of this chart) subdivides perfectly as a five wave impulse with good Fibonacci ratios in price and time. There is perfect alternation and proportion between minor waves 2 and 4. For this piece of movement, the bear wave count has a much better fit than the bull wave count.
2. Intermediate wave (2) is a very common expanded flat correction. This sees minor wave C an ending expanding diagonal which is more common than a leading expanding diagonal.
3. Minor wave B within the expanded flat subdivides perfectly as a zigzag.
4. Volume at the weekly and daily chart continues to favour the bear wave count. Since price entered the sideways movement on 27th March it is a downwards week which has strongest volume, and it is downwards days which have strongest volume, five of them.
5. On Balance Volume on the weekly chart breached a trend line from back to December 2013. This is another bearish indicator.
Cons:
1. Intermediate wave (2) looks too big on the weekly chart.
2. Intermediate wave (2) has breached the channel from the weekly chart which contains cycle wave a.
3. Minor wave 2 is much longer in duration than a minor degree correction within an intermediate impulse normally is for Gold. Normally a minor degree second wave within a third wave should last only about 20 days maximum. This one is 44 days long.
4. Within minor wave 1 down, there is gross disproportion between minute waves iv and ii: minute wave iv is more than 13 times the duration of minute wave i, giving this downwards wave a three wave look.
Minor waves 1 and 2 are complete. Minute wave i within minor wave 3 may be incomplete on the hourly chart.
Minute wave ii may not move beyond the start of minute wave i above 1,232.49.
At this stage, a new low below 1,162.80 would provide a lot of confidence in the bear wave count. Further confidence would come with a new low below 1,142.82 and final confidence would come only with a new low below 1,131.09.
Minute wave ii is now very likely to be over here. If it moves any higher, then it should find strong resistance at the blue trend line.
Hourly Bear Wave Count

Click chart to enlarge.
This second idea also works in exactly the same way for the bull wave count.
For the bear wave count, because minuette wave (ii) is a second wave correction within a third wave one, two, and three degrees higher, then minuette wave (ii) is most likely to be relatively brief and shallow, and is most likely to be over here.
Minuette wave (ii) is an expanded flat correction. Subminuette wave b was 2.9 times the length of subminuette wave a, much longer than the common length of 0.138 and longer than the maximum convention of 2. However, the subdivisions all fit perfectly and no rule is violated. Subminuette wave c has no Fibonacci ratio to subminuette wave a, but it moves substantially beyond the end of subminuette wave a avoiding a rare running flat. Minuette wave (ii) may have corrected to just above the 0.382 Fibonacci ratio of minuette wave (i).
At 1,110 minuette wave (iii) would reach 2.618 the length of minuette wave (i).
Micro wave 2 may not move beyond the start of micro wave 1 above 1,188.16. Micro wave 2 would most likely move a little higher, because this is a second wave correction following a leading diagonal in a first wave position and they are normally very deep.
If 1,188.16 is breached, then the idea presented on the bull hourly chart would be correct for this bear wave count also. Minuette wave (ii) may be drifting sideways as a double flat or double combination. The invalidation point would then move up to 1,205.89 and another three days of sideways movement would be expected.
Technical Analysis
Click chart to enlarge.
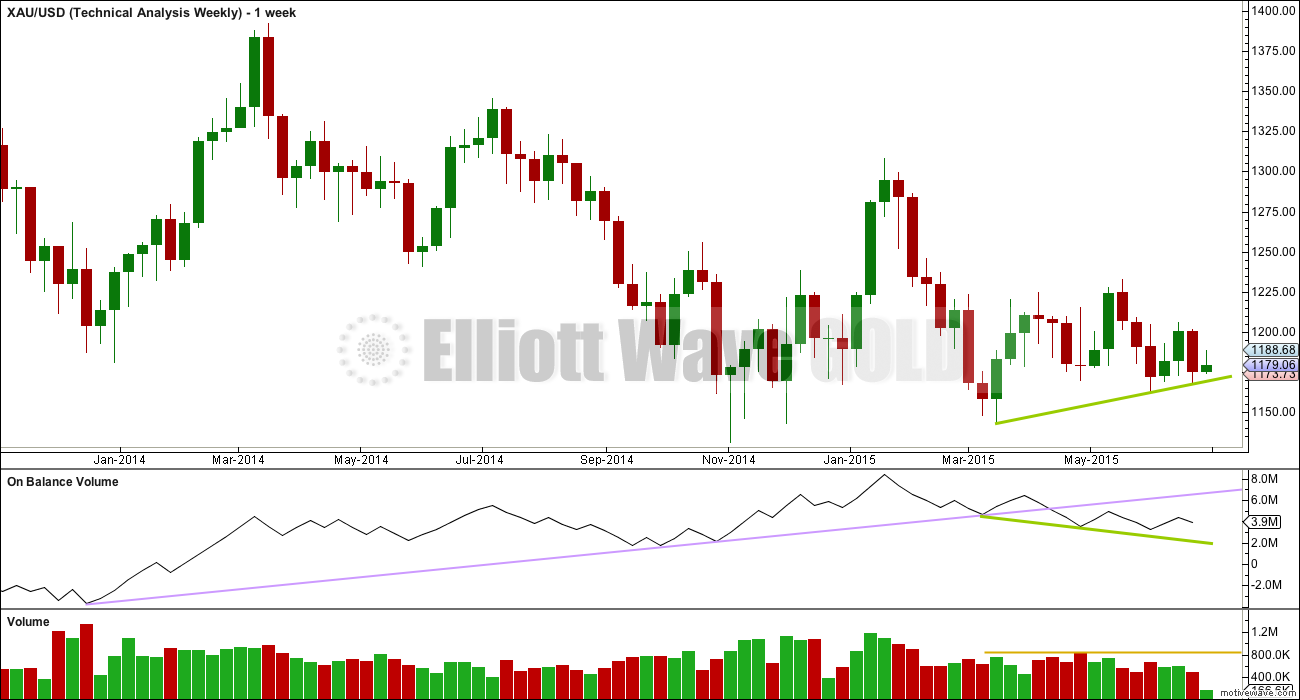
Weekly Chart: Overall volume still favours a downwards breakout eventually. During this sideways movement, it is still down days and a down week which have higher volume. On Balance Volume breaches a trend line (lilac line) which began in December 2013, and the breach is significant.
While price has made higher lows, On Balance Volume has made lower lows (green trend lines). This small rise in price is not supported by volume, and it is suspicious.
At the weekly chart level, volume is strongest in a down week. Overall volume is declining, typical of a maturing consolidation. Each series of down weeks includes a week with stronger volume than the following series of up weeks. The breakout should come very soon now and volume indicates a downwards breakout is more likely than upwards.
Click chart to enlarge.
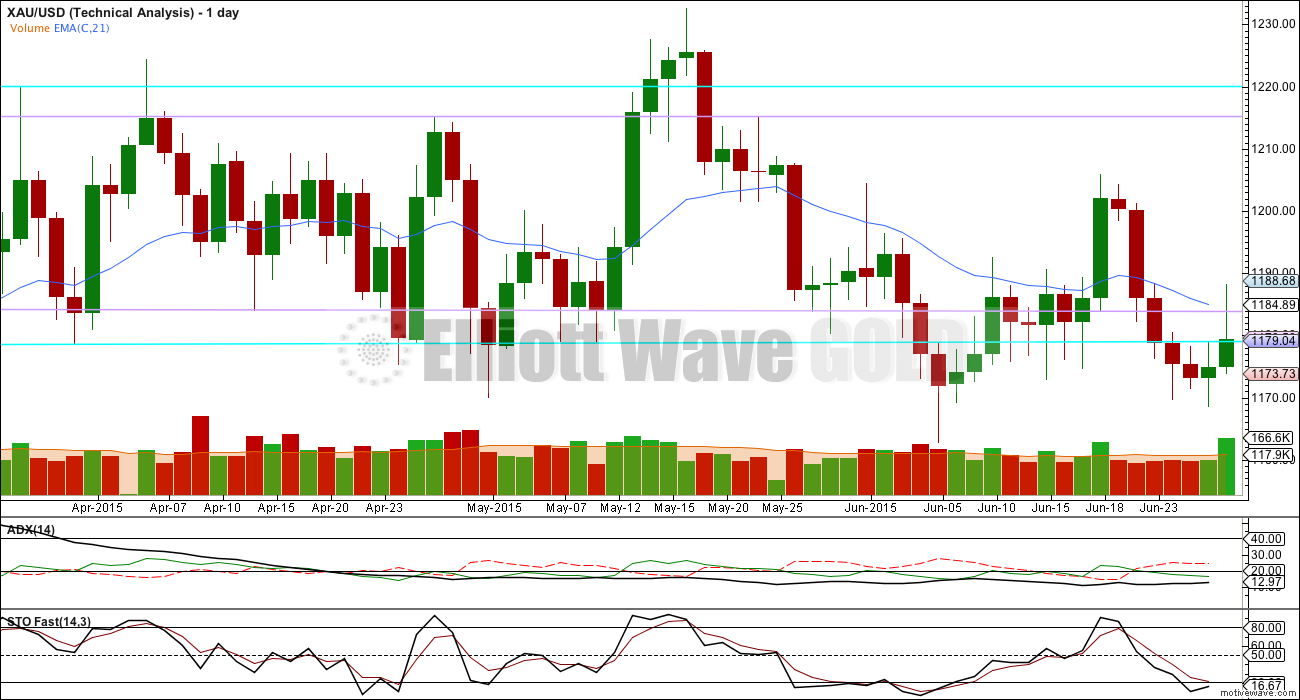
Daily Chart: ADX still indicates there is no clear trend. A range bound trading system would be better employed than a trend following system. Trading in a range bound market, as Gold has been in since the 27th of March, is inherently more risky than trading a trending market. Careful money management rules are essential to avoid wiping out your account. A good rule to follow would be to invest no more than 2% of the equity in your account on any one trade.
The range bound system illustrated here uses horizontal lines of support and resistance along with fast Stochastics to illustrate overbought and oversold. The idea is to expect the end of one swing and the start of another when price is at support or resistance and Stochastics is at oversold or overbought.
Eventually Gold will break out of this range it entered on 27th March; a breakout is 100% certain. What is uncertain is what direction the breakout will be. When the breakout comes, then this range trading system will be expecting a move in the opposite direction and the final swing will never come. Additionally, ADX may be slow to indicate the existence of a trend when it finally arrives, which again illustrates why trading this market is so risky.
Gold has been within this range now for 66 days. The longer price remains in this range the closer the breakout will be and the risker it is to expect the sideways swings to continue.
The weight of volume indicators is pointing to a downwards breakout as more likely. This is not definitive and only is indicative. Extreme caution is advised, particularly with any trades to the upside at this stage.
Monday’s upwards movement was completed on increased volume. This may be the start of a new swing upwards, or it may be an indicator of the end of a correction upwards. With Stochastics reaching oversold on Friday, some upwards movement was expected.
If a new trend is developing, then Stochastics will no longer be useful and may remain oversold for much of a downwards trend.
Price is below the 21 day EMA. The two lower trend lines may offer enough resistance for downwards movement to continue from here. The bear Elliott wave count expects a downwards breakout should happen this week and this would fit with the regular TA picture, with the sole exception of ADX not yet confirming a new trend.
This analysis is published about 06:00 p.m. EST.
I bought GDX 16 seconds before close at 17.75. Looking to sell Wednesday.
The downwards movement to todays low fits better as a complete five wave impulse than it does as a three wave zigzag.
The hourly count presented in the bear analysis has a better fit.
GDX was #2 on the Buying on Weakness list – $156M in money flow today. GDXJ was $30M.
I haven’t figured out of this is actual accumulation, short covering, or a mix of both. Either way, a huge volume of block trades on the buy.
Lara how soon this week might gold hit 1182 – 1188 peak zone?
Your target for the bear is 1110. That seems pretty far down.
Might gold drop “very swift and strong” enough to reach that this week?
I answered below. Maybe eight days for 1,110. And three for 1,182 – 1,188, although the A wave could move pretty high before that.
Greek vote is 5 July, sort of implies gold sideways movement until then. Doesn’t more sideways movement favor bulls?
….but the actual payment deadline is in 1.5 hrs. The fact that the Greeks will not make that deadline is already baked into the price. In other words, doesn’t have to go that long.
Subminuette wave x and i may have ended at 1166.82 at 11:01 am.
Possible retrace
1180.64 at 8:36 pm – 1166.82 at 11:01 am x .618 + 1166.82 = 1175.36 target for the bear.
Lara does have hourly bull upper target of 1188 for minuette wave (b) sometime this week.
Any counts? or any opinions on upper retrace target?
I ALMOST sold my USLV this morning….very nice bounce here.
Good for you.
I’d be nervous in a 3x Bull this week.
I may buy DUST at the gold peak today.
Not sure of retrace target as unsure if the bear or bull hourly is playing out.
Lara warns about bullish trades use absolute extreme caution this week.
Best of timing and profitable trading to you.
JDST doing much better than DUST. Yay.
GDXJ is more volatile than GDX usually. So when you make a good buy then JDST often outperforms DUST.
Since the markets are so volatile, it may be useful to do intraday trading of the bigger swings as good profits 1 minute then wait a couple of hours and big losses.
For the bull, 1166.82 is subminuette x.
Minuette B is an expanded flat.
Subminuette y may be targeting Lara’s 1188 to avoid a truncation (which would occur below 1187.61).
For the bear, 1166.82 is submicro b.
Similarly, the wave one degree higher, micro 2, is an expanded flat.
Submicro c may be targeting 1182-1183. In any case, it has to exceed 1180.84 to avoid a truncation.
This movement is evident by the strong bounce which has not ended yet. When the zenith is reached, the bull will drop to 1168 and the bear considerably lower. I am going to buy DUST at the height.
Tham, thanks for the wave count and target clarity.
Sounds like a good strategy. I’ll do the same. DUST may be at a two day low then. DUST dropped quickly from 18.52 at 11:06 am down to 17.42 at 12:16 pm when gold moved up for 1 hour.
Bull target range above 1187.61 Lara target 1188.
Hourly invalidation above 1205.89.
Bear target above 1180.84, target 1182-1183.
Hourly Invalidation above 1188.16.
Tham: should submicro c unfold as a 3 or a 5?
It should unfold as a five. For the current wave it may not have a nice look though. The first wave looks to be too long. Let’s see what Lara has to say.
Thanks. I don’t think the targets work with a 5 count up.
Fencepost feels the bullish worms crawling out of the wood. Here is the bull case as best I can make it:
lara has allowed that minuette (b) could have ended at 1188 on June 28. We would then look for the third wave of the zigzag down which would be minuette (c). There is the question of what degree to label yesterday’s and today’s action, but if we label yesterday’s leading diagonal as subminuette (i), then it is possible to see minuette (c) of that zigzag as over at 1167. However, it is also possible minuette (c) is not over and we are still in subminuette (iv) or (v) of it. In that case, the amount of overlap means we have to consider whether minuette (c) is an ending diagonal. No doubt Lara will straighten me out on this.
One consideration in my mind is that minuette (c) cannot go below 1162.80 and so we cannot have minuette (c) look impulsive and take a long time and stay above 1162.80.
For the idea on the hourly bull it should take about three days of sideways movement. The A wave (if its a regular flat) could be a significant bounce up and that should happen within the next 24 hours, it could get close to 1,188.
For the idea on the hourly bear (and for the bear count in general) the target at 1,110 may be about eight days / sessions away.
Lara was right about it being risky to be bullish.
Miners have been digging a deeper hole since Monday morning.
11:01 am today gold dropped $3 in 1 minute.
US dollar up .5% since the open.
Bears (like myself) also need to be patient and not become over confident….not yet, at least. Seems Lara’s hourly bull count, which works for the daily bear count, is the winner. That is, unless there is something to the 1-2, 1-2 idea which Lara briefly mentioned in yesterday’s comments. However, considering the velocity of that last shot up from the low, I don’t think it has the traits of a 2nd (or 4th) wave that came after a somewhat slower down move.
I am quite confident in the bear and am fully loaded in JDST.
I am too. Am only holding longer term short positions. However, I don’t feel like ‘betting the farm’ until 1162 is breached. I trade futures, so I really have to be careful.
Looks to me like this is 1 of 3 down. Expect a small bounce In 2 and a massive gave down over 1162 once EU settles Greece.
Thank you Patrick: Will wait and watch~!
Anyone has an idea where downside is expected to end>>1168.10>>1167.10>>1163.48>>1162.10? Or is the downside done already? Thanks~!! And the next move would expected to be up? As yet, don’t see much beyond 1173-75 with 1180-81 on the outside….
Rambus sees a strong move down in the miners (public post)
http://rambus1.com/?p=39860
BitGold – new site to buy/sell/store and use Gold as a currency.
https://www.bitgold.com
Did you hear about it from Zerohedge?
No.
http://www.safehaven.com/article/38107/move-over-bitcoin-and-paypal-bitgold-is-here
This gold market sure is looking weak. I sold some longs on Friday and today. I am expecting weakness again tomorrow due to quarter end. Miners are oversold, but that doesn’t mean they can’t keep moving that way like in early March.
Silver is not moving up like I anticipated, my USLV position is small, I will probably keep it for a few more days yet…so many MM shorts on the COT.
Gold open interest is still climbing. 444,000 futures contracts now.
Lara, I’d like to know how you counted a 5 for orange C in your hourly bear wave count.
Thank you,
Jaf
Sometimes Gold has quick fourth wave corrections, this makes it’s impulses look like threes on a higher time frame.
This chart is the one minute. You have to go down to that time frame to see the subdivisions.
Off topic – a couple of weeks ago, there was some VIX discussion. Look at the huge move in UVXY today!
Yes, sometimes counting waves fails we should rely on Jedi sense. I have watched and watched VIX, it was low and all my instincts said “Greece = volatility coming” but alas I did not pull the trigger and buy volatility. My mistake, my zero gain.