
It was expected to be most likely that downwards movement would continue, which is what has happened.
Price moved lower to complete a red candlestick.
Summary: The bull and bear wave counts now diverge strongly: the bear wave count now expects a strong third wave to move down and the bull wave count now expects a third wave up to begin. In the short term, a new high above 1,205.89 would favour the bull wave count, but it needs confirmation above 1,232.49. The bear wave count is preferred, supported again by volume, and a new low below 1,162.80 would favour it. Warning: the bear wave count expects the middle of an intermediate degree third wave down which may be surprisingly swift and strong.
To see the bigger picture and weekly charts go here.
Changes to last analysis are italicised.
Bull Wave Count
Click chart to enlarge.
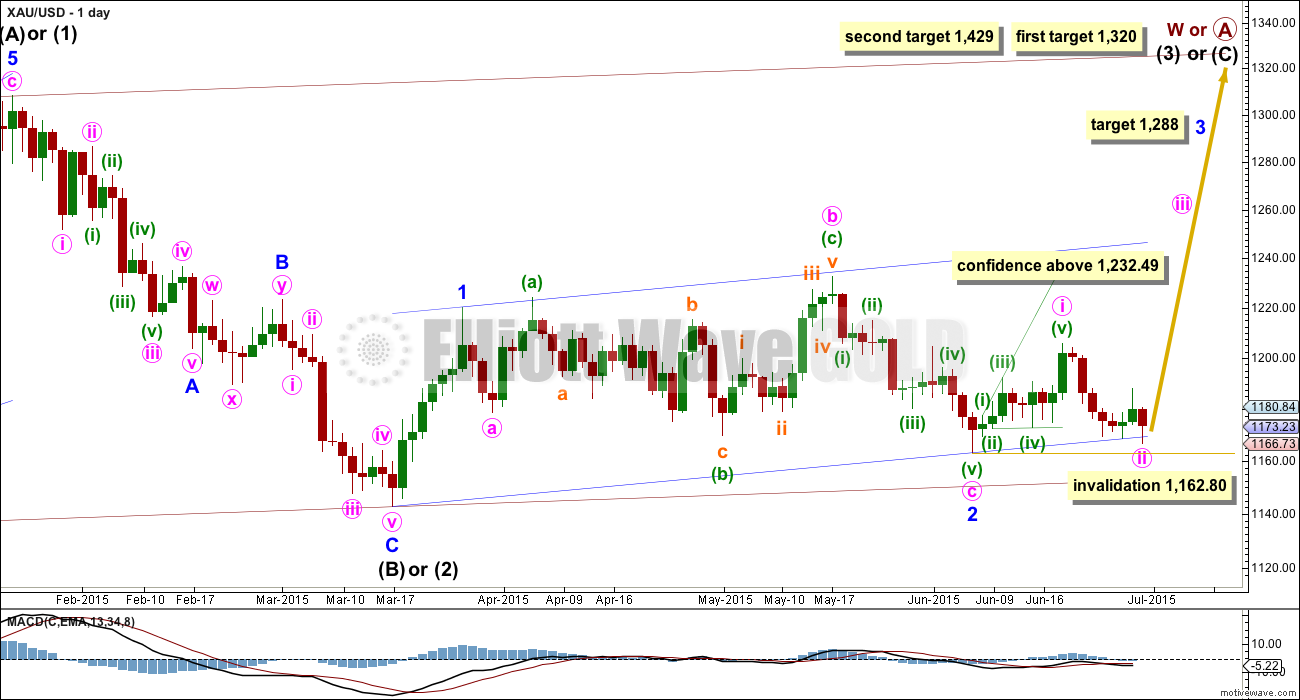
The bull wave count sees primary wave 5 and so cycle wave a a complete five wave impulse on the weekly chart.
Pros:
1. The size of the upwards move labelled here intermediate wave (A) looks right for a new bull trend at the weekly chart level.
2. The downwards wave labelled intermediate wave (B) looks best as a three.
3. The small breach of the channel about cycle wave a on the weekly chart would be the first indication that cycle wave a is over and cycle wave b has begun.
Cons:
1. Within intermediate wave (3) of primary wave 5 (now off to the left of this chart), to see this as a five wave impulse requires either gross disproportion and lack of alternation between minor waves 2 and 4 or a very rare running flat which does not subdivide well. I have tried to see a solution for this movement, and no matter what variation I try it always has a problem which violates an Elliott wave rule.
2. Intermediate wave (5) of primary wave 5 (now off to the left of the chart) has a count of seven which means either minor wave 3 or 5 looks like a three on the daily chart.
3. Expanding leading diagonals (of which intermediate wave (A) or (1) is) are are not very common (the contracting variety is more common). There is also now a second expanding leading diagonal for minute wave i.
4. Volume does not support this bull wave count.
For volume to clearly support the bull wave count it needs to show an increase beyond 187.34K (30th April) and preferably beyond 230.3K (9th April) for an up day. Only then would volume more clearly indicate a bullish breakout is more likely than a bearish breakout.
Within cycle wave b, primary wave A may be either a three or a five wave structure. So far within cycle wave b there is a 5-3 and an incomplete 5 up. This may be intermediate waves (A)-(B)-(C) for a zigzag for primary wave A, or may also be intermediate waves (1)-(2)-(3) for an impulse for primary wave A. At 1,320 intermediate wave (C) would reach equality in length with intermediate wave (A) and primary wave A would most likely be a zigzag. At 1,429 intermediate wave (3) would reach 1.618 the length of intermediate wave (1) and primary wave A would most likely be an incomplete impulse.
Intermediate wave (A) subdivides only as a five. I cannot see a solution where this movement subdivides as a three and meets all Elliott wave rules (with the sole exception of a very rare triple zigzag which does not look right). This means that intermediate wave (B) may not move beyond the start of intermediate wave (A) below 1,131.09. That is why 1,131.09 is final confirmation for the bear wave count at the daily and weekly chart level.
Intermediate wave (C) is likely to subdivide as an impulse to exhibit structural alternation with the leading diagonal of intermediate wave (A). This intermediate wave up may be intermediate wave (3) which may only subdivide as an impulse.
Minor wave 2 is over here. Minute wave c is just 2.7 longer than 1.618 the length of minute wave a. At 1,288 minor wave 3 would reach 1.618 the length of minor wave 1.
Within minor wave 3, no second wave correction may move beyond its start below 1,162.80.
A new high above 1,232.49 would eliminate the bear wave count and provide full confidence in the targets.
Hourly Bull Wave Count
Click chart to enlarge.
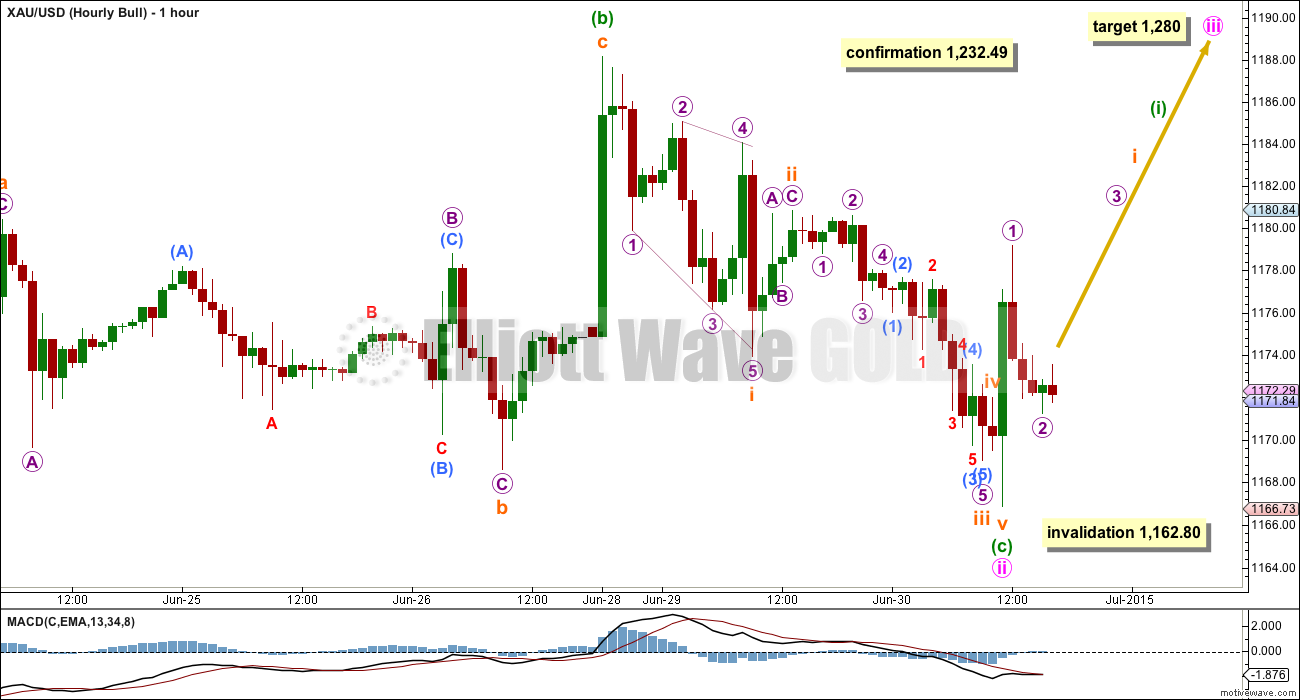
Downwards movement for Tuesday does not fit as well as a three and fits best as a completed five wave impulse. Because minute wave ii now looks like a complete three wave zigzag on the daily chart for the bull wave count, it is very likely that minute wave ii is over here. There is no Fibonacci ratio between minuette waves (a) and (c).
At 1,280 minute wave iii would reach 2.618 the length of minute wave i. For the bull wave count this target may be met in about a month, and there will be more corrections along the way up which will show up at the daily chart level.
In the first instance, a new high above 1,205.89 would provide some confidence in the bull wave count, but it would still need a new high above 1,232.49 for full confidence in the targets.
Bear Wave Count
Click chart to enlarge.
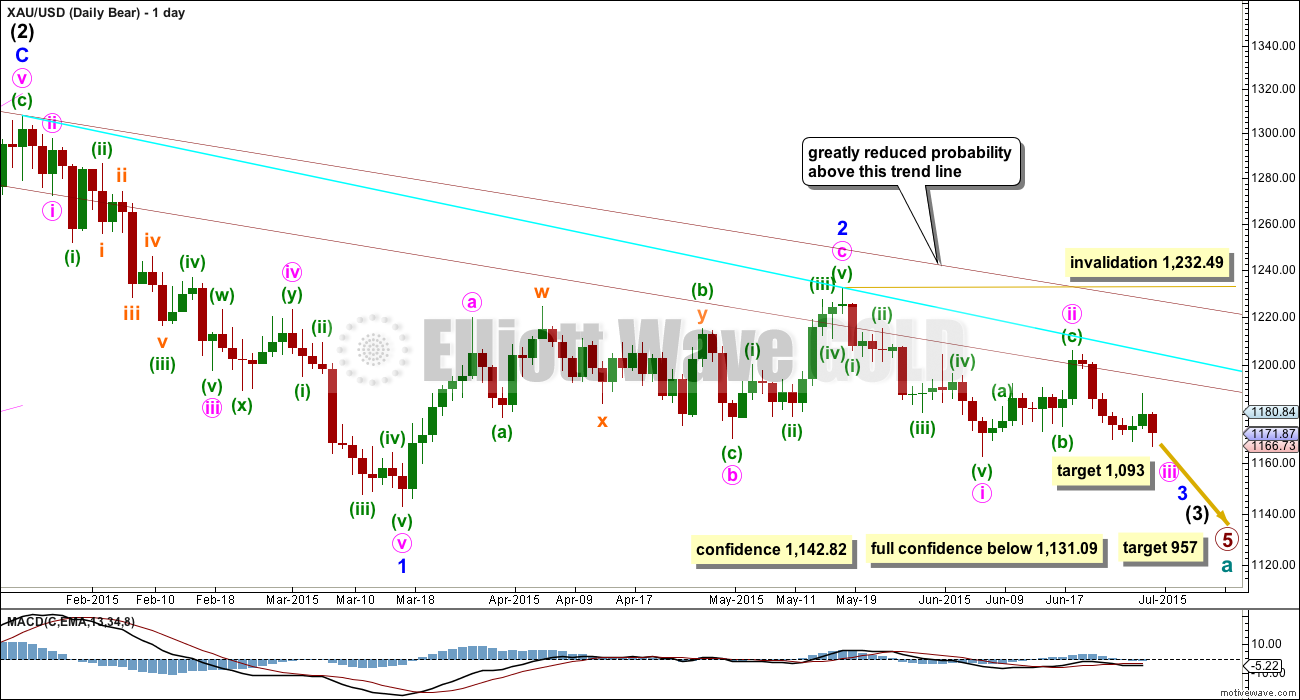
This wave count follows the bear weekly count which sees primary wave 5 within cycle wave a as incomplete. At 957 primary wave 5 would reach equality in length with primary wave 1.
Pros:
1. Intermediate wave (1) (to the left of this chart) subdivides perfectly as a five wave impulse with good Fibonacci ratios in price and time. There is perfect alternation and proportion between minor waves 2 and 4. For this piece of movement, the bear wave count has a much better fit than the bull wave count.
2. Intermediate wave (2) is a very common expanded flat correction. This sees minor wave C an ending expanding diagonal which is more common than a leading expanding diagonal.
3. Minor wave B within the expanded flat subdivides perfectly as a zigzag.
4. Volume at the weekly and daily chart continues to favour the bear wave count. Since price entered the sideways movement on 27th March it is a downwards week which has strongest volume, and it is downwards days which have strongest volume, five of them.
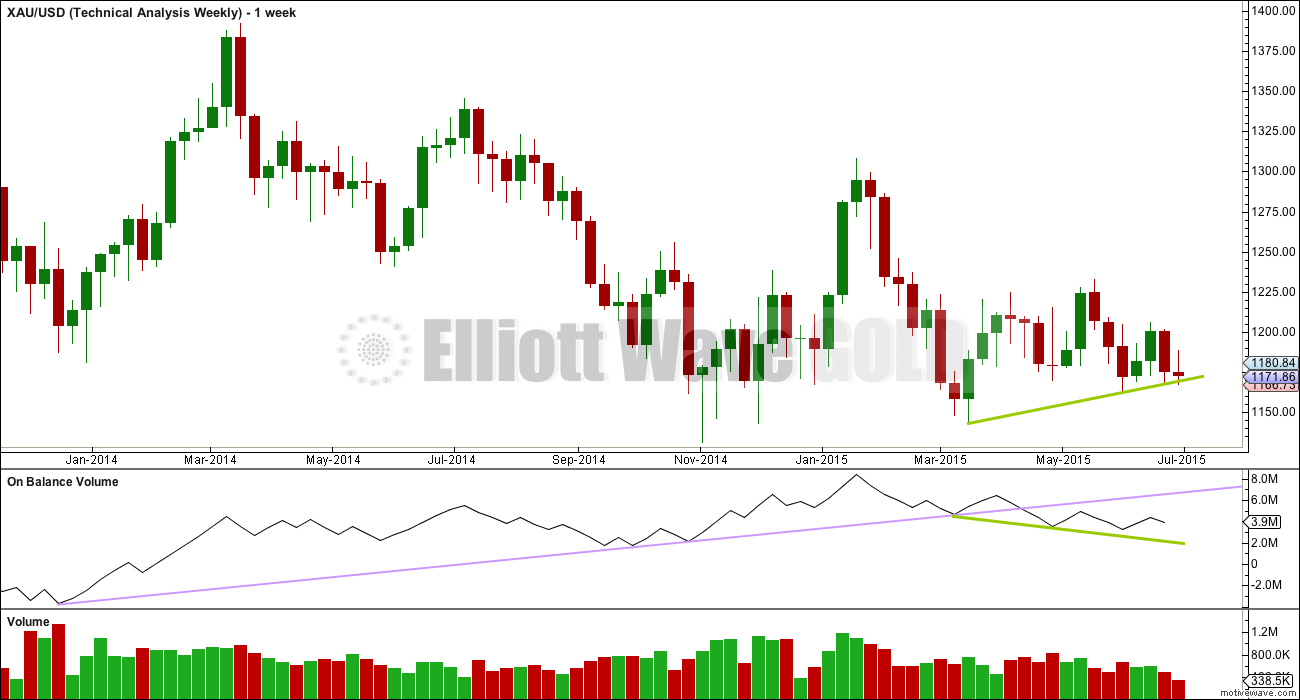
5. On Balance Volume on the weekly chart breached a trend line from back to December 2013. This is another bearish indicator.
Cons:
1. Intermediate wave (2) looks too big on the weekly chart.
2. Intermediate wave (2) has breached the channel from the weekly chart which contains cycle wave a.
3. Minor wave 2 is much longer in duration than a minor degree correction within an intermediate impulse normally is for Gold. Normally a minor degree second wave within a third wave should last only about 20 days maximum. This one is 44 days long.
4. Within minor wave 1 down, there is gross disproportion between minute waves iv and ii: minute wave iv is more than 13 times the duration of minute wave i, giving this downwards wave a three wave look.
Minor waves 1 and 2 are complete. Minute wave i within minor wave 3 may be incomplete on the hourly chart.
Minute wave ii may not move beyond the start of minute wave i above 1,232.49.
At this stage, a new low below 1,162.80 would provide a lot of confidence in the bear wave count. Further confidence would come with a new low below 1,142.82 and final confidence would come only with a new low below 1,131.09.
Minute wave ii is now very likely to be over here. If it moves any higher, then it should find strong resistance at the blue trend line.
Tuesday’s session completed with high volume for a down day, higher than the prior up day of Monday. This is again another strong indicator from volume that the breakout may be more likely down, which strongly supports this bear wave count.
Hourly Bear Wave Count
Click chart to enlarge.
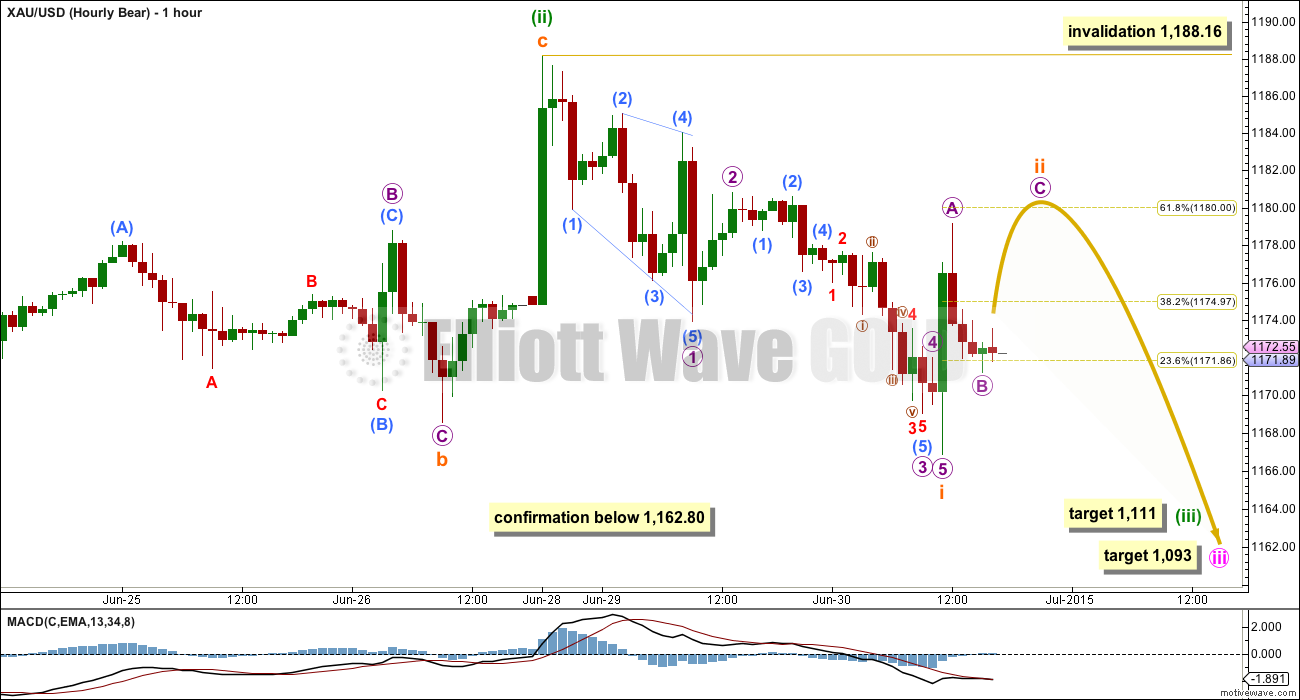
The bear wave count now sees minuette wave (ii) also as most likely complete.
The middle of intermediate wave (3) is fast approaching, would now be quite close, should be beginning to exert a strong downwards pull, and momentum downwards may increase strongly over the next few days.
At 1,111 minuette wave (iii) would reach 2.618 the length of minuette wave (i). Along the way down, it is quite likely that subminuette waves ii and iv will show up on the daily chart as at least one green candlestick or doji each (it is common for the middle of Gold’s third waves to show their subdivisions very clearly).
Gold often exhibits a pattern of swift strong fifth waves to end the middle of its third waves. Within minuette wave (iii), it may be that subminuette wave v is swift, strong and extended so a very strong increase in momentum may be seen there, which may mean that the strongest piece of downwards movement is yet a couple of weeks away. The third wave for subminuette wave iii should still be quite strong and that is closer.
Subminuette wave ii may not move beyond the start of subminuette wave i above 1,188.16.
At 1,093 minute wave iii would reach 1.618 the length of minute wave i.
A new high above 1,188.16, in the short term, is not such a problem for the bear wave count. It would mean that minuette wave (ii) was not over and may be drifting sideways as a double flat or double combination. This has a low probability, but it is technically possible.
Technical Analysis
Click chart to enlarge.
Weekly Chart: Overall volume still favours a downwards breakout eventually. During this sideways movement, it is still down days and a down week which have higher volume. On Balance Volume breaches a trend line (lilac line) which began in December 2013, and the breach is significant.
While price has made higher lows, On Balance Volume has made lower lows (green trend lines). This small rise in price is not supported by volume, and it is suspicious.
At the weekly chart level, volume is strongest in a down week. Overall volume is declining, typical of a maturing consolidation. Each series of down weeks includes a week with stronger volume than the following series of up weeks. The breakout should come very soon now and volume indicates a downwards breakout is more likely than upwards.
Click chart to enlarge.
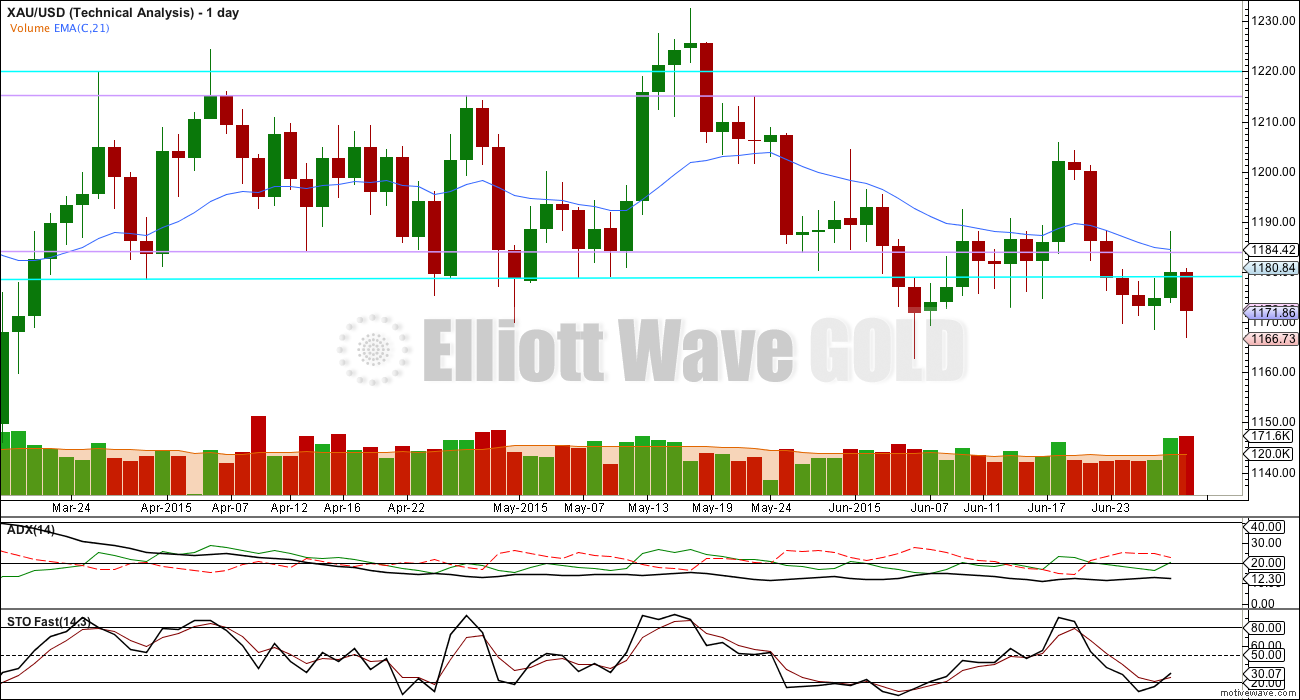
Daily Chart: ADX still indicates there is no clear trend. A range bound trading system would be better employed than a trend following system. Trading in a range bound market, as Gold has been in since the 27th of March, is inherently more risky than trading a trending market. Careful money management rules are essential to avoid wiping out your account. A good rule to follow would be to invest no more than 2% of the equity in your account on any one trade.
The range bound system illustrated here uses horizontal lines of support and resistance along with fast Stochastics to illustrate overbought and oversold. The idea is to expect the end of one swing and the start of another when price is at support or resistance and Stochastics is at oversold or overbought.
Eventually Gold will break out of this range it entered on 27th March; a breakout is 100% certain. What is uncertain is what direction the breakout will be. When the breakout comes, then this range trading system will be expecting a move in the opposite direction and the final swing will never come. Additionally, ADX may be slow to indicate the existence of a trend when it finally arrives, which again illustrates why trading this market is so risky.
Gold has been within this range now for 67 days. The longer price remains in this range the closer the breakout will be and the risker it is to expect the sideways swings to continue.
The weight of volume indicators is pointing to a downwards breakout as more likely. This is not definitive and only is indicative. Extreme caution is advised, particularly with any trades to the upside at this stage. Again, Tuesday has another down day with strong volume. Again volume continues to indicate a downwards breakout is more likely, and it may be beginning now.
If a new trend is developing, then Stochastics will no longer be useful and may remain oversold for much of a downwards trend.
Price is below the 21 day EMA. The two lower trend lines may offer enough resistance for downwards movement to continue from here. The bear Elliott wave count expects a downwards breakout should happen this week and this would fit with the regular TA picture, with the sole exception of ADX not yet confirming a new trend.
This analysis is published about 05:49 p.m. EST.
I’m in agreement with Tham.
This wave down so far looks corrective.
For the bear wave count (slightly favoured due to volume indicators) I think we are seeing subminuette wave ii unfold, it will show up on the daily chart lasting about 2-3 days in total.
I am expecting some upwards movement over the next 24 hours to about 1,180 to complete a small second wave correction.
For the bull wave count it has to move up from here to start a third wave.
If the bear wave count is correct (and volume favours the bear) then any trades to the upside would be against the trend. “The trend is your friend”.
If the bull wave count is correct (and volume says it’s unlikely) this may be the early stage of a third wave. There is plenty of time yet to wait for some confirmation of a third wave up, and with volume not favouring this it would be most wise to wait for bullish confirmation before having confidence in trades to the upside.
Not sure what to make of the action over the past few days
slow grind down and the sharp spikes to the upside
I bought a small quantity of GDX at Thursday’s close. Should of sold it at the first gold high after the open as bearish all day. Sold my GDX a few minutes ago for small loss $120 US. Didn’t want to stay bullish waiting for a bounce as would be risky next several days. Should of just bought DUST as up 6% or JDST up 9.6%.
If the bear wave count is correct then any trades to the upside would be against the trend. Trading against the trend…. often does not end well.
Gold Weaker on Better Investor Risk Appetite and Higher USDX
By Jim Wyckoff of Kitco News
Wednesday July 01, 2015 13:43
http://www.kitco.com/news/2015-07-01/Gold-Weaker-on-Better-Investor-Risk-Appetite-and-Higher-USDX.html
Today oil down, strong US news ADP payroll, gold drops. Gold has morning high at 10:28 as it had intraday high before noon and weak the rest of the afternoon as the miners drop like the last two days.
Thursday 8:30 am US non-farm payroll may be strong like today and send gold down. Sunday Greece vote polls show majority will vote yes which may be bearish on gold.
Any chance of intraday strong move up today in gold for a bounce to 1180 soon is in question.
Gold price upside appears capping 1173-74/77-79 with 1183 on the outside…. Gold price appears to be having a narrow trade range and an inside day so far, usually a potent combination for an impulse move / breakout to occur (possibly large)…. Got to try and figure out which way this could go with downside 1167 / lower band currently holding – certainly would like to see a break below 1163, hasn’t happened yet aarrgghh….
Gold low today 1167.73 at 10:01 then just spiked up to 1173.53 at 10:28 am and dropping since then.
Gold only hit overnight high of 1175.19 at 11:00 pm .
Didn’t reach Lara’s overnight forecast of 1180.
Several US news today has been bearish for gold.
Lara mentioned might see green candlestick for gold today.
I don’t see how?
Any wave counts anyone.
I think that is the first wave in a 5-wave structure up. It should target at least 1180.
Tham, thanks for the wave count and upside potential.
I have a little GDX and will sell today as Thursday Non-farm payroll at 8:30 am
THURSDAY, JULY 2
8:30 am Weekly jobless claims June 27 275,000 271,000
8:30 am Nonfarm payrolls June 225,000 280,000
8:30 am Unemployment rate June 5.4% 5.5%
8:30 am Average hourly earnings June 0.2% 0.3%
10 am Factory orders May -0.5% -0.4%
FRIDAY, JULY 3
None scheduled
Independence Day US Holiday
Thanks Tham
Thank u Tham. This helps.
Darn that spike, stopped me out of my DUST.
Hoping Lara’s count(s) can provide some weight to bearish case. Overall direction sure looks bearish (since 5-18) to un-EW eye.
Appreciate your posts the past few days. Been watching the Greece dealings as well. Hoping to get back in soon– one way or the other. * *
~~
G
Getting impatient here.
Would really love to see a nice 10$ spike down in Gold
to kick things off to the downside
Patience may be well rewarded. I think there may be an opportunity for a little upwards movement to 1,180 in the next 24 hours.
This is typical behaviour of a third wave. They do often start out a little slow, everyone is thinking “but it’s a third wave, why isn’t it accelerating yet?” and give up right before it falls off a cliff.
Look on the daily chart at the last third wave down for Gold. Look at the beginning with those second wave corrections. Even better, go back on the daily chart to February 2013. Look at how primary wave 3 began with so many very clear first and second wave corrections. It wasn’t until the fifth wave within the middle of the third wave that price fell strongly and momentum downwards was really strong.
This final 5th wave up in the $USD could support the bear case in Gold.
http://www.safehaven.com/article/38126/final-rally-in-the-dollar