
Yesterday’s analysis was unclear as to what direction to expect with three different Elliott wave counts with different expectations. A new low below 1,178.08 eliminated one Elliott wave count, now leaving only two which expect the same direction next.
Summary: There is now only one bull and one bear wave count. Both need more downwards movement to complete an impulse which is in its fifth wave. I have two targets: 1,165 and 1,157. The second lower target may be more likely. Any new low below 1,142.82 would confirm the bear wave count and invalidate the bull.
To see the bigger picture and weekly charts go here.
Changes to last analysis are italicised.
Bull Wave Count
Click chart to enlarge.
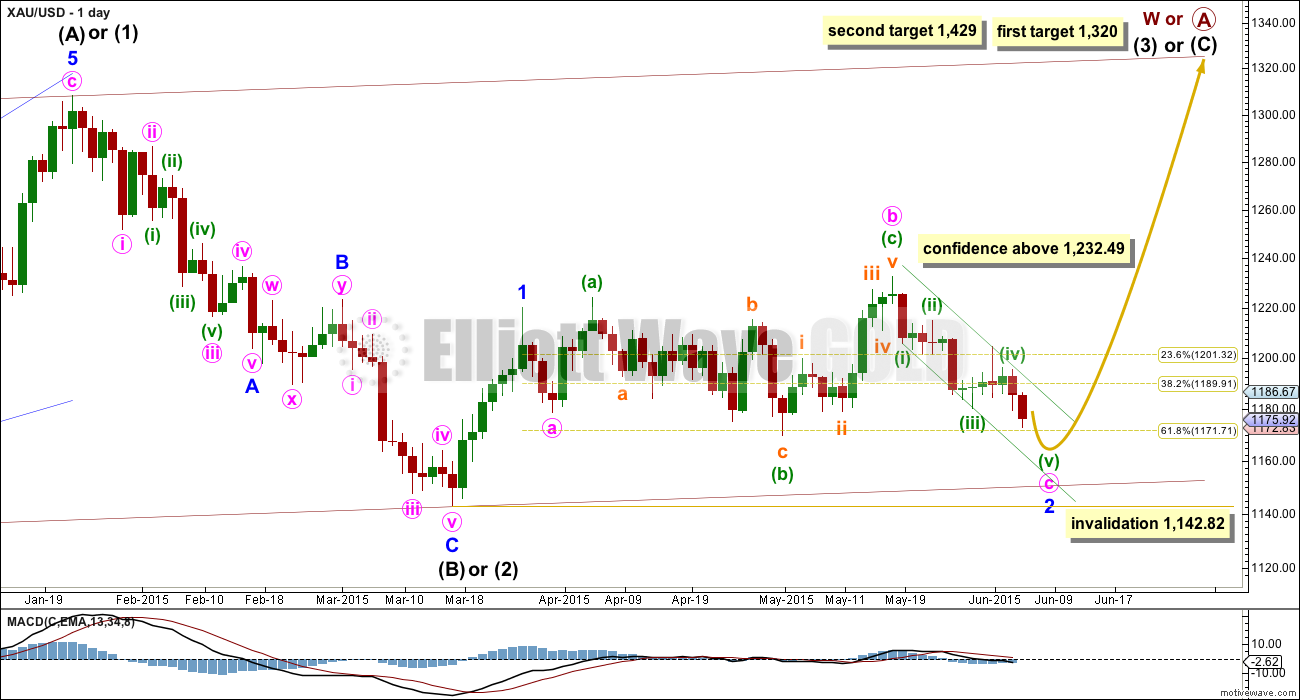
The bull wave count sees primary wave 5 and so cycle wave a a complete five wave impulse on the weekly chart.
Pros:
1. The size of the upwards move labelled here intermediate wave (A) looks right for a new bull trend at the weekly chart level.
2. The downwards wave labelled intermediate wave (B) looks best as a three.
3. The small breach of the channel about cycle wave a on the weekly chart would be the first indication that cycle wave a is over and cycle wave b has begun.
Cons:
1. Within intermediate wave (3) of primary wave 5 (now off to the left of this chart), to see this as a five wave impulse requires either gross disproportion and lack of alternation between minor waves 2 and 4 or a very rare running flat which does not subdivide well. I have tried to see a solution for this movement, and no matter what variation I try it always has a major problem.
2. Intermediate wave (5) of primary wave 5 (now off to the left of the chart) has a count of seven which means either minor wave 3 or 5 looks like a three on the daily chart.
3. Expanding leading diagonals (of which intermediate wave (A) or (1) is) are are not very common (the contracting variety is more common).
4. The possible leading diagonal for minor wave 1 and particularly minute wave ii within it look too large.
For volume to clearly support the bull wave count it needs to show an increase beyond 187.34 (30th April) and preferably beyond 230.3 (9th April). Only then would volume more clearly indicate a bullish breakout is more likely than a bearish breakout.
Within cycle wave b, primary wave A may be either a three or a five wave structure. So far within cycle wave b there is a 5-3 and an incomplete 5 up. This may be intermediate waves (A)-(B)-(C) for a zigzag for primary wave A, or may also be intermediate waves (1)-(2)-(3) for an impulse for primary wave A. At 1,320 intermediate wave (C) would reach equality in length with intermediate wave (A) and primary wave A would most likely be a zigzag. At 1,429 intermediate wave (3) would reach 1.618 the length of intermediate wave (1) and primary wave A would most likely be an incomplete impulse.
Intermediate wave (A) subdivides only as a five. I cannot see a solution where this movement subdivides as a three and meets all Elliott wave rules (with the sole exception of a very rare triple zigzag which does not look right). This means that intermediate wave (B) may not move beyond the start of intermediate wave (A) below 1,131.09. That is why 1,131.09 is final confirmation for the bear wave count at the daily and weekly chart level.
Intermediate wave (C) is likely to subdivide as an impulse to exhibit structural alternation with the leading diagonal of intermediate wave (A). This intermediate wave up may be intermediate wave (3) which may only subdivide as an impulse.
This bull wave count sees minor wave 1 a short brief impulse and minor wave 2 now an incomplete expanded flat correction. Within minor wave 2, minute wave c has now moved below the end of minute wave a at 1,178.59 avoiding a truncation and a very rare running flat.
After completion of minor wave 2, then a new high above 1,232.49 would eliminate the bear wave count and provide full confidence in the targets.
Click chart to enlarge.
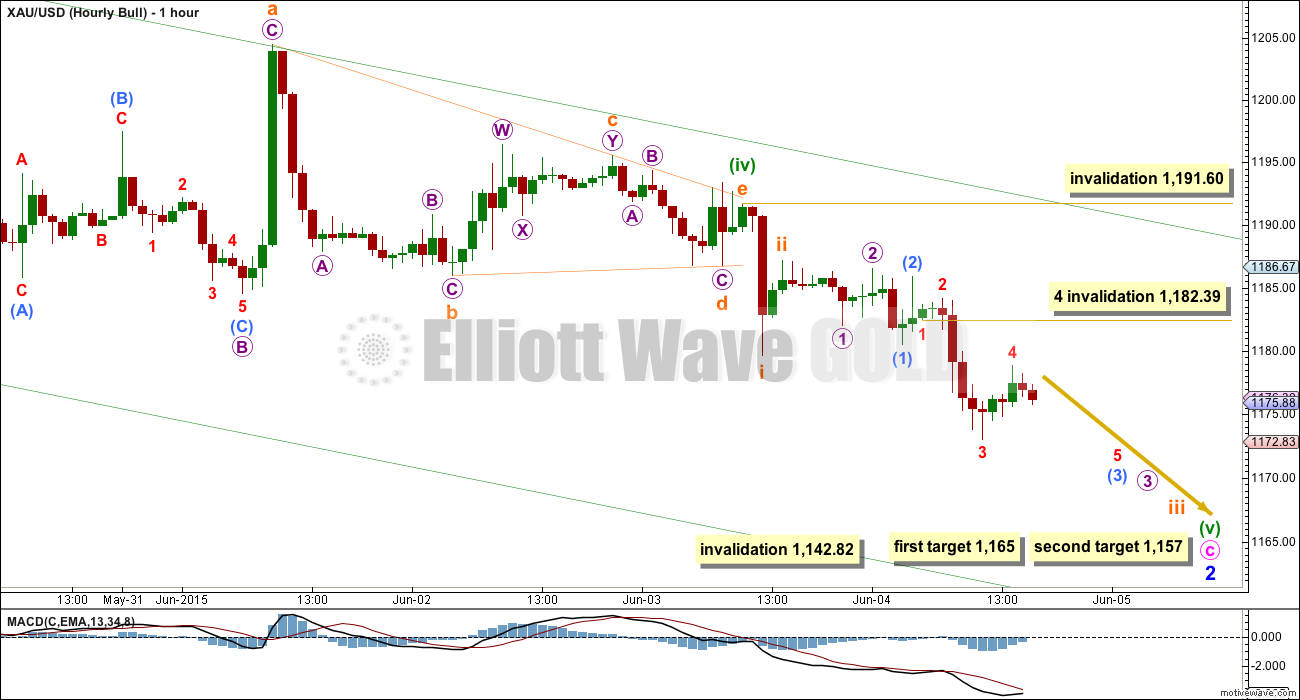
I have spent time today on the five minute chart to see subdivisions within the end of the triangle of minuette wave (iv). It is vital to find out exactly where the triangle ends and the next wave down begins. I have concluded the triangle ended at 1,191.60, and it may even have been a nine wave triangle. This is where minuette wave (v) began.
The triangle looks more like a barrier than a regular contracting triangle because the b-d trend line is essentially flat. Fifth waves following barrier triangles are either very short and brief, or long extensions. This one is incomplete and so it may be a long extension.
At 1,165 minuette wave (v) would reach equality in length with minuette wave (i). Also at 1,165 minuette wave (c) would reach 1.618 the length of minuette wave (a). This first target would see minuette wave (v) relatively short and brief.
At 1,157 minuette wave (v) would reach equality in length with minuette wave (iii). Both minuette waves (iii) and (v) would be extended. Because minuette wave (v) has so far taken two days (two candlesticks on the daily chart) and it is incomplete, this lower target may have a slightly higher probability.
In the very short term a small fourth wave may have just ended. When Gold’s fifth waves extend they often do so as the fifth wave of a third. The next downwards movement could be a swift strong fifth wave to end subminuette wave iii, and may show an increase in downwards momentum.
Minuscule wave 4 may not move into minuscule wave 1 price territory above 1,182.39.
As the structure unfolds downwards, the short term invalidation point will move to each corresponding first wave end; each fourth wave yet to unfold may not move into its counterpart first wave price territory. Submicro wave (1) has its extreme at 1,180.52, micro wave 1 at 1,182.01, and subminuette wave i at 1,179.60.
If the labelling of minuette wave (v) here is wrong and its second wave correction is yet to unfold, then it may not move beyond the start of its first wave above 1,191.60.
Bear Wave Count
Click chart to enlarge.
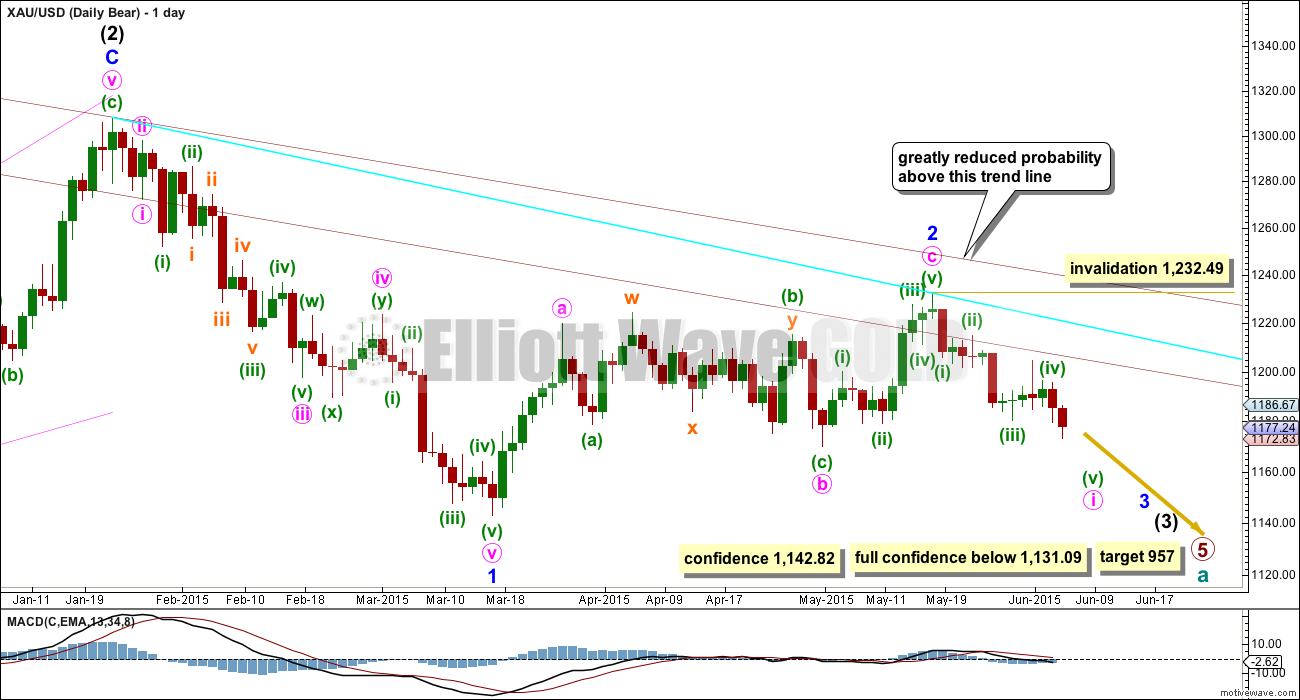
This wave count follows the bear weekly count which sees primary wave 5 within cycle wave a as incomplete. At 957 primary wave 5 would reach equality in length with primary wave 1.
Pros:
1. Intermediate wave (1) (to the left of this chart) subdivides perfectly as a five wave impulse with good Fibonacci ratios in price and time. There is perfect alternation and proportion between minor waves 2 and 4. For this piece of movement, the bear wave count has a much better fit than the bull wave count.
2. Intermediate wave (2) is a very common expanded flat correction. This sees minor wave C an ending expanding diagonal which is more common than a leading expanding diagonal.
3. Minor wave B within the expanded flat subdivides perfectly as a zigzag.
4. Volume at the weekly and daily chart continues to favour the bear wave count. Since price entered the sideways movement on 27th March it is a downwards week which has strongest volume, and it is downwards days which have strongest volume.
5. On Balance Volume on the weekly chart recently breached a trend line from back to December 2013. This is another bearish indicator.
Cons:
1. Intermediate wave (2) looks too big on the weekly chart.
2. Intermediate wave (2) has breached the channel from the weekly chart which contains cycle wave a.
3. Minor wave 2 is much longer in duration than a minor degree correction within an intermediate impulse normally is for Gold. Normally a minor degree second wave within a third wave should last only about 20 days maximum. This one is 44 days long.
4. Within minor wave 1 down, there is gross disproportion between minute waves iv and ii: minute wave iv is more than 13 times the duration of minute wave i, giving this downwards wave a three wave look.
Minor waves 1 and 2 are complete. Minute wave i within minor wave 3 is incomplete on the hourly chart.
Minute wave ii may not move beyond the start of minute wave i above 1,232.49.
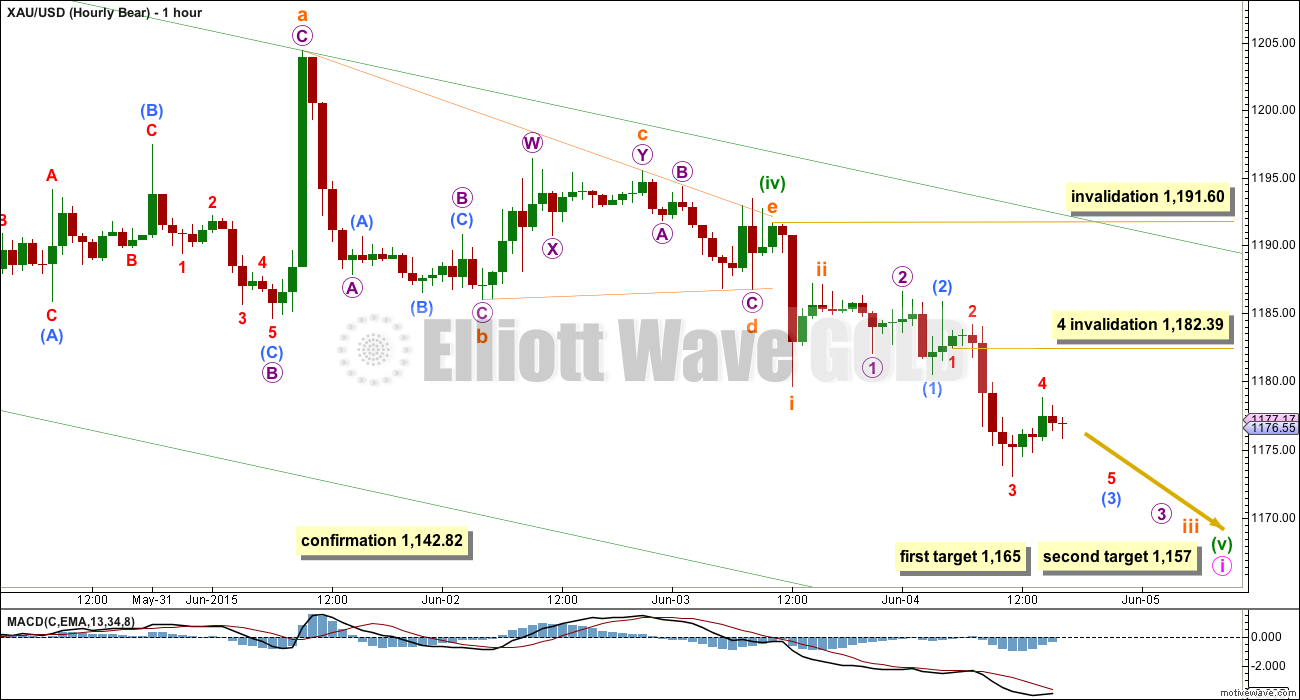
The bull and bear wave counts both see a five wave impulse down incomplete. They do not diverge at this stage.
If this impulse takes price below 1,142.82, then the bull wave count would be invalidated. But only a new low below 1,131.09 would invalidate any variation of a bull wave count and provide full and final confirmation for a bear wave count.
When this five wave impulse is complete, then the bull wave count will expect a third wave up and this bear wave count will expect a second wave correction. At that stage, the bear wave count would be invalidated with a new high above 1,232.49 and the bull wave count would be confirmed.
Click chart to enlarge.
Structures, subdivisions, invalidation points and expectations are the same at this stage for both bull and bear wave counts.
Technical Analysis
Click chart to enlarge.
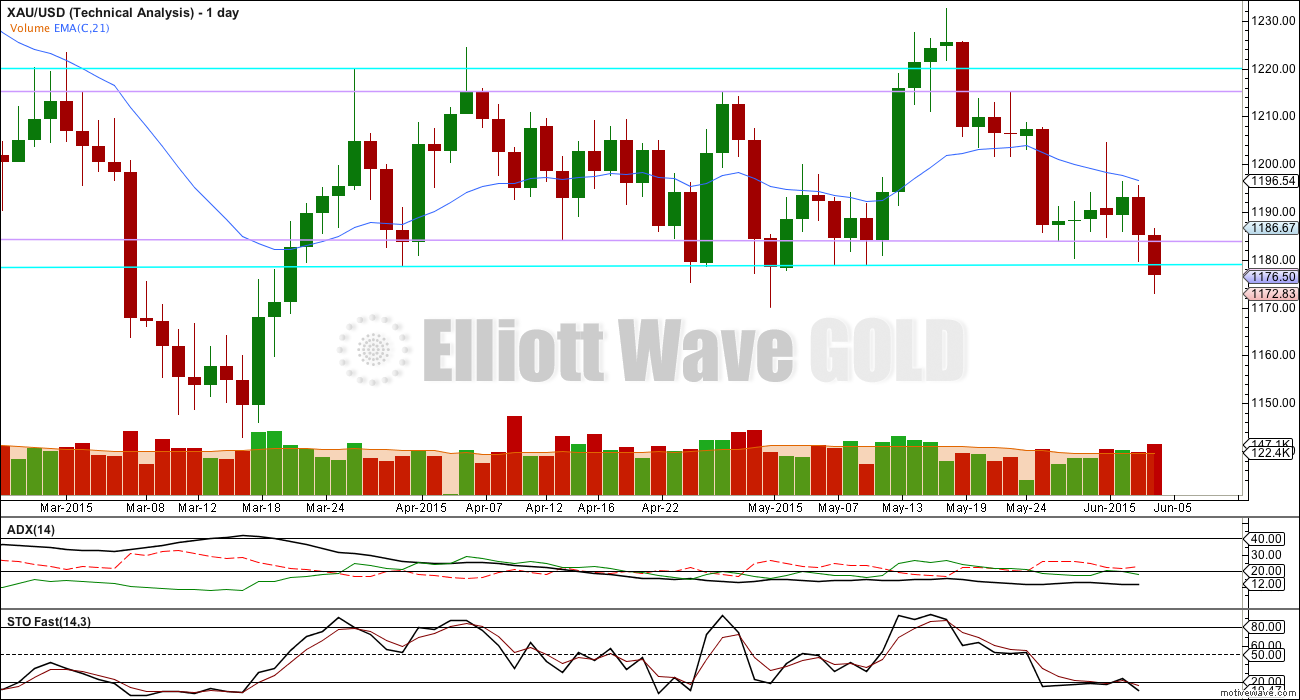
ADX is still below 15 and flat, still indicating no clear trend. Stochastics is still oversold. This approach expects an upwards swing from here, and the higher target of 1,165 for the Elliott wave counts would be favoured as that would see only an overshoot of the lower aqua blue trend line.
If the lower aqua blue trend line is breached by a close of 3% or more of market value, that would indicate a downwards breakout underway. That price point is at 1,143, which is almost the same as the price point of 1,142.82 which differentiates the bull and bear Elliott wave counts.
This traditional TA approach of using Stochastics plus support and resistance expects another upwards swing to begin about here. But an overshoot of the lower trend line is allowed for, and this illustrates the very high risk in trading a sideways moving market. The lower aqua trend line was overshot by 8.65 on 1st May, and it could again be overshot by a similar amount.
Volume is increasing as price is declining over the last seven days. This price decline is supported by volume. This favours the bear wave count.
Overall since price entered the sideways movement on 27th March it remains the downwards days and weeks which have highest volume. This favours the bear wave count.
Only when ADX moves to 15 or higher and is trending upwards would the start of a new trend be indicated.
This analysis is published about 05:45 p.m. EST.
Appreciate Lara and Alan/Thams and Matthias comments today to clarify counts and all questions and comments that help overall.
Lara, several people have posted on Oil page wondering about minor 4 and minor 5 waves status. If I adjust my trendline to a more simple TA trendline it seems that a bounce up is near. Would next week be a good time to update the Oil charts?
I’ll be updating it this weekend.
🙂
Intern ran the COT report this week. Also, GDX is on the top of the BOW list on wsj dot com, $120 million in positive money flow.
Here is GDX # 3 at top of Buying on Weakness Wall Street Journal.
http://www.wsj.com/mdc/public/page/2_3022-mfgppl-moneyflow.html
It turns out (after checking one and five minute charts carefully) that both ideas have truncations. That’s okay. The subdivisions fit. The biggest problem now that I see for the wave count which sees this movement as over is a lack of adequate Fibonacci ratios between subminuette waves i, iii and v. I still think it is more likely we shall see a final fifth wave down. The price point to differentiate the two ideas remains at 1,179.60. A new high above that indicates it’s over and we’re on the next wave up.
Do the two wave counts
OMG delete that comment. My mouse slipped — that is not what I was gonna write – it was a question and then I decided not to aks cause I had my own answer. Sorry bout that!
Eeeek a loose mouse!!!
yes! I had an experience last summer that changed me from a mouse hater (furry ones) to a mouse lover. But these plastic ones, well mines misbehaved already today. 🙂
I will have two counts for the hourly charts. The first sees this move possibly over. The second sees a final fifth wave down to go. The price point to differentiate the two ideas is 1,179.60. A new high above 1,179.60 cannot be a fourth wave correction and so the move should then be over. A new low below today’s low at 1,162.80 would obviously indicate that this wave is continuing lower and the second target would be the same at 1,157. I think it is more likely we shall see more downwards movement because the wave count which sees it over as a couple of truncations, reducing it’s probability.
Have no idea of the wave count in play but 1167-66 appears to be holding with 1172-74 limiting, a break above would likely seek 1187-88….
Syed. You are right. Gold is trading very slowly in a slightly upward movement. I have drawn two converging trend lines on my chart, which should resolve by 3:30 pm. We will then know whether the movement is going to be up or down from there. The high at 1171.66 is barely holding.
Thank you for your input TKL: Lara has also just clarified. Seems like if gold price is to head lower, it would need to break below 1168-64 all over again~!
Lara seems to prefer downward movement.
“1,157. I think it is more likely we shall see more downwards movement because the wave count which sees it over as a couple of truncations, reducing it’s probability.”
Gold did break out of its slow rise just before 3:30 pm. The drop is still very small. What it could mean is that this is subminuette 4 in a 3-wave zigzag. It is now in the c wave, dropping in the 4th subwave before making a new high. So, the final drop would most likely occur early next week.
I just noticed this Alan / Tham comment from way below done maybe at 9:30 am EST.
“I think the downswing is over at 1162.83. Now it is slowly going up. 1162.83 ought to have been the low.”
I think we would be in the 4th wave of subminuette 5 then. Admittedly, I do get lost when counting waves at the smaller levels though. As long as price stays below 1173.10, I will remain short. Tham is better at counting waves, so hopefully he can weigh in soon.
I think his comment below was at 10:46 am.
Alan 2 hours, 58 mins ago
1162.83 ought to have been the low. On the 1-minute chart, fast stochastics made a bullish cross in the oversold region. Both %K and &D lines then moved together above the oversold region. This combination is the TA standard in determining a turn.
I am not too sure of the count myself as there is one large candlestick that I cannot resolve as one or three waves even at the 1-minute level. The low could be at 1162.83 but that could also be the third wave (subminuette 3). The price movement following 1162.83 is only up to the next high at 1171.66. This could either be subminuette 4 or a lower degree first wave of the uptrend. If 1171.66 is subminuette 4, then we are now completing micro 2 of subminuette 5. A drop from here would increase the chances of continuation of the down move towards 1157. A rise from here will favour the upswing of the new upswing. I reckon at this stage we have to be patient to see the price direction. It looks like we may not get a resolution today as movement is now very sluggish and the Bollinger bands are tightening.
To me it looks like gold is in a 4th wave now, with one small 5th wave to go. That should bring gold to around Lara’s 1157 target. That may happen today, or perhaps Monday.
I think you are right, this morning was definitely a 3 of 5.
Matt–what is target for 4th wave top?
The invalidation point would be 1173.10 (or thereabouts depending on your datafeed). The top of the 4th may have already occurred, but that is still to be determined.
Matthias thanks for the wave count. From intraday high of 1171.66 at 11:08 am EST down to 1157 area is almost $15. That is one sweet 5th wave down. Hopefully it gets there or close to it for me to buy GDX cheap as gold may bounce over the weekend? Lara will clarify around $3 pm but that is a long time from now. Come on Gold, dive, dive, dive!
.618 of the difference between today’s high and low was back up at 1172.59 but didn’t reach that high yet or may now or I miscalculated?
Are we in a 5th of a 5th down or 2nd wave up?
Gold bottomed at 1162.83 at 9:29 am. Looked like a 5 wave down. I was expecting that since the bearishness was strong from 830 until the 9:30 open that it would continue but apparently not. One of the indicators I use on TOS fired bearish at 8:30 am and stopped at 9:30 am. I wasn’t ready so didn’t buy GDX yet.
Any count anyone. Could gold drop some more or has it near term bottomed even though Lara preferred the 1157 “this lower target may have a slightly higher probability.”
What is TOS? I do not have in my Stockchart.
TOS is Think or Swim a US Trading platform available for free (for paper trading with real time everything and way over 100 indicators) through TD Ameritrade or TD Waterhouse. TOS is am amazing platform. I get it for free and trade through my broker at a different site. Amazing stuff for free is great. Just download the software for free from their site without ever talking to anyone.
I believe it was the 3rd wave of 5 down.
Silver just went green.
Whew. Price movement sure was in such a great hurry. It had stayed in the 1170s the whole of last night. Suddenly when the employment figure was announced to be much better than expected, price moved very quickly. My best guess is that we are in the final subminuette 5 wave down. When that is over, the next move is up, and it would resolve the bull/bear dichotomy.
Alan you mentioned at 9:05 am today, “My best guess is that we are in the final subminuette 5 wave down.” Would that be of the 3rd or 5th wave? Just to be sure I don’t miss gold’s low for today and near low price on GDX for today.
Hi papudi. S&P could have either a fifth wave to go before the correction, or it has started to correct already. The picture is still not clear yet. I am still deferring to the uptrend unless a trend change is unmistakable. (A trend in place shall not change unless an external force acts upon it: parody of Newton’s First Law of Motion). Once a trend change is in place, that will be the time to go for TVIX, or as Bob recommended, UVXY is a better buy. i will alert you should I decide to go in big time. When price begins to drop, investors are usually cautious and waiting to buy in, hence we don’t see an acceleration yet. It would take a very significant event to trigger the selloff in the S&P. Perhaps a Greek default and exit, accompanied by the domino effect of collapsing other European economies such as Portugal, Spain, Ireland etc would do the trick?
Thanks Bob for the wonderful advice. I will give UVXY a try.
By the way, I.have got to reply here as I cannot reply directly. WordPress does not enable replies beyond the third indentation.
Got it. Good luck. Vix products are tricky to trade, but if you can catch a big move it can be worth it.
Gold near five-week low ahead of US jobs data
http://www.moneycontrol.com/news/commodities/gold-near-five-week-low-aheadus-jobs-data_1400291.html
Richard, it would be most helpful if you could use the link button to post your link. After typing your comment, just click on the right button, paste your link and then name your link. Thanks in advance
8:30 am Friday US non-farm payroll, may be biggest news this week
OPEC Huge oil meeting Friday very important for oil price which effects gold as they tend to go in the same direction. i.e. they both dropped hard this week.
12:30 Fed Dudley speech may also effect US dollar and gold.
Better put on your seat belt for today.
IMF video conference link
6-4-15 IMF ‘Briefing on U.S.’ – Review of Financial Sector Assessment of U.S. [34 min video: http://www.imf.org/external/mmedia/view.aspx?vid=4275676184001%5D Report {FSAP} out July th / 8th – they do every 5 yrs.
…………………………………………………………………………………………
noted in assessment, status of $$ as a currency &
they expect inflation to start rising later in the year but slowly and recommend rate hike better timing early 2016. They note the risks associated w/ raising rates too soon and then reverting, causing deflation, is worse than the disadvantages of delaying rate increase
US $$ 13% constant over appreciation over last 12 mos relative to other currencies, continuation is potential risk; not so far affected US negatively considering OIL price decline – which has benefited other countries namely EURO & Japan
————————————————————————
So, Oil going down is good, $$ is overvalued (means it should go back down) and we won’t see rate hike till early 2016.
AM I reading this right?
…….. And gold should see bullish Primary A up since rate hike not on, according to them till later.
……………………………………………
We’ll see, I’m just learning all this stuff.
I’m sure this will all affect gold,,,,,, and so would a stock market crash! I’m considering buying beef jerky- the hard asset for my financial security. Good nite all, Happy Trading 🙂
Hi dsprospering. This is my analysis of USD. From EW persoective, USD index is now dropping in a second wave. It could correct a bit more but it is now encountering a cluster of support from 94.96 to 94.88. If it can bounce off 94.88 in a sustained manner, the upmove is underway. If it falls below 94.82, the strong support is at 93.16. Thereafter, it should rise again. So in the longer term, USD is still very much bullish. With its inverse correlation with gold, gold is more likely to be bearish. Also, oil is reaching the top of its fourth wave up and I’m expecting a large drop from there in its fifth wave (which is very common in commodities). Oil leads gold prices, so gold is also more likely to fall in tandem. The OPEC meeting today (technically now is Friday as it is already past 1 am) with Saudi ruling the roost may precipitate that drop in oil prices. They have said that they are comfortable with lower oil prices. Politically (quarrel with Iran because they are of opposing Muslim factions) and economically (to strongly establish their market pole position), they want lower prices.
As always, thank your for your comments. Personally I just do not see the ‘bullish’ argument for the USD looking back over the last 30+ yrs. Looks like we’re at a top like the Oct 2000 – May 2002, but them I’m not doing any hard analysis, just looking at a chart………………………………I’m learning so much from all of you. Reading your input and soaking things up like a sponge. The interconnectedness of money is really something to behold……………….So as I digress to today’s trade question, do you think gold has hit its subminuette v bottom, or is the 1157 target in play? Thanks Tham.
Like you said, replies could not be made after the third indentation, so I’ll answer the question here. Yes, I think the downswing is over at 1162.83. Now it is slowly going up. As usual, I’ll wait until the first two small waves are over before entering a trade. It is safer that way. Once the second wave does not drop below the first wave, that indicates a new trend. If the second drops below the first, then the old trend is still underway.
Miners are still hanging in there and silver is performing slightly better than gold. I think we are close to a turn here like Lara’s targets suggest, and yours as well.
1162.83 ought to have been the low. On the 1-minute chart, fast stochastics made a bullish cross in the oversold region. Both %K and &D lines then moved together above the oversold region. This combination is the TA standard in determining a turn.
Tham, welcome back. I was out most of they day today, I still like the fact that the miners aren’t as weak as they maybe could be, GDXJ is only down 2% for the week. if gold completes this fifth wave down tomorrow during the day, the miners could take a big hit, but my average is in the 19’s on JNUG so I’ll be holding since we are so close to the targets at this point. Also, my strategy has been to hold my position and not try to trade all the waves because I missed the big wave up from 1142. So this is a test strategy here and I’ll do some reflecting on what I could do different on the next swing. FYI, I’m not just watching the dollar moves, but the bond yields too. Tomorrows cot should be interesting.
Thanks Ben. Tomorrow will be a market-mover. There are some big events which should drive social mood and hence EW price movements. I’m watching the NFP report at 0830 as well as Dudley’s speech at 1230 in which he may probably provide some clues as to the probability of a rate hike in September vis-a-vis December. He is seen to be very closely aligned to Yellen, and investors will hang onto his every word. OPEC meeting in Vienna would also hold future directions for oil (oil was down by more than 1% today in anticipation of the outcome of this meeting as investors are apprehensive about Saudi’s shenanigans). Oil is usually seen as the leader of the commodities market, and its movements could affect gold. S&P is also at a crossroads as it slid below its 50 dma today. It badly needs to rise tomorrow or else the bears may find renewed vigour. Coming back to gold; it is still moving quite slowly. The bigger moves may appear tomorrow. From EW perspective, prices should move down. Coupled with the expectation of a rebound in the S&P, this is the setting for a larger than consensus employment figure. But, if employment figures are lower, then it may disturb the price movement and it may be back to reworking the wave count. All these make for quick gains/losses and is a dream for swing trading. You are right in monitoring the bond yields. That will be the largest mover tomorrow. They are already too high and Fed may be getting nervous. And when they do so, somehow the manipulators will bring the yield down. This could drive investors back to cash or the equities market. I love your strategy. I position myself at the beginning of a big move, whether up or down, and also trade guerilla-fashion in swing trades, using small positions with tight stops. I only increase the position size for third waves and shun the slower fourth/second waves. This methodology does not make for really high gains but is quite cosy. The big gains come from daring swing trades using options or better still CFDs. I haven’t progressed to that stage yet as I’m still relatively new in trading. Each of us will eventualky work out the best trading strategy for ourselves. I wish you hefty gains in whatever approach you decide to use.
By the way, my biggest future anticipated move is in a larger correction of the S&P. TVIX is going to be a steal at its current sub-0.90 pricing. Should it move up to 2.00, it is a doubling of your money. I expect it to happen fast as investors are poised for a quick correction although the trend is still up. Of course, if the correction is entrenched, you can plainly see the gain potential — TVIX to 3, 4, 5 … It used to hover around 3-4 for a while before the current drop, and even reached close to 10 on the last big correction to the 1800/1700.
Alan —— Welcome back. When is the good time to trade TVIX? —
Tham, you may want to use UVXY instead of TVIX. TVIX had issues back in 2012 that caused trust issues with Credit Suisse. Just google “TVIX vs UVXY” and a bunch of articles will pop up. UVXY has higher volume also.
From AVi Gilbert — While there is much to suggest that we are still going higher from here in a larger corrective rally, the evidence is not strong enough for me to maintain a strong bullish expectation over the next few weeks. So, for now, I am simply going to allow the market to provide more clues as to its next larger degree move. —–Read More
Simple Strategy :
Pendulum Strategy
—————————————–
(approximately a 5 to 9 week trading strategy) EXAMPLE (Accumulate shares of DUST/NUGT when down more than 54.8% (average) from it’s recent top. Ride DUST/NUGT until the opposite ETF is down plus 54.8%% and begin accumulating the opposite ETF) Rinse and repeat … However ease in as 82% down is an outlier and possible.
Remember, true pendulum reversals more than not begin with an unmistakable drop that leaves little doubt. Let’s just say a 7 on the Richter scale or higher … Currently positioned in DUST. Target to sell DUST is when NUGT drops below 6.41 and begin accumulating NUGT. Up 36% in DUST!!
I’m glad I sold my GDX Wed afternoon at gold crash almost at break even. I just thought so many charts 5 out of 6 invalidated and the alternate bearish only one valid, was an ominous bearish sign. Now Lara prefers 1157 target. I’ll be buying GDX much cheaper now. Today’s forecast, “I have two targets: 1,165 and 1,157. The second lower target may be more likely.”
Perhaps Friday 8:30 am US non-farm payroll may be strong and boost the US dollar and push down gold??? Curious when 1157 may be hit?