
Downwards movement was expected. The first target at 1,165 was met and exceeded by 2.2.
Summary: It is more likely this downwards wave is incomplete. Confirmation would come with a new low below 1,162.80, with the target at 1,157. Alternatively, it is possible this downwards wave is over now. A new high above 1,179.60 would confirm an end to this downwards movement and the early stage of the next wave up.
To see the bigger picture and weekly charts go here.
Changes to last analysis are italicised.
Bull Wave Count
Click chart to enlarge.
The bull wave count sees primary wave 5 and so cycle wave a a complete five wave impulse on the weekly chart.
Pros:
1. The size of the upwards move labelled here intermediate wave (A) looks right for a new bull trend at the weekly chart level.
2. The downwards wave labelled intermediate wave (B) looks best as a three.
3. The small breach of the channel about cycle wave a on the weekly chart would be the first indication that cycle wave a is over and cycle wave b has begun.
Cons:
1. Within intermediate wave (3) of primary wave 5 (now off to the left of this chart), to see this as a five wave impulse requires either gross disproportion and lack of alternation between minor waves 2 and 4 or a very rare running flat which does not subdivide well. I have tried to see a solution for this movement, and no matter what variation I try it always has a major problem.
2. Intermediate wave (5) of primary wave 5 (now off to the left of the chart) has a count of seven which means either minor wave 3 or 5 looks like a three on the daily chart.
3. Expanding leading diagonals (of which intermediate wave (A) or (1) is) are are not very common (the contracting variety is more common).
4. The possible leading diagonal for minor wave 1 and particularly minute wave ii within it look too large.
For volume to clearly support the bull wave count it needs to show an increase beyond 187.34 (30th April) and preferably beyond 230.3 (9th April) for an up day. Only then would volume more clearly indicate a bullish breakout is more likely than a bearish breakout.
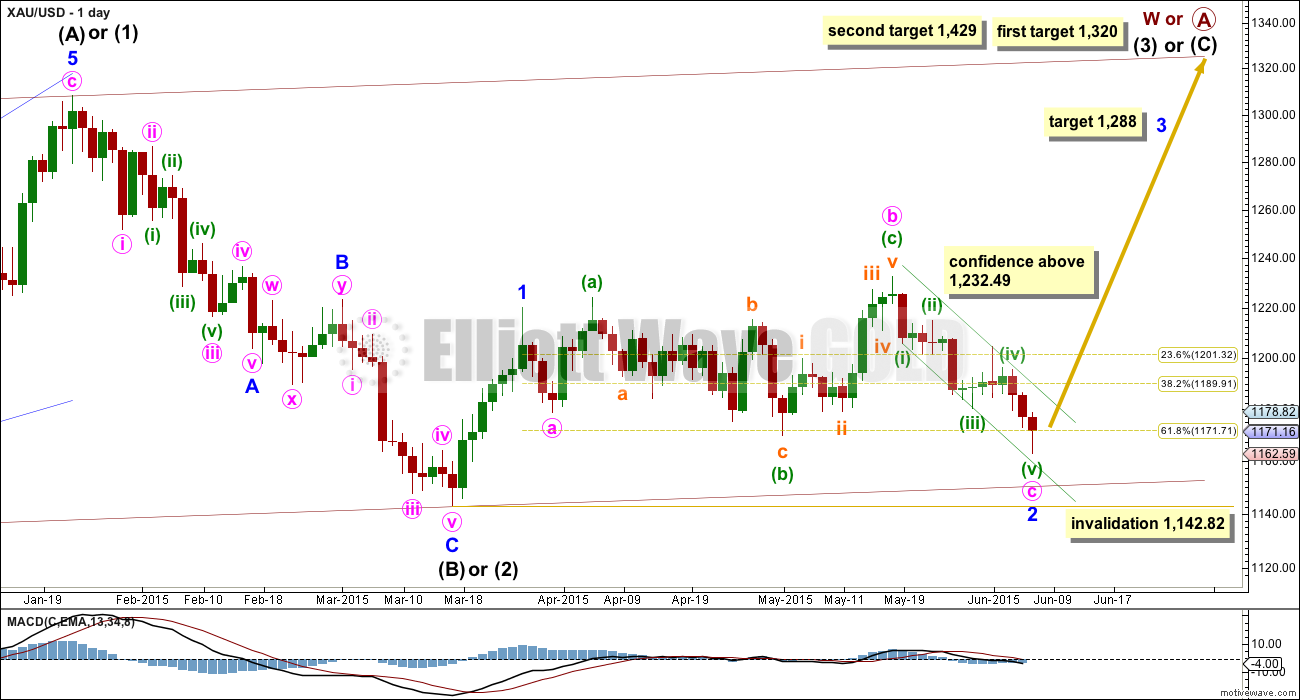
Within cycle wave b, primary wave A may be either a three or a five wave structure. So far within cycle wave b there is a 5-3 and an incomplete 5 up. This may be intermediate waves (A)-(B)-(C) for a zigzag for primary wave A, or may also be intermediate waves (1)-(2)-(3) for an impulse for primary wave A. At 1,320 intermediate wave (C) would reach equality in length with intermediate wave (A) and primary wave A would most likely be a zigzag. At 1,429 intermediate wave (3) would reach 1.618 the length of intermediate wave (1) and primary wave A would most likely be an incomplete impulse.
Intermediate wave (A) subdivides only as a five. I cannot see a solution where this movement subdivides as a three and meets all Elliott wave rules (with the sole exception of a very rare triple zigzag which does not look right). This means that intermediate wave (B) may not move beyond the start of intermediate wave (A) below 1,131.09. That is why 1,131.09 is final confirmation for the bear wave count at the daily and weekly chart level.
Intermediate wave (C) is likely to subdivide as an impulse to exhibit structural alternation with the leading diagonal of intermediate wave (A). This intermediate wave up may be intermediate wave (3) which may only subdivide as an impulse.
This bull wave count sees minor wave 1 a short brief impulse and minor wave 2 now an expanded flat correction. Within minor wave 2, minute wave c has now moved below the end of minute wave a at 1,178.59 avoiding a truncation and a very rare running flat.
It is possible that minor wave 2 is over here. If it is, then minute wave c is just 2.7 longer than 1.618 the length of minute wave a. At 1,288 minor wave 3 would reach 1.618 the length of minor wave 1. If minor wave 2 moves lower, this target must also move correspondingly lower.
Minor wave 2 may not move beyond the start of minor wave 1 below 1,142.82.
After completion of minor wave 2, then a new high above 1,232.49 would eliminate the bear wave count and provide full confidence in the targets.
Click chart to enlarge.
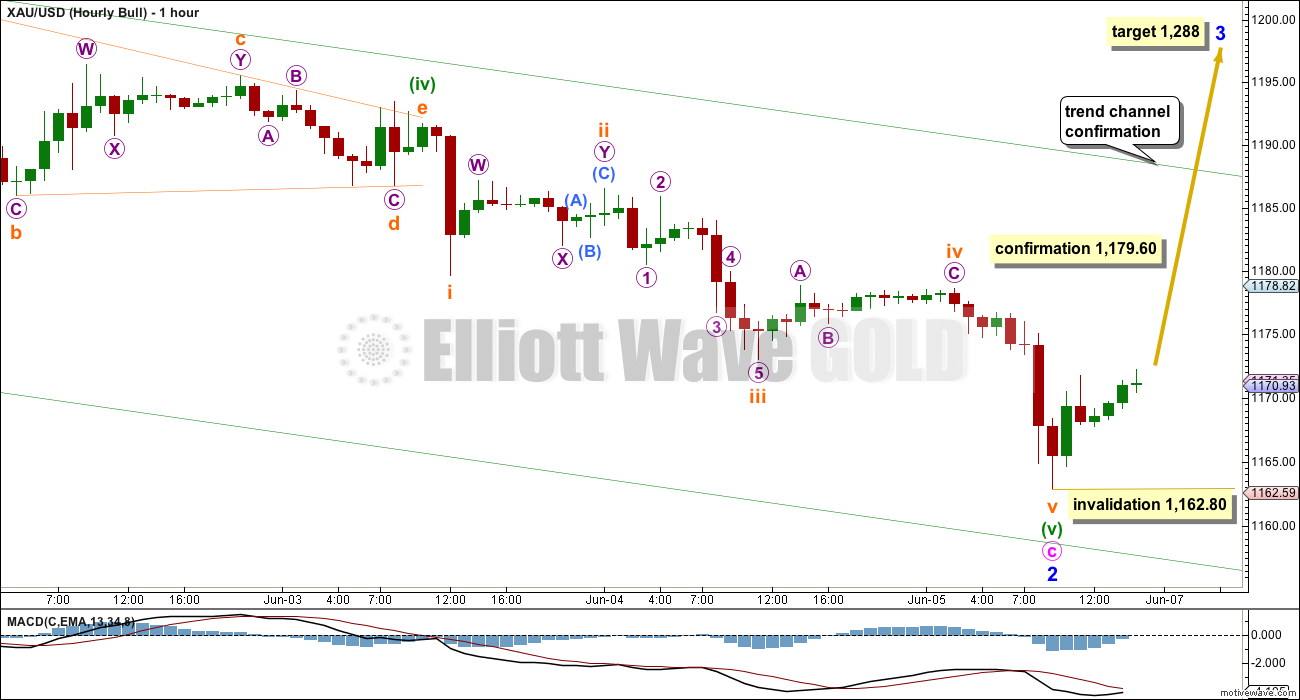
There are two ideas in this analysis for this last wave down of minuette wave (v). Both ideas work in exactly the same way for both bull and bear wave counts.
If this fifth wave is over, then it would be just 2.28 longer than equality with minuette wave (i). Because there is no adequate Fibonacci ratio between minuette waves (i) and (iii), it is very likely that this fifth wave will exhibit a Fibonacci ratio to either the first or third.
I have checked the subdivisions of this fifth wave on the five and one minute charts. Within this impulse, the fourth wave corrections are quicker than the second wave corrections (this is actually typical for Gold when it has strong extended fifth waves) giving some of these waves a three wave look on this hourly chart, when they subdivide as fives on a lower time frame.
The middle of the third wave must subdivide as an impulse, and on the one minute chart it does.
Subminuette wave ii was a combination and subminuette wave iv a zigzag. There is perfect alternation.
There are no adequate Fibonacci ratios between subminuette waves i, iii and v. This reduces the probability of this wave count.
A new high above 1,179.60 is required for first confirmation. At that stage, the next confirmation would come with a clear breach of this best fit channel. Only then would I have full confidence that this impulse for minute wave c is over and the next wave up is underway.
A new low below 1,162.80 would invalidate this idea at the hourly chart level. If that happens then use the hourly bear wave count for this bull wave count. They have would then have exactly the same subdivisions and targets.
Bear Wave Count
Click chart to enlarge.
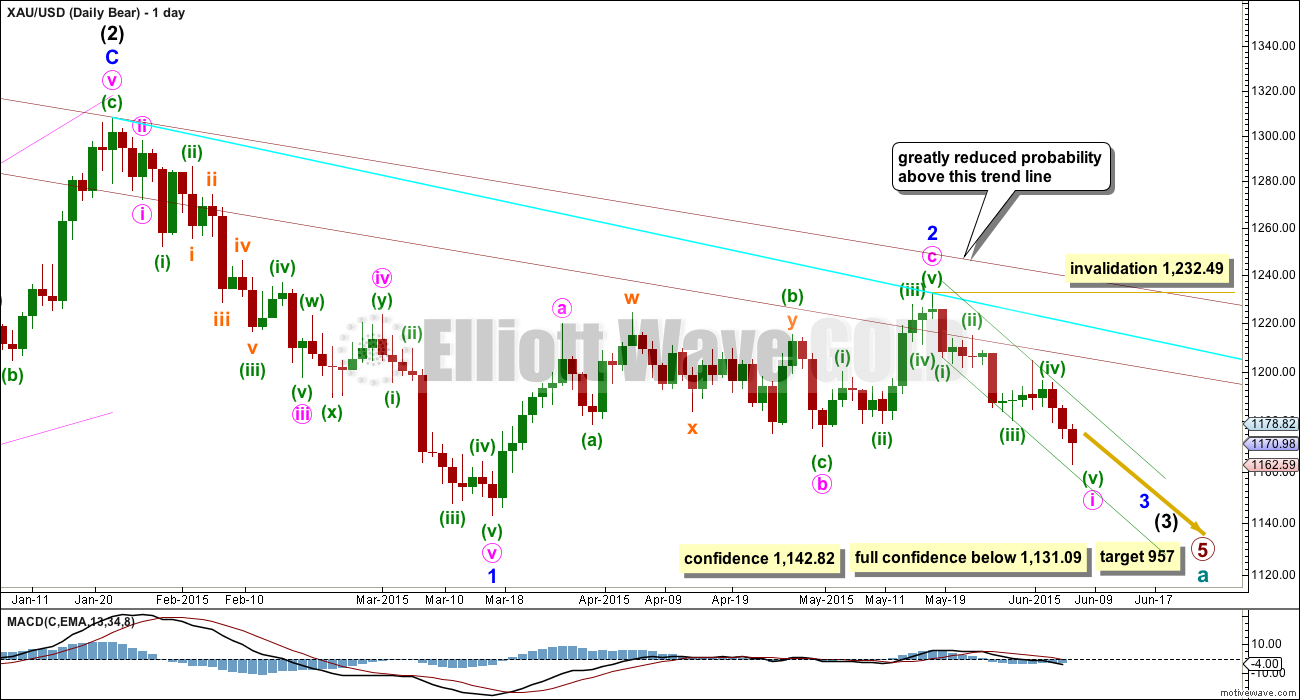
This wave count follows the bear weekly count which sees primary wave 5 within cycle wave a as incomplete. At 957 primary wave 5 would reach equality in length with primary wave 1.
Pros:
1. Intermediate wave (1) (to the left of this chart) subdivides perfectly as a five wave impulse with good Fibonacci ratios in price and time. There is perfect alternation and proportion between minor waves 2 and 4. For this piece of movement, the bear wave count has a much better fit than the bull wave count.
2. Intermediate wave (2) is a very common expanded flat correction. This sees minor wave C an ending expanding diagonal which is more common than a leading expanding diagonal.
3. Minor wave B within the expanded flat subdivides perfectly as a zigzag.
4. Volume at the weekly and daily chart continues to favour the bear wave count. Since price entered the sideways movement on 27th March it is a downwards week which has strongest volume, and it is downwards days which have strongest volume.
5. On Balance Volume on the weekly chart recently breached a trend line from back to December 2013. This is another bearish indicator.
Cons:
1. Intermediate wave (2) looks too big on the weekly chart.
2. Intermediate wave (2) has breached the channel from the weekly chart which contains cycle wave a.
3. Minor wave 2 is much longer in duration than a minor degree correction within an intermediate impulse normally is for Gold. Normally a minor degree second wave within a third wave should last only about 20 days maximum. This one is 44 days long.
4. Within minor wave 1 down, there is gross disproportion between minute waves iv and ii: minute wave iv is more than 13 times the duration of minute wave i, giving this downwards wave a three wave look.
Minor waves 1 and 2 are complete. Minute wave i within minor wave 3 may be incomplete on the hourly chart.
Minute wave ii may not move beyond the start of minute wave i above 1,232.49.
The bull and bear wave counts both see a five wave impulse down either incomplete and requiring a final fifth wave, or complete at today’s low.
If this impulse takes price below 1,142.82, then the bull wave count would be invalidated. But only a new low below 1,131.09 would invalidate any variation of a bull wave count and provide full and final confirmation for a bear wave count.
When this five wave impulse is complete, then the bull wave count will expect a third wave up and this bear wave count will expect a second wave correction. At that stage, the bear wave count would be invalidated with a new high above 1,232.49 and the bull wave count would be confirmed.
Click chart to enlarge.
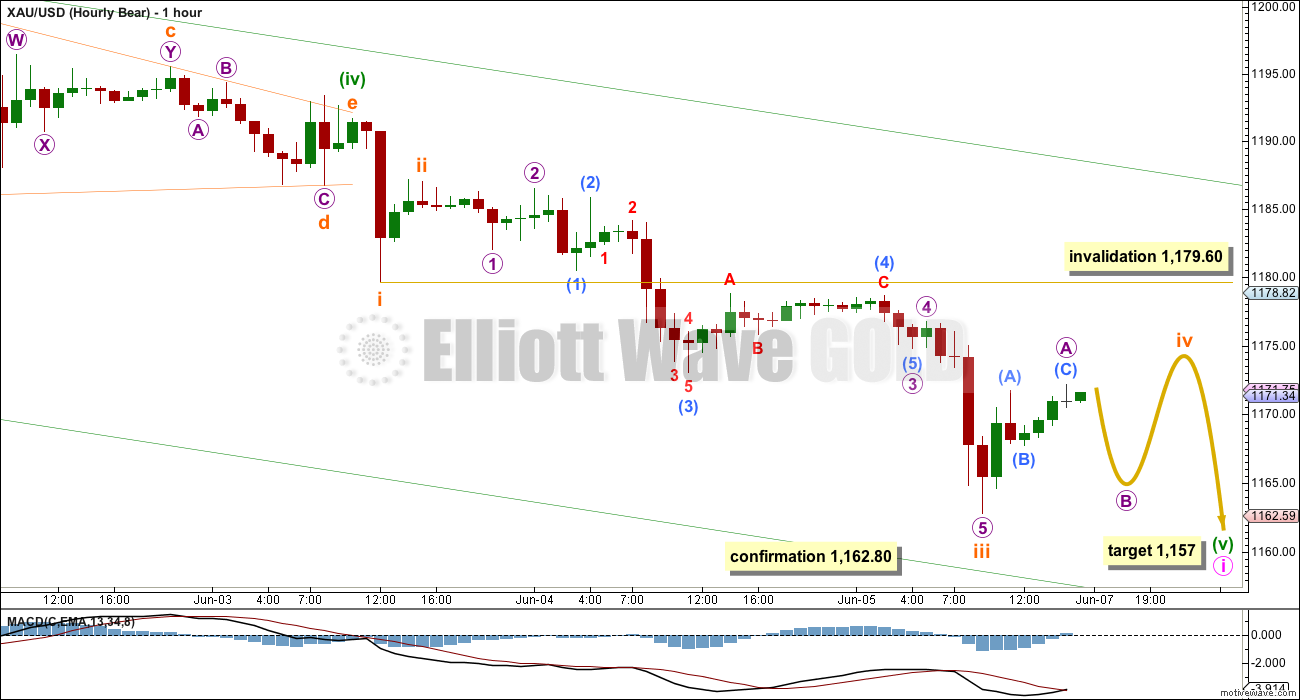
Both hourly wave counts work the same way for bull and bear.
This idea expects a final fifth wave down to unfold. At 1,157 minuette wave (v) would be extended and would reach equality in length with minuette wave (i).
There is no Fibonacci ratio between subminuette waves i and iii. It would be very likely that subminuette wave v will exhibit a Fibonacci ratio to either of i or iii, and equality with i at 12.11 in length would be the most likely ratio.
Subminuette wave ii was a quick zigzag. Subminuette wave iv may be a more long lasting flat, combination or triangle. Within it, the B wave is most likely incomplete, may move lower, and may even make a new low below 1,162.80 as in an expanded flat or running triangle. If that happens as part of this fourth wave, then this wave count would be confirmed and the idea presented for the bull wave count which sees this movement over would be invalidated.
This idea expects choppy overlapping movement for a few hours yet before this fourth wave is over. It would then be followed by a swift strong fifth wave down to the target. Please note: the arrow here depicts an expanded flat only because they are very common structures, but subminuette wave iv may be a triangle and may unfold sideways in a much narrower range than the arrow depicts.
Subminuette wave iv is most likely to end within the price territory of the fourth wave of one lesser degree. Micro wave 4’s territory is from 1,174.75 to 1,176.74.
At any stage, a new low below 1,162.80 would confirm this idea. Both bull and bear wave counts would then have the same target for the next wave down to end at 1,157.
Technical Analysis
Click chart to enlarge.
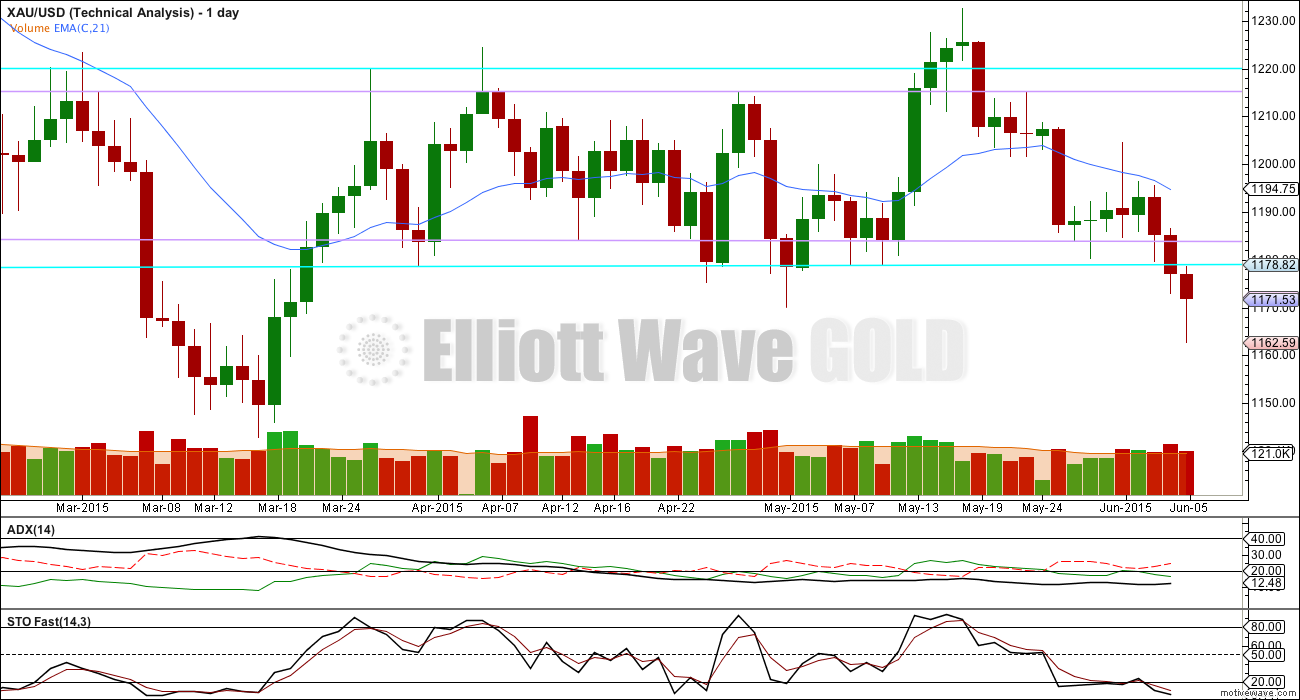
There is now a full daily candlestick below the lower aqua blue line which began back on 31st March. This may still only be an overshoot. Price has not closed 3% or more of market value below this line and so a bearish breakout is not yet indicated. (3% of market value below 1,178.59 is at 1,143.23) At this stage, it should actually be expected that this downwards swing will end either here or very soon and will be followed by another upwards swing towards resistance.
Stochastics remains oversold. This downwards swing should end soon.
ADX remains flat and below 15 indicating no clear trend still. It is possible that Friday’s data could bring ADX up to 15, and if that happens, then a downwards trend would be indicated. For now only Thursday’s data is available for ADX.
The slight decrease in volume for Friday is a slight concern. It looks like the market is falling of its own weight.
The long lower wick on the candlestick for Friday is a slight bullish indicator.
This analysis is published about 05:00 p.m. EST.
Looking on the five minute chart at subdivisions of this most recent movement: is it impulsive or corrective? That last wave up from the low at 1,162.80 to today’s high at 1,177.74 is so easy to see as a three, and so very hard to see as a five. I’ve not yet seen a solution which can see it as a five and meet all EW rules AND have a reasonable look on the five minute chart. So my conclusion (for now) is that although we have a green candlestick for Monday it is still a little more likely that we shall see new lows to the target 1,154 – 1,157 before the next wave up is ready to begin. I note also ADX is still below 15; there is STILL no clear trend indicated despite all this downwards movement. Gold remains range bound, this is not a trending market and extreme caution in your approach to trading it is still highly advised.
Lara since I have no gold holdings as I was waiting for the lower price target, I’m liking your conclusion, “…it is still a little more likely that we shall see new lows to the target 1,154 – 1,157 before the next wave up is ready to begin.”
I like that you go the extra mile to consider whether this move is impulsive or corrective. !!! Before this comment was posted I was adjusting my position to be on the “safe” side and re-enter at a lower price– all based on what I know is that your “likely” statements are indeed most likely (though I know no one can perfectly predict any market) Thanks again for your excellence shared with all!
If this downwards move is not over: a small concern is that there is a green candlestick for Monday which reduces the probability that we shall see new lows. For the bear subminuette wave iv would most likely be over as a zigzag (good alternation with the expanded flat of subminuette wave ii) ending at 1,178.54. A possible target for the final fifth wave to end this impulse would be 1,154 – 1,157. For the bull if the final fifth wave is not over the target is the same. Both ideas still fit in exactly the same way for bull and bear.
nugt just broke loose!
If this downwards move is over: For the bear wave count minute wave ii should be starting it’s move up. Fibonacci ratios as targets would be 0.382 ratio at 1,189 or 0.618 ratio at 1,205. Invalidation point is at 1,232.49, this needs to be breached to invalidate the bear and confirm the bull. For the bull wave count if this downwards wave is a complete impulse then it’s beginning a third wave up, the target is the same at 1,288.
Lara does this comment still apply or has today changed 1157 possibility? “At any stage, a new low below 1,162.80 would confirm this idea. Both bull and bear wave counts would then have the same target for the next wave down to end at 1,157.”
It most definitely still applies. Yes.
Lara says above that “subminuette iv may be a more long lasting flat, combination or triangle.” The more this drags on, the more likely gold is in a complex formation. This speaks for continued downward movement when the sideways drift is complete.
she also stated: Subminuette wave iv is most likely to end within the price territory of the fourth wave of one lesser degree. Micro wave 4’s territory is from 1,174.75 to 1,176.74………….we’ve been at 1174.75 and are at 1174.18 now. Can hardly wait for more clues as to this price movement.
Might this of been the top of subminuette (iv) 1177.75 at 21:12 Sunday?
Looking for clarification on Lara’s bear calculation from top of wave (iv) to bottom of wave (v). If I took high for (iv) of 1177.75 at 21:12 Sunday minus $12.11 equals $1165.64 bottom of (v), which wouldn’t even be below 1162.80 the confirmation point for the hourly bear chart. Lara mentions for the hourly bear chart, “There is no Fibonacci ratio between subminuette waves i and iii. It would be very likely that subminuette wave v will exhibit a Fibonacci ratio to either of i or iii, and equality with i at 12.11 in length would be the most likely ratio.”
Syed. The website was very slow, finally loaded. This is my take so far.
From the low of 1162.83, price has moved up in three waves to 1177.75. That is Wave 1 for the completed drop to 1162.83 scenario It can also be Wave 4 (Incomplete scenario, with a drop target of 1157).
I am watching the drop from here. “Incomplete” will drop to 1157 while “Complete” will stop short, most likely around 1168-1169, the 0.618 retrace.
Thank you Alan. That’s what I am looking out for too, to see how far down a drop below 1170 takes gold price…. Appears Gold price is hesitant to drop below pivot with 1164-62 below there as supportive…. I guess Time & Price will unravel; we may end up with an inside day. Thanks, good to have you around.
Thanks Syed. I always love your inputs of resistance and support levels too. They are very helpful in framing the upper and lower bounds of the price movement.
Yes, I think an inside day is becoming more likely by the minute. We may need to wait until Tuesday for clarification.
Gold would probably be falling of its own weight, if it were not for the USD lending it support today. The USD is having an inside down day.
The good news here is that this lengthy sideways movement should provide Lara an opportunity to weigh in on the wavecount.
Tham. Perfect timing. It appears my entry is no easy one and I am trying not to be upset with myself or not waiting on this one like u did! Thanks for your valuable input. 😉
has data given any you any better idea yet whether this is wave 1,2 or wave 4,5?
Lara did mention in Friday analysis that it may be Monday or Tuesday that gold drops down to 1157 target.
Gold price dropped to 1169.62 then spiked up to 1174.34.
For the “Complete” scenario, 1169.62 can be Wave 2 (with Wave 1 at 1177.75). There is a nice 3-wave flat structure 1175.75-1170.98-1175.85-1169.62. If this is correct, then it will be moving up in its Wave 3, and this will break the “Incomplete” invalidation point of 1179.60.
For the “Incomplete” scenario, that three waves comprise two nested 1-2’s, and portends a large drop in its Wave 3.
So this is getting interesting, either a big rise or a big drop in the next couple of hours.
I have been looking at the 1-2, 1-2 myself. The target could be lower than 1157 too.
I was really appreciative when i saw your analysis. I need to learn to do E.W. so I can be comfortable on the fly like you are. After reading I chuckled. No more clues yet! smiles!
At 12:48 am Alan/Tham commented, “…if price can break above 1177.75, then we have completed the low at 1162.83, and will then be moving higher towards 1182/1188…
If price moves below 1172.20, then there is an increased probability that we will be heading towards 1157.”
Gold didn’t go above 1177.75 since then. However Gold dropped below 1172.20 at 1:06 am down to 1070.98.
Can anyone explain Gold price movement thus far? With 1172-70 holding, it is having an inside day…. More of the sideways movement can be expected? Very confusing~! lol
Lara, just curious, were you able to update the website theme as planned this weekend? I don’t see any obvious changes.
Oh goodness, an excellent question. The short answer? No. The long answer: We planned to update both Elliott Wave Stock Market and Elliott Wave Gold. EWSM we worked on (my time) Sunday through to Monday night. Finally finished, went live, and crashed the server both sites were on. I’m not sure of the status right now with EWSM, I see it’s in the new format, but as for the comment functionality over there… I’m waiting for Cesar. I had enough and needed to sleep, now its his turn. Its an absolutely huge job, and much went wrong that didn’t go wrong in our testing beforehand. EWG will have to wait until next Sunday now, we can’t take the site down during the week for that long. I really am sorry to members that you’ll have to put up with this comment system for another week. But by next Sunday we should have the bugs ironed out.
Thanks for the update. Sorry you had problems. I just looked at a public post on EWSM and it appears you can now upload charts directly, so looks like a success!
Yes, it should be a big improvement. We wanted comments for both sites to do four things: 1. To be private for members only, this needs to be secure. 2. Allow members to upload charts directly from a device, not requiring a link. 3. Allow members to edit comments. 4. Be real time. We have the first three points met for sure. The last one…. we shall see if we can adjust to make it happen.
Lara, even though you haven´t discarded the bull scenario, it´s becoming more evident that we are in the bear scenario. In my opinion, we are in the i of 3, expecting anytime soon an upward movement for the ii retrace in order to speed up for the iii of 3 down soon. If you look GDX is pretty obvious the uptrend is broken, a gap was filled last week (retest), and then we head lower. Gold, silver, HUI all our tested their resistance downtrend and failed, therefore feeding a more bearish play. EW is an extraordinary tool but additional TA helps clarify our doubts. In sum, we are in the bearish scenario and any upward move is a countertrend rally.
ATM it is looking slightly more likely, but price has not yet told us for sure that a bear market is underway. ADX is still below 15. The lower horizontal trend line has not been breached by a close of 3% or more of market value… yet. So using regular TA methods we still cannot say for sure a bear market is underway. Making such a call must be opinion only. Which is fine, but it needs to be acknowledged that it’s opinion and price has not confirmed it. At the end of the day it must be price which tells us if the market is bull or bear.
My two cents – Lara’s numbers are in complete sync with any other technical analysis that I have done. A move above 1178-9 region would indicate that an upside bounce is occurring. Likewise, a new low below 1162 would obviously hint at some more immediate downside movement to the 1157 target or slightly below (lower 1150s).
As for the bounce higher, it’s days are limited. The are 8 trading days left until the June 17th Fed announcement. I believe that will mark the end of upward movement for quite some time. That should be the date of the final nail in the bull’s coffin, if it doesn’t happen before then. As Lara says, a target for the bounce can not be calculated until the low is in. If that short term low at 1162 were to hold, the highest that gold could go is the 1205 region. That’s the most that could happen. However, if gold creeps a little lower, the bounce may only be into the 1190s. I for one will feel very comfortable shorting gold anywhere remotely near 1200.
Tend to agree with your view and analysis. 1189 with 1205-06 on the outside. A break below 1154 will bury this~!
Matt, my understanding is that the Fed will officially delay a rate hike next week, which should cause gold to move higher. Why do you think that the Fed’s announcement will make gold go lower?
There won’t be a rate hike now – that’s already priced in. It’s the speech that Yellen will make afterward – which may strongly suggest a rate hike later this year – that will seal the deal on gold’s near term fate. Fed meetings with speeches are major market movers and this one will most certainly influence gold’s direction for the coming weeks.
What’s more important than the speech is where the price of gold is before it happens. If gold already had its bounce by the 17th, I would expect it to drop like a rock. If the bounce hasn’t happened yet, then it could occur then.
I went thru gold’s target in summery from reports from May 5th to June 5th. ——— Purpose was to find some clue to forecasting price of gold. ————From May 5th to May 26th target was for gold to go down to 1168 to 1192 range. ———On may 27 to June 1 range was gold to rise to 1232 to 1242.——Then June 3rd back to gold price to go down to 1160 to 1157. ———-In the mean time gold continued on the original schedule down from May 5th on ward.—————- Alan/Lara I am not smart to evaluate and determine lesson learned here.————- May be stick to original labeling of waves OR any suggestions??????
Hi Papudi.
I wouldn’t be too concerned about the past events. I rather focus on the present.
Looking at today’s price action so far, I think that we are at a crossroads here. Today’s high is at 1177.75. The previous high on Friday was at 1172.20. So, my thinking is that if price can break above 1177.75, then we have completed the low at 1162.83, and will then be moving higher towards 1182/1188 where a cluster of resistance resides (and will drop thereafter). If price moves below 1172.20, then there is an increased probability that we will be heading towards 1157. We’ll let the market decide. There are still another 9 hours or so before the market opens.
Thanks for your input Alan. I sure hope this thing goes north. But if not I can sell at open and re-buy. Not taking chances here. See you tomorrow.
When price is within a sideways chop and structure keeps changing it’s essential with any TA method to be flexible. If you’re asking for the wave count to remain the same what you’re actually wanting is for the right one to be known (how?) at the start of a movement. This is a correction. There are more than 13 possible structures. It’s impossible to know at the start which structure will unfold. That’s why the wave count changes and alternates are necessary. In being flexible as it unfolds the idea is to be able to predict the breakout direction and know exactly what price point confirms it, and exactly when the correction is done and the next trend is underway.
SENTIMENT / A VIEW: With a weekly H 1204.70 / L 162.10 Gold price appears to be held down just under .236 = 1172.15 and could possible seek .382 = 1178.37 which is close to the invalidation level given by Lara. My concern is of a bullish Homing Pigeon seen and remains to be seen if Gold price can take out the Friday H 1178…. With momentum, ROC and MACD in bearish territory and the current low having been accompanied with increasing volume indicative of further new low, but will remain to be seen if gold price can get below 1163…. dang, so hard to pick a winner when price is on tender hooks lol~!
Once this wave i is complete what is the target for corrective wave ii in bear wave daily count?? ———— Any one? Thanks.
It’s impossible to give you a target before the wave is complete. It may be just 0.382 or it may be 0.618 of the first wave. If we don’t yet know how long the first wave is then we can’t calculate any Fibonacci ratios.
The bear count may see price find resistance at the maroon trend line, or aqua blue trend line. The bull count needs a third wave up next.
And one more thing to be on the look out for is a three gaps down candlestick pattern on Monday. We have two gaps down in a row not filled, one more on Monday could offer a good buying opportunity.
If not expanding flat formation might be triangle in wave b
You need to resolve how your intermediate (A) subdivides as a three; minor wave A within it will not fit as either an impulse or a leading diagonal and meet all EW rules. And please note also that expanding triangles (which you seem to be labelling this current move as) are the rarest of all EW structures. I’ve only ever seen two (which were definitely expanding triangles in hindsight) in seven years of daily EW analysis following several markets.
One other quick consideration that I am watching, GDX options expiration is on the 19th, about 2 weeks away. The last few months the options sweet spot has been a magnet come Thursday/Friday of options expiration. Just a quick look at the options open interest and the put volume from today, along with what we are anticipating from the EW above, I suspect GDX recovers to the open gap between 20.40-20.70 within the next two weeks. That should put JNUG in the $25 range. So after reflecting the wave counts, the bearish action, and the likely bounce doing, ill be looking to trim my longs as we rise between now and those targets.
Regarding the 1157 target possibility – Rick Ackerman’s hidden pivot of 1179 broke and he wrote if that happened, 1153 was inevitable. In case anyone wants to consider that perspective.
Richard—— From your fav Avi Gilbert EW analyst: —-The next great bull market: Gold $25,000 ——–I stand before you today, almost feeling like Elliott did back in 1941. Yes, in 2015, I am seeing this correction finally completing (but at much lower levels) and starting a major bull market phase that can last the next 50 years.——–Read More here
Papudi, Thanks I have read a few Times this year Avi mention that EW projected many years out that gold and especially HUI and the miners will skyrocket. He mentioned it will be a few years before the really big increases begin to happen parabolic.
He’s providing a chart of AMEX Gold Bugs Index as proof that the price of Gold will rise from here? But that market and the market we’re analysing here, Gold to USD, are different. The two wave counts are very different indeed. He has an expanded flat close to completion, but that absolutely will not work for Gold / USD. So I find it difficult to agree with his conclusions in the article.