
There are four hourly Elliott wave counts today.
Confirmation / invalidation points may be used to work with these four Elliott wave counts over the next two days, until we are left eventually with only one count.
Summary: For the bull wave count: if minor wave 2 is over, then a third wave up is beginning with a leading diagonal in a first wave position, and a new high above 1,191.71 minimum is required to have any confidence in this idea. Alternatively, minor wave 2 may not be over and minuette wave (v) may continue lower to 1,157, which now has a lower probability than the first idea. For the bear count: minute wave i is incomplete, with minuette wave (v) continuing lower as a very long extension and moving now into its third wave down with the target at 1,157 (probably too high). Alternatively, minute wave i is over and minute wave ii is unfolding as a flat correction, and within it minuette wave (b) must now move lower to a minimum 1,164.82 and may make a new low below 1,162.80.
To see the bigger picture and weekly charts go here.
Changes to last analysis are italicised.
Bull Wave Count
Click chart to enlarge.
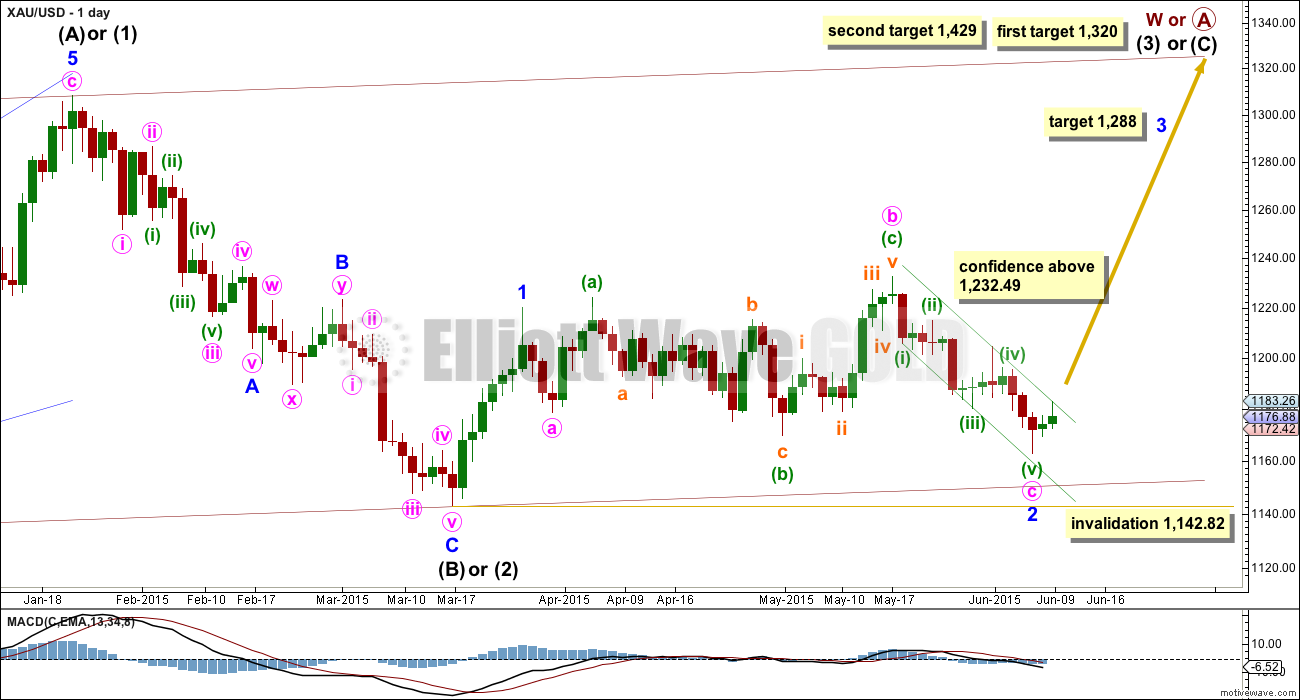
The bull wave count sees primary wave 5 and so cycle wave a a complete five wave impulse on the weekly chart.
Pros:
1. The size of the upwards move labelled here intermediate wave (A) looks right for a new bull trend at the weekly chart level.
2. The downwards wave labelled intermediate wave (B) looks best as a three.
3. The small breach of the channel about cycle wave a on the weekly chart would be the first indication that cycle wave a is over and cycle wave b has begun.
Cons:
1. Within intermediate wave (3) of primary wave 5 (now off to the left of this chart), to see this as a five wave impulse requires either gross disproportion and lack of alternation between minor waves 2 and 4 or a very rare running flat which does not subdivide well. I have tried to see a solution for this movement, and no matter what variation I try it always has a major problem.
2. Intermediate wave (5) of primary wave 5 (now off to the left of the chart) has a count of seven which means either minor wave 3 or 5 looks like a three on the daily chart.
3. Expanding leading diagonals (of which intermediate wave (A) or (1) is) are are not very common (the contracting variety is more common).
4. Volume does not support this bull wave count.
For volume to clearly support the bull wave count it needs to show an increase beyond 187.34 (30th April) and preferably beyond 230.3 (9th April) for an up day. Only then would volume more clearly indicate a bullish breakout is more likely than a bearish breakout.
Within cycle wave b, primary wave A may be either a three or a five wave structure. So far within cycle wave b there is a 5-3 and an incomplete 5 up. This may be intermediate waves (A)-(B)-(C) for a zigzag for primary wave A, or may also be intermediate waves (1)-(2)-(3) for an impulse for primary wave A. At 1,320 intermediate wave (C) would reach equality in length with intermediate wave (A) and primary wave A would most likely be a zigzag. At 1,429 intermediate wave (3) would reach 1.618 the length of intermediate wave (1) and primary wave A would most likely be an incomplete impulse.
Intermediate wave (A) subdivides only as a five. I cannot see a solution where this movement subdivides as a three and meets all Elliott wave rules (with the sole exception of a very rare triple zigzag which does not look right). This means that intermediate wave (B) may not move beyond the start of intermediate wave (A) below 1,131.09. That is why 1,131.09 is final confirmation for the bear wave count at the daily and weekly chart level.
Intermediate wave (C) is likely to subdivide as an impulse to exhibit structural alternation with the leading diagonal of intermediate wave (A). This intermediate wave up may be intermediate wave (3) which may only subdivide as an impulse.
This bull wave count sees minor wave 1 a short brief impulse and minor wave 2 now an expanded flat correction. Within minor wave 2, minute wave c has now moved below the end of minute wave a at 1,178.59 avoiding a truncation and a very rare running flat.
It is possible that minor wave 2 is over here. If it is, then minute wave c is just 2.7 longer than 1.618 the length of minute wave a. At 1,288 minor wave 3 would reach 1.618 the length of minor wave 1. If minor wave 2 moves lower, this target must also move correspondingly lower.
Minor wave 2 may not move beyond the start of minor wave 1 below 1,142.82.
After completion of minor wave 2, then a new high above 1,232.49 would eliminate the bear wave count and provide full confidence in the targets.
Main Hourly Bull Wave Count
Click chart to enlarge.
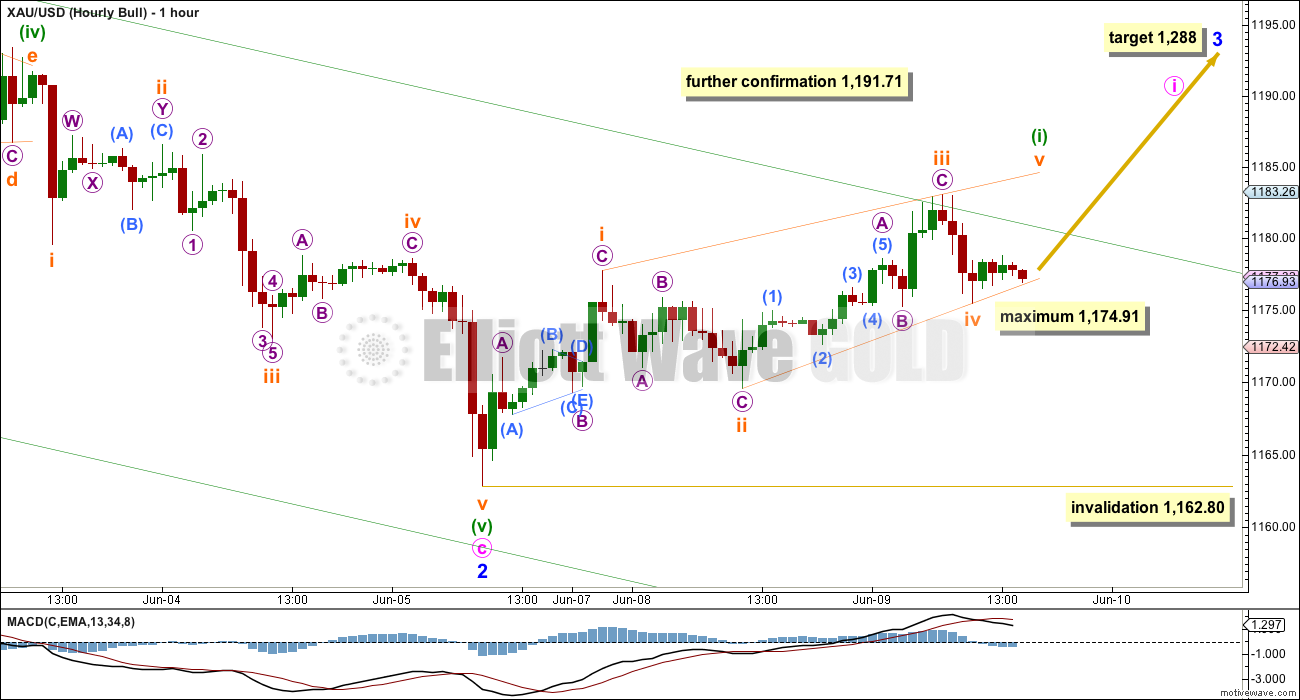
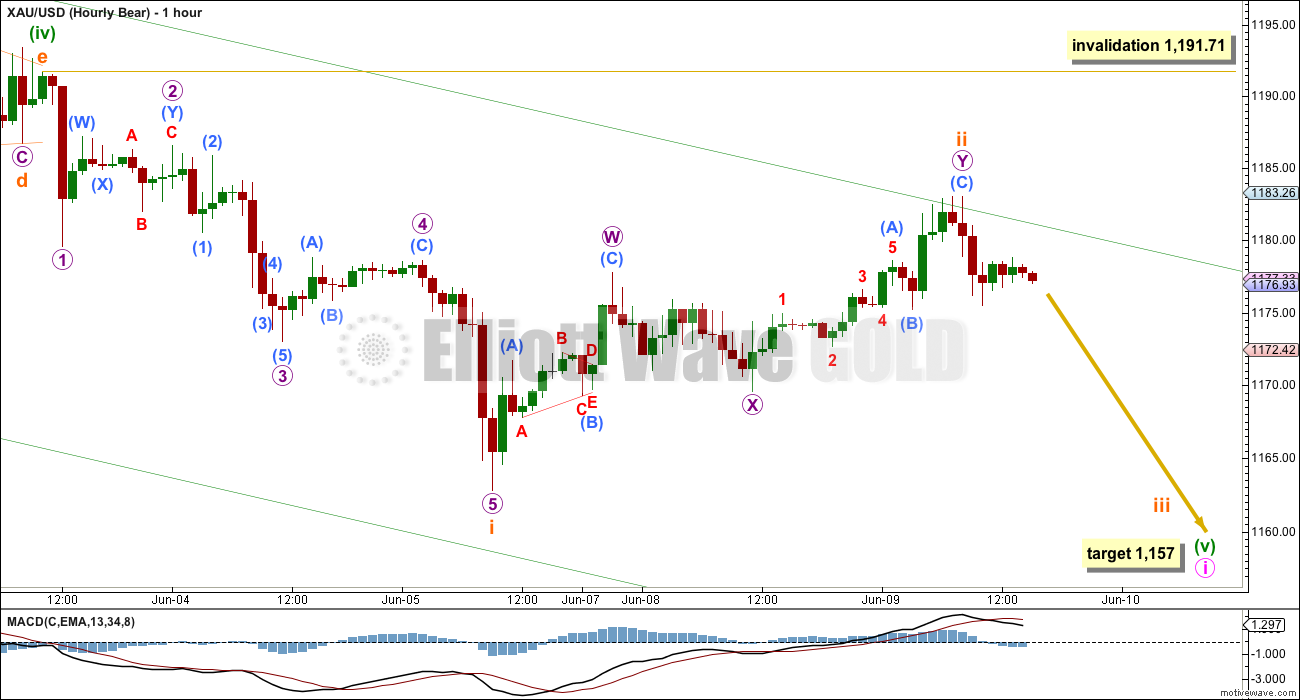
For the bull wave count, it is now most likely that minor wave 2 is over.
If minor wave 3 has begun, then at 1,288 it would reach 1.618 the length of minor wave 1. Along the way up, a new high above 1,232.49 would confirm the bull wave count at the daily chart level. At that stage, there would be only one wave count at the weekly and daily chart level.
In the shorter term, a new high above 1,191.71 would provide some confidence that for the bull wave count minor wave 2 must be over, and that would invalidate the alternate bull count below.
If there has been a trend change at minor degree, then the new upwards trend is beginning with overlapping three wave movements indicating a diagonal. For a leading diagonal, the contracting variety is much more common than the expanding.
Minuette wave (i) may be a leading contracting diagonal. Within minuette wave (i), subminuette wave iii is shorter than subminuette wave i, so subminuette wave iv must also be shorter than subminuette wave ii. Subminuette wave iv may not move below 1,174.91 where it would reach equality in length with subminuette wave i. The diagonal trend lines should converge and they should provide good support and resistance, containing the diagonal.
A leading diagonal may not have a truncated fifth wave, so subminuette wave v must make a new high above the end of subminuette wave iii at 1,186.05. It would most likely end with an overshoot of the i-iii orange trend line, which is a common look for contracting diagonals.
Leading diagonals in first wave positions are commonly followed by very deep second wave corrections. Minuette wave (ii) would be expected to be 0.618 or deeper of minuette wave (i). Minuette wave (ii) may not move beyond the start of minuette wave (i) below 1,162.80.
Alternate Hourly Bull Wave Count
Click chart to enlarge.
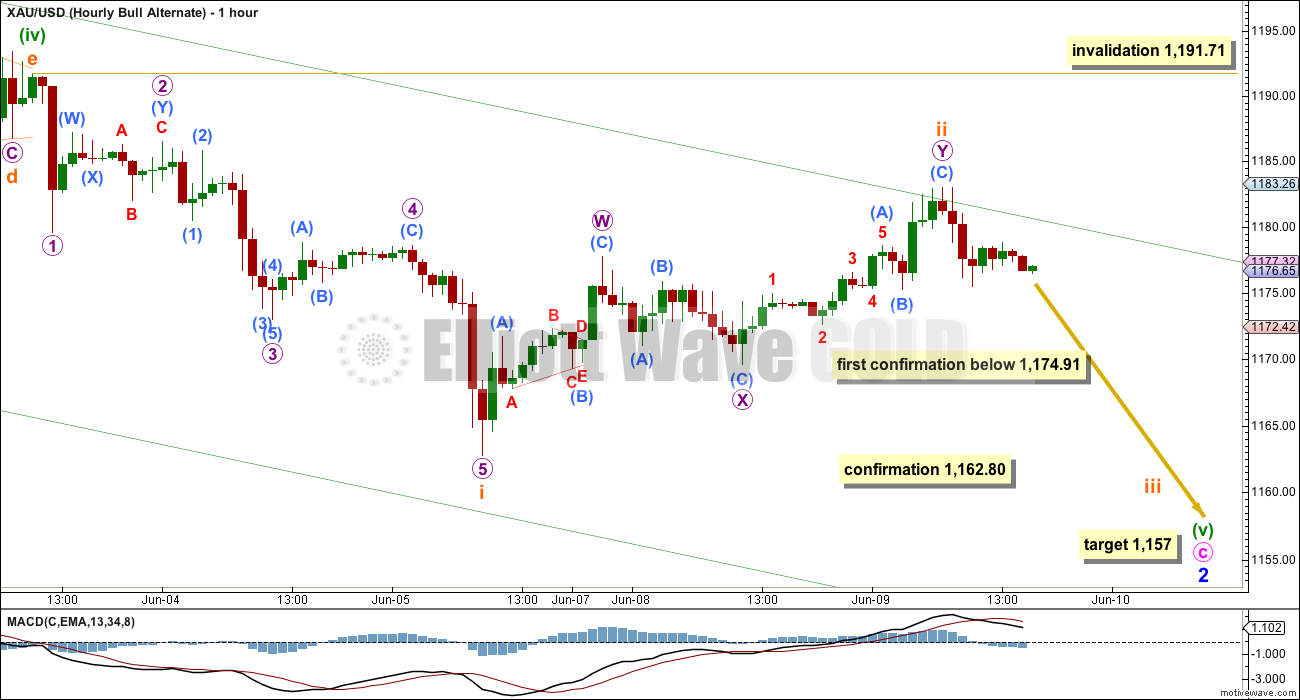
It is still possible that minor wave 2 is not over, and that minuette wave (v) will continue lower as a very long extension. The problem with this idea today, which reduces it to an alternate (and this is only my judgement, of which opinion is a big part), is the duration of subminuette wave ii. It shows up on the daily chart as two green candlesticks, which looks to be too time consuming for a subminuette wave within a correction (minor wave 2 is a correction).
Subminuette wave ii subdivides perfectly as a completed double zigzag. It is finding resistance at the upper edge of the green channel copied over from the daily chart. If it continues any further, it may not move beyond the start of subminuette wave i above 1,191.71.
Subminuette wave iii downwards should show an increase in momentum.
At 1,157 minuette wave (v) would reach equality in length with minuette wave (iii). A new low in the short term below 1,162.80 would confirm this idea, but prior to that a new low below 1,174.91 would substantially increase its probability because that would see the diagonal structure on the main hourly bull wave count invalid.
Bear Wave Count
Click chart to enlarge.
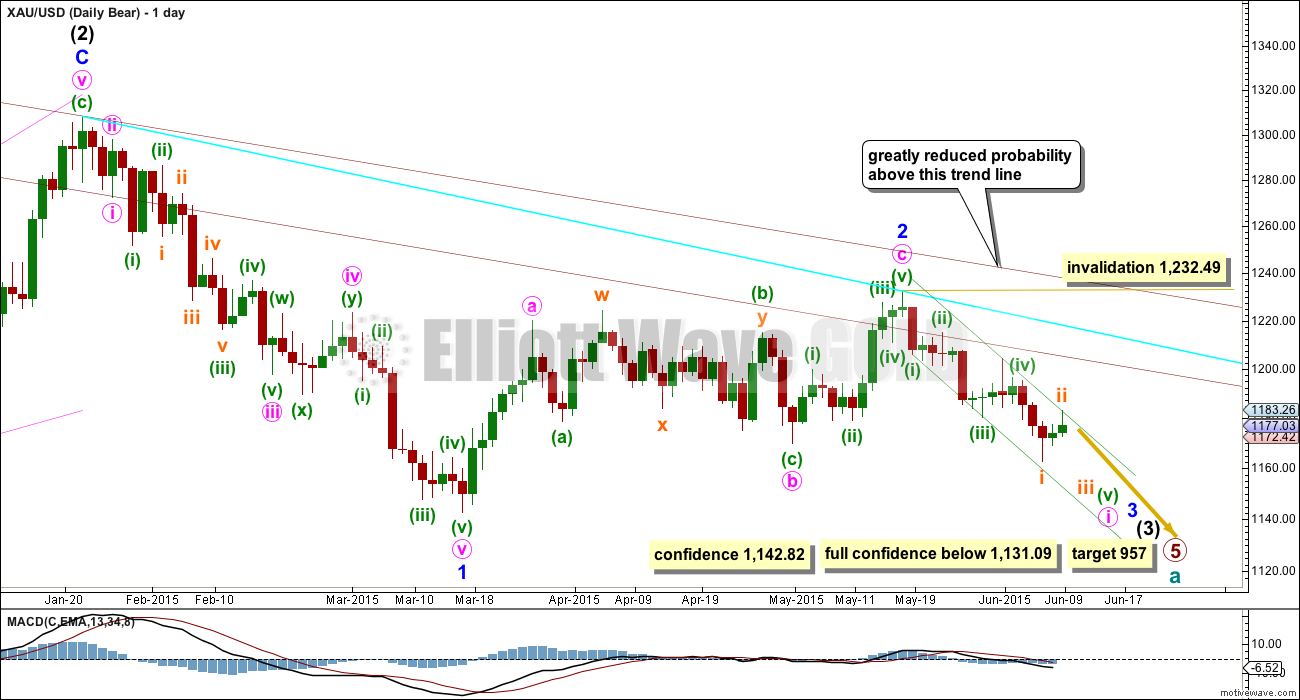
This wave count follows the bear weekly count which sees primary wave 5 within cycle wave a as incomplete. At 957 primary wave 5 would reach equality in length with primary wave 1.
Pros:
1. Intermediate wave (1) (to the left of this chart) subdivides perfectly as a five wave impulse with good Fibonacci ratios in price and time. There is perfect alternation and proportion between minor waves 2 and 4. For this piece of movement, the bear wave count has a much better fit than the bull wave count.
2. Intermediate wave (2) is a very common expanded flat correction. This sees minor wave C an ending expanding diagonal which is more common than a leading expanding diagonal.
3. Minor wave B within the expanded flat subdivides perfectly as a zigzag.
4. Volume at the weekly and daily chart continues to favour the bear wave count. Since price entered the sideways movement on 27th March it is a downwards week which has strongest volume, and it is downwards days which have strongest volume.
5. On Balance Volume on the weekly chart recently breached a trend line from back to December 2013. This is another bearish indicator.
Cons:
1. Intermediate wave (2) looks too big on the weekly chart.
2. Intermediate wave (2) has breached the channel from the weekly chart which contains cycle wave a.
3. Minor wave 2 is much longer in duration than a minor degree correction within an intermediate impulse normally is for Gold. Normally a minor degree second wave within a third wave should last only about 20 days maximum. This one is 44 days long.
4. Within minor wave 1 down, there is gross disproportion between minute waves iv and ii: minute wave iv is more than 13 times the duration of minute wave i, giving this downwards wave a three wave look.
Minor waves 1 and 2 are complete. Minute wave i within minor wave 3 may be incomplete on the hourly chart.
Minute wave ii may not move beyond the start of minute wave i above 1,232.49.
The bull and bear wave counts both see a five wave impulse down either incomplete and requiring a final fifth wave, or complete at Friday’s low.
If this impulse takes price below 1,142.82, then the bull wave count would be invalidated. But only a new low below 1,131.09 would invalidate any variation of a bull wave count and provide full and final confirmation for a bear wave count.
When this five wave impulse is complete, then the bull wave count will expect a third wave up and this bear wave count will expect a second wave correction. At that stage, the bear wave count would be invalidated with a new high above 1,232.49 and the bull wave count would be confirmed.
Main Hourly Bear Wave Count
Click chart to enlarge.
For the bear wave count, it may be more likely that minuette wave (v) is not over and will keep going for several days yet as a very long extension. For the bear wave count, it does not matter so much that subminuette wave ii shows up on the daily chart as two green candlesticks, which is a small correction within a larger impulse, and is common for these smaller corrections to show up within impulses.
Minuette wave (iv) was a barrier triangle. Fifth waves following barrier triangles are either very short and quick (clearly this one does not fit that description) or very long extensions. A very long extension looks like what this one will be.
At 1,157 minuette wave (v) would reach equality in length with minuette wave (i). Both would be extended. This target may not be low enough for the structure to unfold; minuette wave (v) may be longer, a very long extension indeed. I will recalculate the target, if it looks necessary, and will use subminuette wave degree to add to the calculation when there is more structure.
Subminuette wave ii subdivides perfectly as a completed double zigzag. Because it is finding resistance at the upper edge of the green channel, it is very likely it should end there. If it continues higher, it may not move beyond the start of submineutte wave i above 1,191.71.
Alternate Hourly Bear Wave Count
Click chart to enlarge.
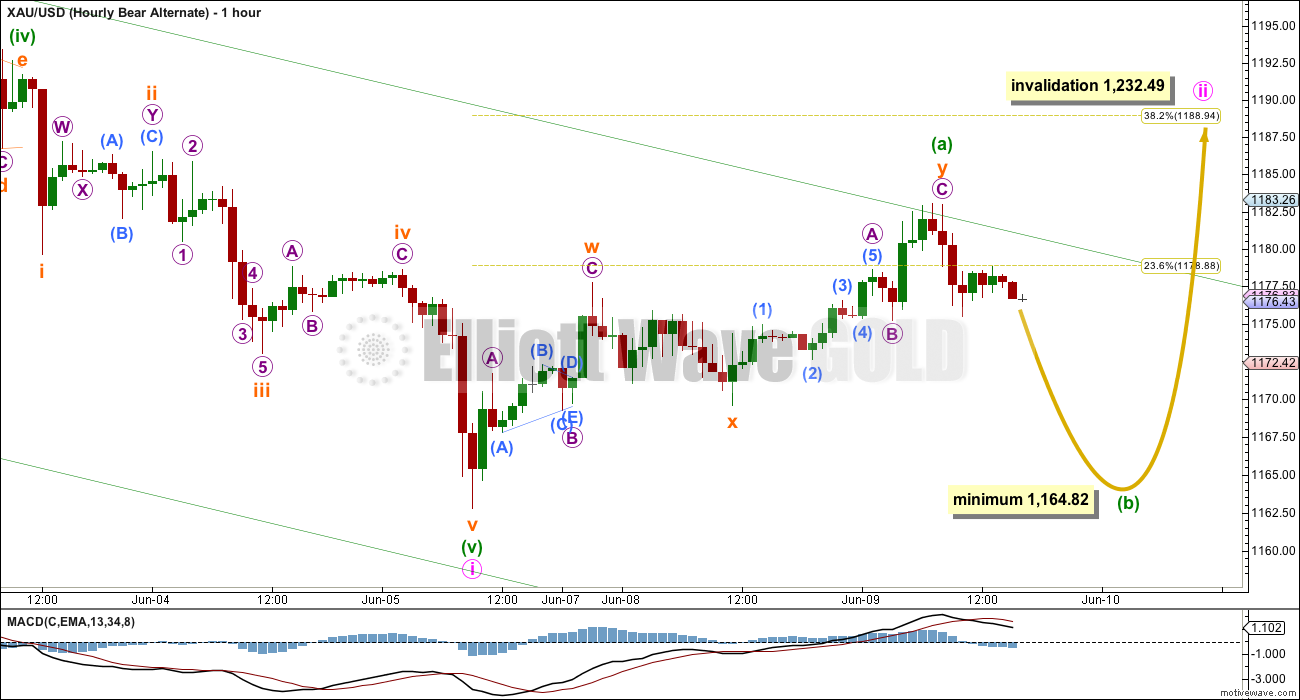
By simply moving the degree of labelling within minute wave i all back up one degree, it is possible that it is over. Minuette wave (v) may have been more short and brief, 2.28 longer than equality in length with minuette wave (i).
If minute wave i is over, then the bear count requires a second wave correction to unfold. This is a low degree second wave correction within a third wave one and two degrees higher. The strong downward pull of minor wave 3 and intermediate wave (3) may force minute wave ii to be more shallow than a second wave correction normally is, so the 0.382 Fibonacci ratio at 1,189 would be favoured as a final target.
Within minute wave ii, minuette wave (a) subdivides best as a double zigzag. If my analysis of this movement as a series of zigzags is correct, then minute wave ii may not be a combination or zigzag so it must be a flat correction. Within a flat correction, minuette wave (b) must make a minimum 90% retracement of minuette wave (a) at 1,164.82 or below. An expanded flat would see minuette wave (b) move to a new low below the start of minuette wave (a) at 1,162.80. Expanded flats are very common structures so this is quite likely.
When the length of minuette wave (b) is known, then the type of flat would be known and a target for minuette wave (a) based on a Fibonacci ratio to minuette wave (a) could be calculated.
Minute wave ii may not move beyond the start of minute wave i above 1,232.49.
Technical Analysis
Click chart to enlarge.
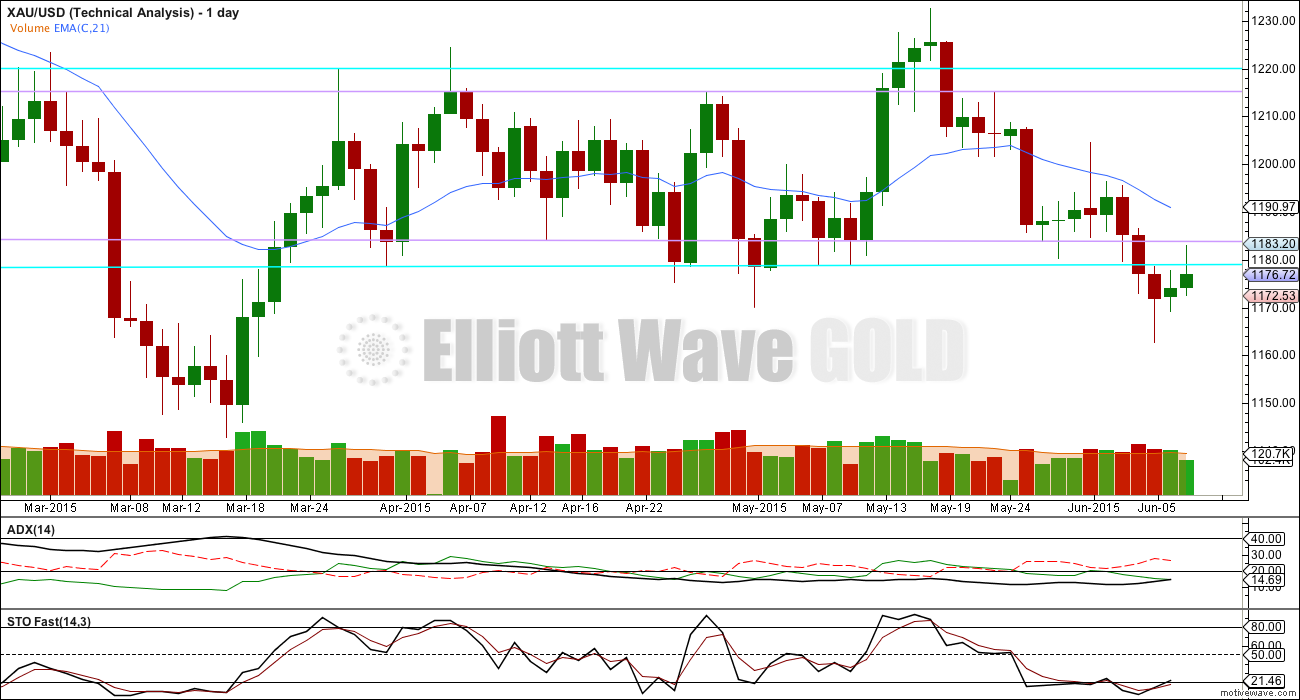
ADX has moved slightly higher from 14.66 to 14.69; below 15 still indicates there is no clear trend. Price remains within a sideways consolidation, and there is no clear breakout yet.
Volume for the last two up days is declining. This is typical of a corrective movement against the trend. This fits best with the alternate bear hourly wave count.
Stochastics is returning to normal from oversold. An upwards swing may be indicated, but volume is warning it may not be properly underway yet.
Price is finding resistance at the lower lilac trend line. For confidence in an upwards swing from here this trend line should be again breached, preferably on increased volume.
The long upper wick of today’s candlestick is a bearish indicator.
There are enough bearish indicators for this range trading method to be approached at this time with more extreme caution. It is not as clear at this stage that an upwards swing should unfold, and with bearish volume indicators at the daily and weekly chart levels a bearish breakout may be possibly imminent. Another couple of days information should begin to make this picture clearer.
This analysis is published about 05:47 p.m. EST.
Bought back GDX a little cheaper at 3:59:52 eight seconds to close, than what I sold it for at 10 am.
Focusing on bullish option and selling Thursday am, “The fifth wave up should reach equality with the first wave about 1,199, that would be my target for tomorrow morning.”
I could of bought GDX cheaper at 3 pm but waited for Lara’s comments.
Taking profits, sold 1/3 of my long position a few moments ago.
I am leaning toward the bull up to 1200 range, then deep correction into the 17th, and a run up from there. So I took some profits because I either have 1 to 2 more days of upside (bull) or drop from here (bear).
No second wave correction yet for the bull count. BUT for the bear count, the middle of a third wave down may begin from here.
My short term conclusion: for the bull wave count a first wave must be incomplete. Target 1,200. For the bear wave count this upwards move is a second wave correction and it may now be over, but only as a very rare triple zigzag.
Lara are you suggesting that the Retrace is over for today?
If so and bullish forecast I will buy GDX again.
“All I can say at this stage is clearly the downwards move is over…”
If the bull wave count is correct then yes, I think tomorrow we should begin with upwards movement to complete a five wave impulse up. The diagonal is completely invalidated. For the bull count the short term invalidation point is at 1,183.05; I see this current downwards piece on the hourly chart as a fourth wave and it can’t move into its counterpart first wave price territory below 1,183.05. The fifth wave up should reach equality with the first wave about 1,199, that would be my target for tomorrow morning. BUT if the bear count is correct Richard then the middle of a strong third wave down could begin tomorrow. A new low below 1,183.05 tomorrow may be slight increase in probability for the bear count, or at least a deeper correction short term.
Certainly the price points fit with the main hourly bull, however, when i draw the lines on the chart it does not look like they are contracting. Also, the 5th wave was longer than the 3rd (which makes 3rd the shortest not sure if that breaks a rule), and subminuette wave iv moved too low per my data feed. So I actually think the hourly bull needs revision or it just doesn’t work. I don’t think it is a valid leading contracting diagonal. Alternate hourly bear i think still fits, as wxy. Sorry if someone covered this before or if I missed something
You’re right. A third wave may not be the shortest wave. It’s not a leading diagonal.
Alan———- Alt bear hour count how high wave c/ a can go? Assuming wave c / a is not complete. .
I see the movement from 1162 as a correction in a bear market, because I see much lower prices ahead. While gold technically made it to the 1189-1205 target zone for this correction, I don’t like the fact that it doesn’t show well as a 3 wave structure on the daily charts….at least not to me. This leads me to believe that the recent high, if it holds, is perhaps just the A wave of a 3 part correction. I am not sure how to break down the movement from 1162, nor can I tell if it is over. However, as it stands now, I think that the size and scale of this potential A wave has left the perfect amount of room for a B wave down and a C wave back up to the 1200 area to occur.
Exactly. The A wave will fit only as a triple zigzag. I’ll have two counts for the bear; the first which sees minute ii complete now as a rare triple zigzag, and the second which moves that all down one degree and sees it as only wave A of a flat correction to continue sideways. The structure of the next move down – is it a three or a five? Will tell us which one is correct. I agree, it doesn’t look like a clear three on the daily chart. BUT it’s lasted 3 days and reached to just over the 0.382 Fibonacci ratio, the most likely place for it to end. We need to be alert for the possibility that it could be more brief and shallow than second waves normally are.
Is this what we had today with Gold price confirming the main bull count with a leading diagonal subminuette wave v up surpassing 1191.71 and likely to follow with a very deep second wave correction? I don’t think the Gold bulls have drawn first blood yet with 1195-96 limiting the upside (maybe my optimism to still have a bear count in play~!)…. Can see that Gold price is having difficulty getting below 1185 possibly posturing to take out 1192-93; I wonder if Gold price will drop through 1185 for 1178-75 or continue on further up…. Alas, the Gold price conundrum~!
Syed, Yes it is what we had with hourly bull.
1192.44 high today not sure if that was minuette wave (i) or minute wave i circle? Lara for hourly bull minuette (i) mentioned in video and writing a potential very deep correction .618 or deeper. See my comments below.
Thank you Richard. Don’t see any signs yet for the start of a very deep second wave correction if Gold price is playing out a Bull count or the beginnings of a flat correction should Gold price still be in a bear count…. Just have to play it as one sees it~!
Gold price really needs to get below Fibo levels 1184-83 / 1181-80 to show promise of either the deep second wave correction or the flat correction….
The bull count (main, alternate invalidated) is the one with the small price movements. It has to move down from 1192 to 1174-1175 or lower (minuette 2) in five waves. The bear (alternate, main invalidated) is the one with the large drop. That large drop is yet to materialise, yawn.
The diagonal is invalid. I’m working on the hourly wave counts now. All I can say at this stage is clearly the downwards move is over and for the bull it’s in the early stages of a third wave up, for the bear it’s in a second wave correction (which could be over as a triple zigzag).
I sold my TNA too early today…
Ben it’s great you went bullish and took profits. Lara’s charts had a lot of bearish in them last night. Been retracing since high today, already dropping 4 hours, not sure how low could go..
Yes, I will take the profits, even if they only buy me a set of tires. I started a long position in bonds in TMF today also.
It is the correct call. I sold my NUGT, bought at yesterday’s close, once the market opened today. Quickly put in a small position in DUST. I am now waiting for the first bounce back up to add to this position. It’s a rather long wait!
1192.44 high today was that minuette wave (i) or minute wave i circle? Does anyone have a retrace projection now? I already sold my GDX and looking for the next bottom today to buy cheaper.
Minuette 1. Minute 1 for the main bull (alternate eliminated) should be in the 1220-1230 region.
.618 retrace of today’s high 1192.44 at 8:25 am less low at 1175.32 at 12:12 am = 1181.86
.618 retrace of today’s high 1192.44 at 8:25 am less low 1162.80 Friday 9:25 am = 1174.12
Hourly Bull – “Leading diagonals in first wave positions are commonly followed by very deep second wave corrections. Minuette wave (ii) would be expected to be 0.618 or deeper of minuette wave (i). Minuette wave (ii) may not move beyond the start of minuette wave (i) below 1,162.80.”
Money Flows: Buying on Weakness | Selling on Strength | View Market & Sector Page Find Historical Data | WHAT’S THIS? Tuesday, June 09, 2015 – 5:33 pm ET VIEW AS SPREADSHEET
View on online.wsj.com
How low could this hourly bull retrace now?
“Leading diagonals in first wave positions are commonly followed by very deep second wave corrections. Minuette wave (ii) would be expected to be 0.618 or deeper of minuette wave (i). Minuette wave (ii) may not move beyond the start of minuette wave (i) below 1,162.80.”
In other land of PM shorts are wondering what happen here??? Gold up big time???? Hoping for gold to drop soon after back test.
Ben —— You wrote —: GDX was #9 on the buying on weakness list today with $70 million in money flow” ————- Where do you get access to this list???? ———- I got yr reply Thanks.
Your welcome. Make sure when you look at the reports that you are looking at the current date.
I tried to reply to your message, but for some reason it would only put the comment on top.
Papudi, just google ‘buying on weakness wsj’ and it will come up.
Looks like we are down to 2 hourly counts, the main hourly bull and the alternate hourly bear. For the bull count, Minuette 1 may be complete. For the bear count, Minute 2 may be complete as a rare triple zigzag. Either way if we don’t make another new high, we may go down from here until the next inflection point for the bull or bear counts probably around 1172.
For the Bears, the .382 retracement of the 1232 to 1162 down move has been hit at 1188. We likely go down from here or continue up to the .618 retrace at 1205. A move above 1205 and the bear case would be less likely but not invalid.
Ben —— You wrote —: GDX was #9 on the buying on weakness list today with $70 million in money flow” ————- Where do you get access to this list???? ———-Thanks.
Gold at 1188. Bull wave in the play. Wow!!!! Strong upward movement in gold. ——————- What is the target 1230ish???
Upside 1195-96 limiting – hope it does not get taken out, this is looking better and better for a great big short~! lol
I bought GDX at 18.77 near Tuesday close after initial bullish comments and gold looks bullish so far Wednesday.
No change in my strategy so far. Quick note – GDX was #9 on the buying on weakness list today with $70 million in money flow.
Sorry I missed your strategy. Long/short???
I am planning to go short tomorrow. All hourly wave counts point down for gold except one.
Hi Papudi, I am long at this point and have been for quite some time, currently at about a 10% profit. I am looking at the elliott waves above and I see some short term downward movement possible, followed by a few days to a week of upside. I believe that will coincide with closing some of the gaps on the miners that are open. Based on GDX options open interest, I am expecting GDX to get to $20.40-$20.70 or so (which is the bottom or top of that gap) by next Thursday/Friday. Because of that, and because of a significant amount of put volume in the $18 range being opened up recently, I feel like there is limited downside in the miners in the short term, with a move of 5-7% in GDX to the upside in the next week possible. I don’t like the weakness in gold and therefore will use the upturn between now and end of next week to sell my long positions. The only thing that might change my mind would be any bullish positioning in the COT or bullish views on the elliott wave work. So I am reserving the right to change my mind, but this is where I am convicted for now.