
Upwards movement was not over and a new high was made. Thereafter, price has again turned down, but is this the end of a trend or just a correction against the trend?
Summary: The strongest (and simplest) technical analysis presented below are trend lines. This suggests there may have been a trend change. The Elliott wave structure is again complete. but the situation is not completely clear yet and ADX is indicating no clear trend.
Update: Since preparation of this analysis, we have been focused on upgrading Elliott Wave Stock Market. Things did not go quite according to plan so publication of US Oil (and me looking for an entry point) was delayed. Today price has moved lower. I’ll still be using the 15 minute chart to find the next entry, or I may just jump in. However, with price now lower the risk is higher.
Changes and additions to last analysis are italicised.
Monthly Chart
Click chart to enlarge.
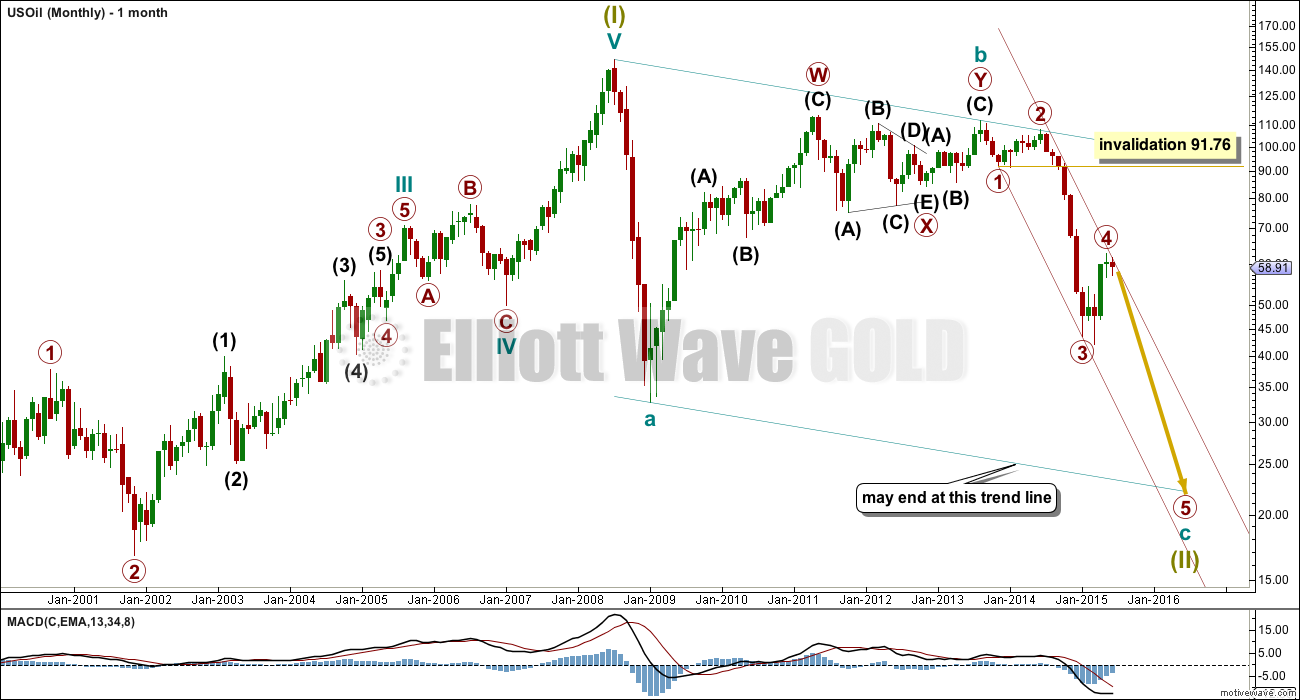
This wave count sees US Oil as within a big super cycle wave (II) zigzag. Cycle wave c is highly likely to move at least slightly below the end of cycle wave a at 32.70 to avoid a truncation. Cycle wave c may end when price touches the lower edge of the big teal channel about this zigzag.
Within cycle wave c, primary wave 5 is expected to be extended which is common for commodities.
Primary wave 4 may not move into primary wave 1 price territory above 91.76.
Draw a channel about this unfolding impulse downwards. Draw the first trend line from the lows labelled primary waves 1 and 3 then push up a parallel copy to contain all of primary wave 2. Copy this maroon trend line carefully over to the daily chart.
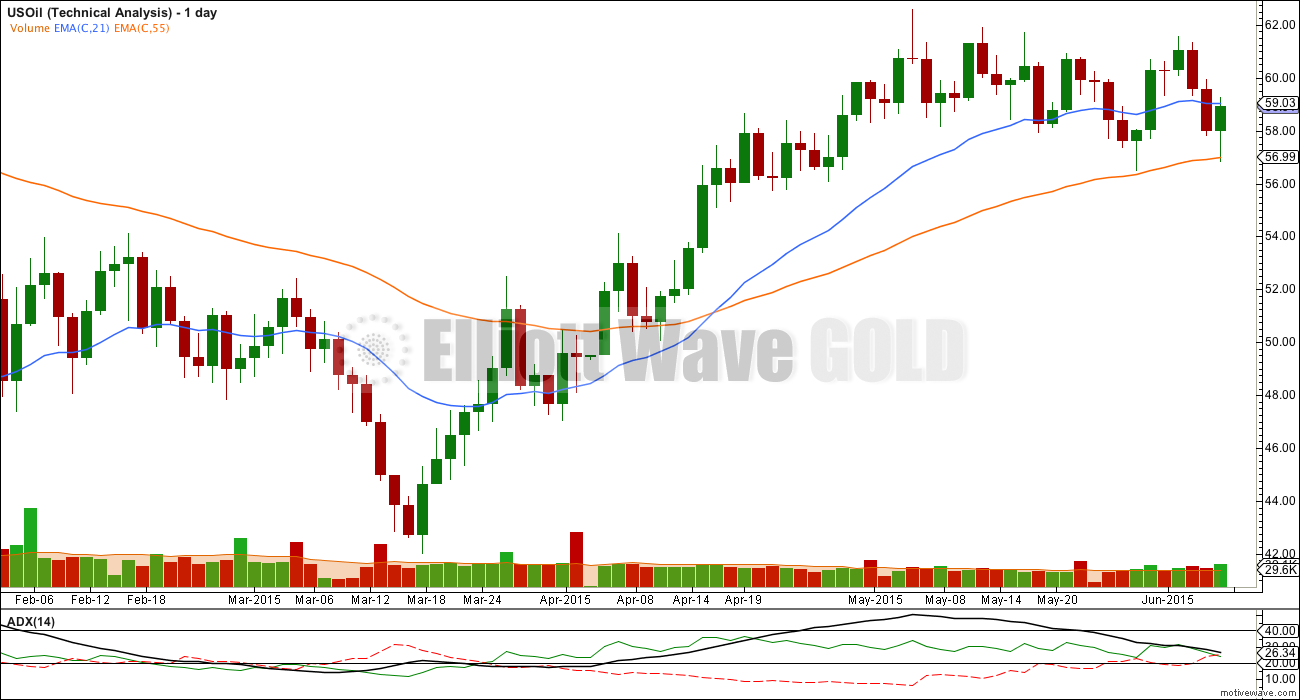
Daily Chart
Click chart to enlarge.
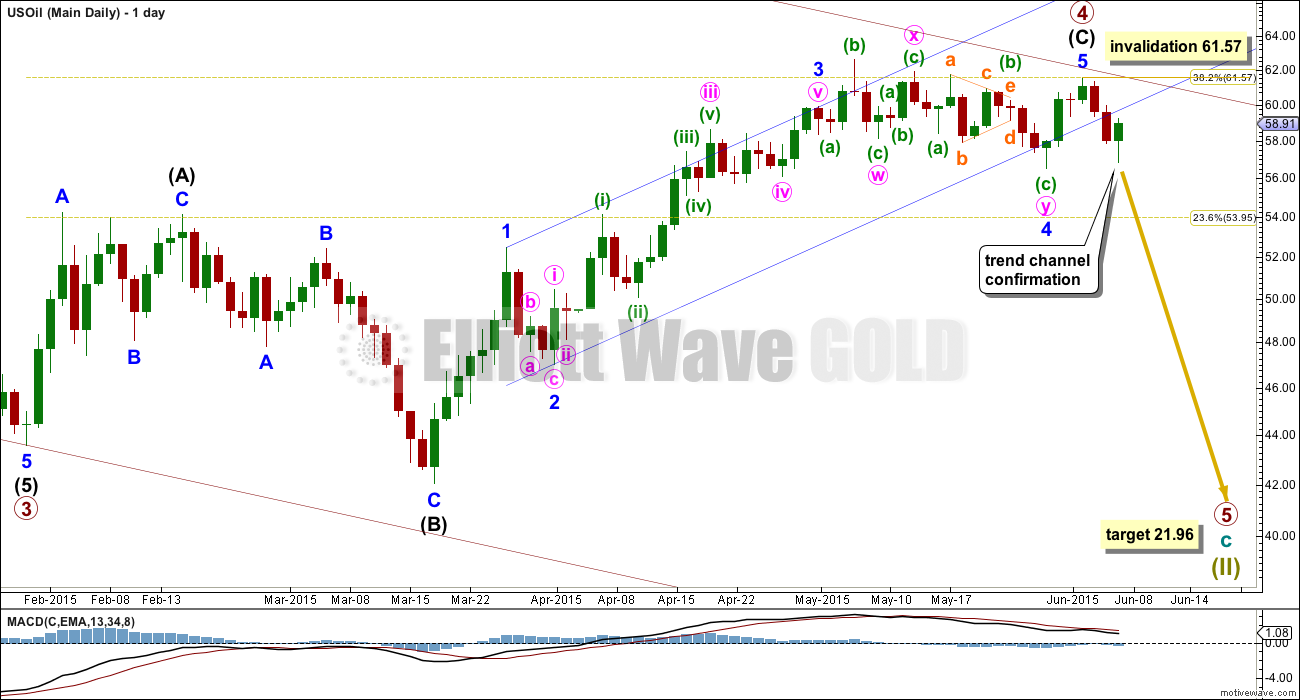
It looks again like upwards movement may be over for US Oil. Interestingly, if primary wave 4 has ended here, then it is absolutely a perfect 0.382 of primary wave 3 at 61.57.
The upper edge of the maroon channel from the monthly chart should provide strong resistance. So no matter how the smaller trend channel is drawn about intermediate wave (C) the upper downwards sloping maroon trend line is here the strongest piece of technical analysis. The only word of caution I would have regarding it is this channel has a strong slope on the monthly chart, because primary wave 3 was such a steep drop. The stronger the slope of a trend line the weaker it is.
If primary wave 4 is over, then there is no Fibonacci ratio between intermediate waves (A) and (C).
Ratios within intermediate wave (C) are: minor wave 3 has no Fibonacci ratio to minor wave 1, and minor wave 5 is now just 0.15 longer than 0.382 the length of minor wave 3.
The upwards sloping blue channel is drawn here using Elliott’s first technique. The second technique could also reasonably be used, because here with the first technique minor wave 4 is not contained properly within the channel. However, using this first technique it may be showing where upwards movement for Friday sees a throwback to the lower blue trend line.
I have been waiting for an entry point to US Oil to trade this fifth wave down. Commodities often produce very swift strong fifth waves which make good trading opportunities.
I will look for an entry point on Monday. My stop must be placed at 61.57, so when I find an entry point I will adjust my position size to limit exposure of my account. If my trade becomes positive within the first 24 hours, I will move the stop to just below the entry point after 24 hours, limiting risk to zero. If I am stopped out, I will wait again for another opportunity. If price moves against me in the first 24 hours, my risk will be at 61.57.
Entry Point
Click chart to enlarge.
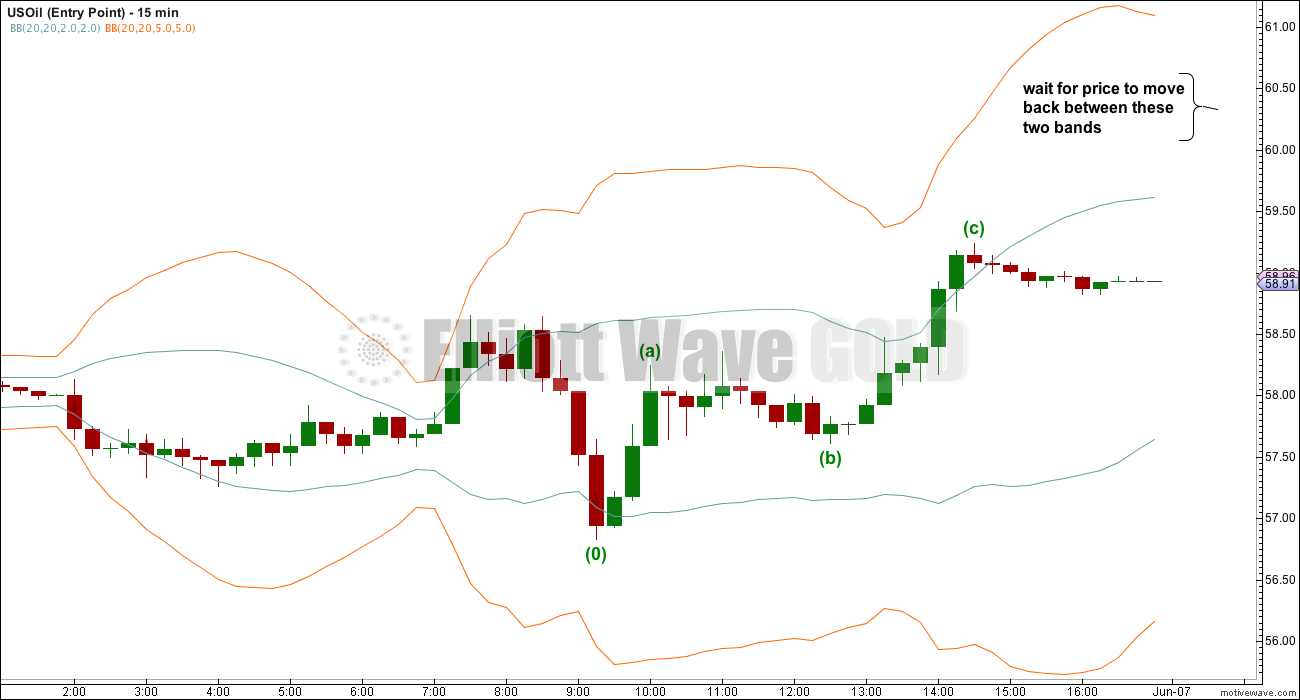
To find an entry point this is the technique I use. On a 15 minute chart, I need to see the last movement against the trend subdividing as a three, and it does. The first condition is met.
This 15 minute chart has two sets of Bollinger Bands: 2% and 5%. When price is between the two upper Bollinger Bands, on the side opposite to the direction expected (this is an unusual way to use Bollinger Bands) then I will enter a short with a stop at 61.57.
Trend Lines
Click chart to enlarge.
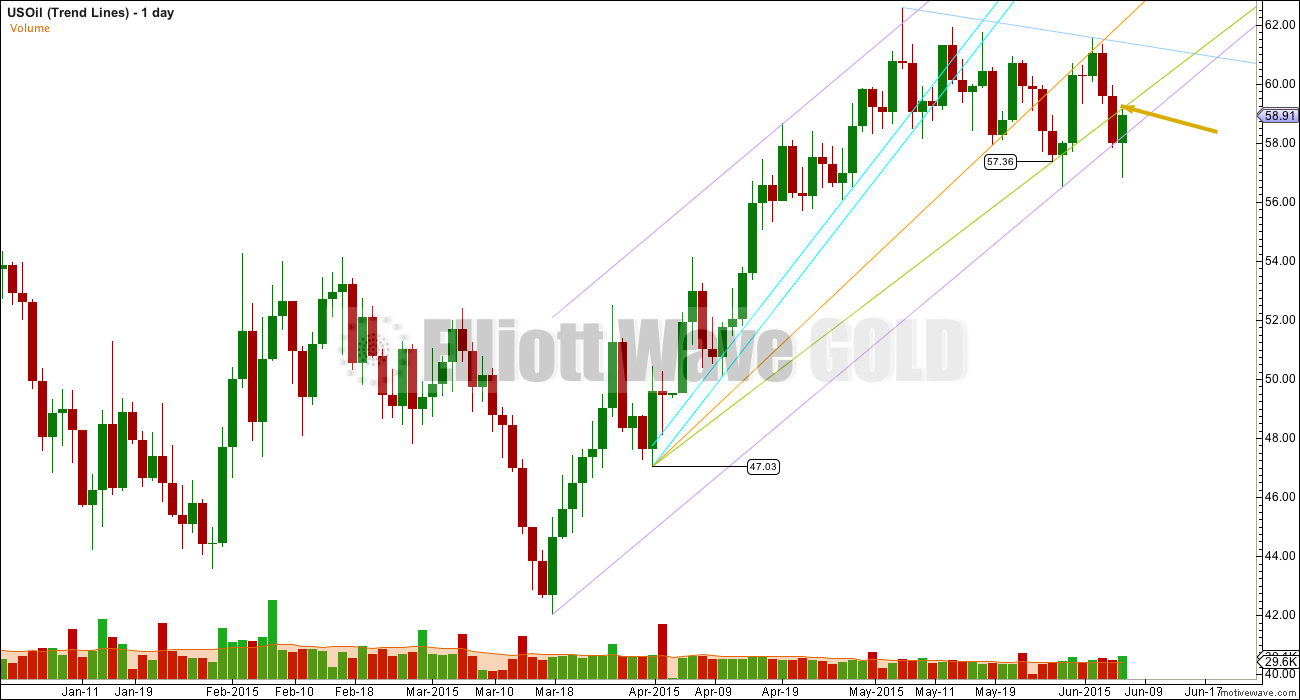
Price keeps breaking below upwards sloping trend lines. The two aqua blue lines are drawn using Magee’s approach as outlined in the classic “Technical Analysis of Stock Trends”. These were both breached days ago.
The other trend lines are my own.
The green trend line seems to be providing resistance, I have shown how it is drawn from the two price points. This may be a typical throwback, and downwards movement may begin to accelerate from here.
If price moves higher on Monday, if that green trend line is breached by upwards movement, I will hold off a trade on US Oil.
Technical Analysis
Click chart to enlarge.
It is concerning that ADX is declining. According to Kirkpatrick and Dahlquist, “Technical Analysis” page 443, rules provided by Ashwani Gujral for using ADX state “when ADX is declining and between 20 and 30 price is in consolidation; use oscillators”.
This is not indicating the start of a new trend. However, at the start of primary wave 3 I note that it was 20 days from the high before ADX indicated the downwards trend.
The shorter EMA still needs to cross below the longer EMA, and price needs to cross below the longer EMA before full confidence in a downward trend can be had.
I will be using trend lines and the EW count as the basis for a decision that I expect US Oil to move lower from here, but ADX and the EMA’s are indicating caution.
If I do enter a short on US Oil on Monday I will be most careful to ensure that upwards movement on the 15 minute chart is a clear three, not a five.
This analysis is published about 01:18 a.m. EST.
Lara: was US oil move on 6/10 a clear three not five? ———-I can not count EW.
So far it’s a three. And the downwards days of 11th and 12th June have not moved back into what could be the counterpart first wave price territory, so they could be a fourth wave and we may yet see a small final fifth wave up to a new high for US Oil, maybe to touch that maroon trend line? I’m stepping aside from this market for another week or so, I’ll redraw the lower trend line from the end of minor 2 to the last swing low and wait for that to be breached. Then I’ll wait for the throwback…. and if that all happens as expected I’ll try entering another short.
Lara: 6.10 US oil broke above 61.57 breifly and now 6/11 it is trading near 60.80. —–I am planning to take sizeble position below 60.50.
—————– What do u think? thanks.
I have found oil very difficult to trade. For example, we have gone sideways in a range for about a month now. Yet, oil is up almost 7% in the last 3 days (top to bottom). Not good to be short with that action.
well that was a quick stop out…oil up almost 10% in 4 days bottom tick to top tick. I bet no one saw that coming.
Nope. A small loss. I’ll wait for a while to see if that maroon trend line holds. If it does, then I’ll wait again for the next trend line breach and throwback before trying again.
Thanks for showing us how you determine your entry point!
You’re welcome, although in this instance it didn’t work on that day so well. I was unable to focus enough on trading while updating the website for EWSM, and so I’m entering a small trade on US Oil today at a higher rate = less risk. I’m not totally confident of my analysis though so I’ve reduced the size of my trade to manage risk. We shall see. 61.57 is the price point which will tell.