
Downwards movement was expected for Friday. The session did begin with some downwards movement, but price turned higher to complete a green candlestick for Friday which was not what was expected.
Price remains below the invalidation point on the hourly Elliott wave chart and is again finding resistance perfectly at the trend line on the daily chart.
Summary: The main wave count is still bearish and still expects the middle of a strong third wave down to begin from here. The target is slightly recalculated at 1,123.
To see weekly charts click here.
Changes to last analysis are bold.
BEAR ELLIOTT WAVE COUNT
Click chart to enlarge.
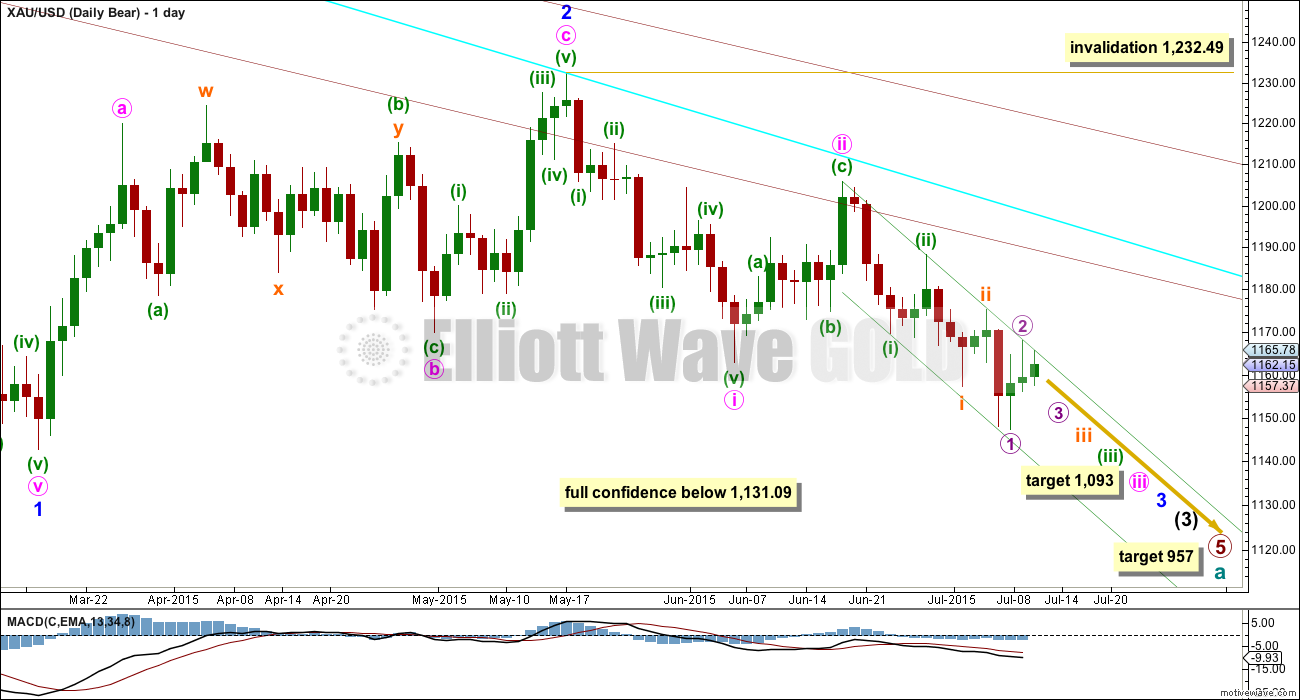
The bear wave count expects that cycle wave a is an incomplete impulse.
Within primary wave 5, the daily chart focuses on the middle of intermediate wave (3). Intermediate wave (3) has yet to show an increase in downwards momentum beyond that seen for intermediate wave (1).
The bear wave count has increased in probability with a new low below 1,162.80. Full confidence may be had in this wave count with a new low below 1,131.09.
Pros:
1. Intermediate wave (1) (to the left of this chart) subdivides perfectly as a five wave impulse with good Fibonacci ratios in price and time. There is perfect alternation and proportion between minor waves 2 and 4. For this piece of movement, the bear wave count has a much better fit than the bull wave count.
2. Intermediate wave (2) (to the left of this chart) is a very common expanded flat correction. This sees minor wave C an ending expanding diagonal which is more common than a leading expanding diagonal.
3. Minor wave B (to the left of this chart) within the expanded flat subdivides perfectly as a zigzag.
4. Volume at the weekly and daily chart continues to favour the bear wave count. Since price entered the sideways movement on 27th March, it is a downwards week which has strongest volume and the downwards day of 9th April which still has strongest volume.
5. On Balance Volume on the weekly chart breached a trend line from back to December 2013. This is another bearish indicator.
Cons:
1. Intermediate wave (2) (to the left of this chart) looks too big on the weekly chart.
2. Intermediate wave (2) (to the left of this chart) has breached the channel from the weekly chart which contains cycle wave a.
3. Within minor wave 1 down, there is gross disproportion between minute waves iv and ii: minute wave iv is more than 13 times the duration of minute wave i, giving this downwards wave a three wave look.
4. Minor wave 2 is much longer in duration than a minor degree correction within an intermediate impulse normally is for Gold. Normally a minor degree second wave within a third wave should last only about 20 days maximum. This one is 44 days long.
Minor waves 1 and 2 are complete. Minute waves i and ii are also complete. Gold may be ready to move to the strongest middle of intermediate wave (3).
Minute wave ii may not move beyond the start of minute wave i above 1,232.49.
Minute wave ii is now very likely to be over here. If it moves any higher, then it should find strong resistance at the blue trend line.
At 1,093 minute wave iii would reach 1.618 the length of minute wave i. If minute wave iii ends in a total Fibonacci twenty one days, then this target may be reached in another five days time.
Draw a base channel about minuette waves (i) and (ii) as shown (green trend lines). Look for upwards corrections along the way down to continue to find resistance at the upper edge of that channel. When the strongest part of downwards movement arrives, then it may have the power to break through support at the lower edge of the channel. For now this channel is perfectly showing where price is finding support and resistance. This channel is drawn in the same way on the daily and hourly charts, but the daily chart is on a semi-log scale and the hourly is arithmetic. Use the channel on the daily chart as a guide.
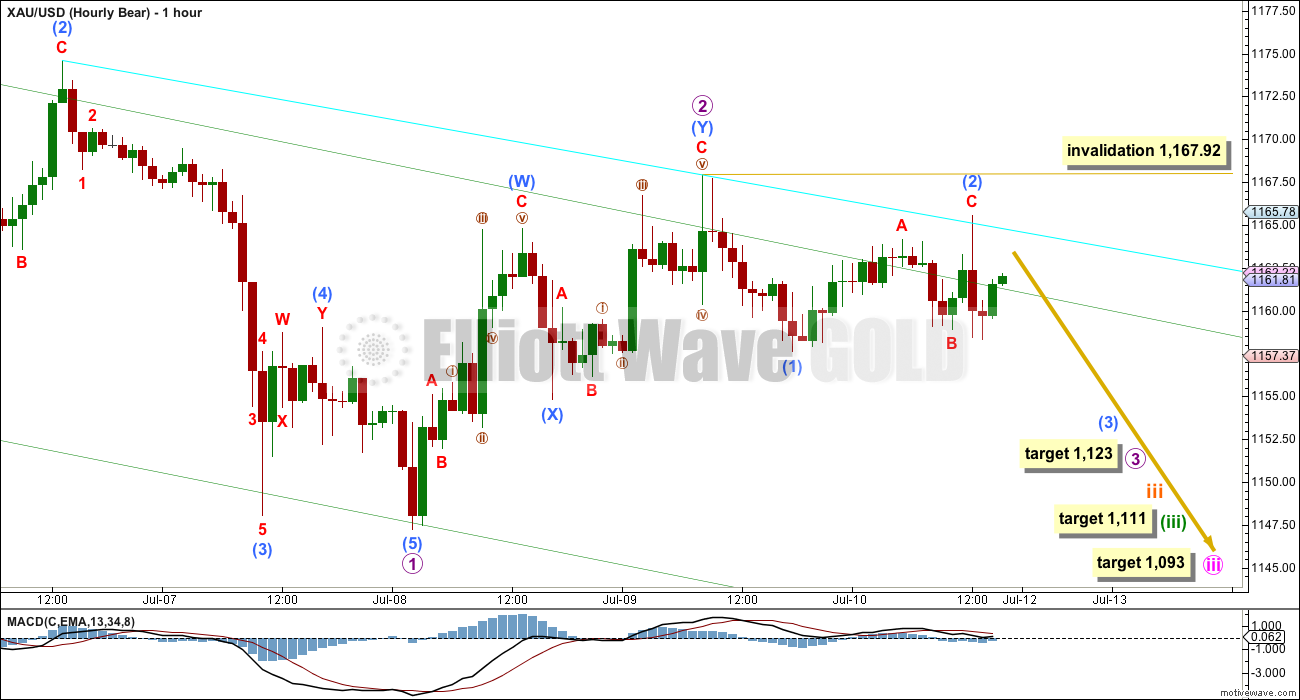
HOURLY BEAR ELLIOTT WAVE COUNT
Click chart to enlarge.
This hourly chart works in exactly the same way for the bull wave count. The only difference for the bull wave count is the degree of labelling would be one degree lower.
Upwards movement continues to look clearly corrective and finds resistance at the upper edge of the channel on the daily chart. I have drawn a trend line on the hourly chart across the last two highs because the channel copied over from the daily chart is not perfect at the hourly chart level (the charts are on different scales). The aqua blue trend line may be useful to show resistance at the hourly chart level.
I have checked the subdivisions for submicro wave (1) on the one and five minute charts. There is a lot of overlapping within that downwards wave, but it can be seen as an impulse. Submicro wave (2) looks like a very strong three wave structure. It would most likely be over now.
Within micro wave 3, no second wave correction may move beyond the start of its first wave above 1,167.92.
If price moves above 1,167.92, then it is still possible that micro wave 2 may be continuing sideways as a double combination: zigzag – X (triangle) – second structure. If that happens, then I would expect upwards movement to end close to 1,167.92 because combinations should move sideways and don’t have a clear slope. The second structure in the double normally ends very close to the same level as the first. This is technically possible, but highly unlikely because it would mean the parallel channel on the daily chart would be overshot.
At this stage, with the strong third wave still not yet showing itself, I am not concerned that there has been a trend change. Upwards movement is on light volume, which is important. If upwards movement is a new trend, then it must show an increase in volume. That it does not, that it is happening on weakening volume, indicates it must be a correction against the trend.
There is no indication that the trend has changed to up; all indicators are that the downwards trend is not just intact but still in its early stages.
The upper edge of the parallel channel on the daily chart has now been tested six times since it began. That this trend line is holding perfectly indicates strong resistance.
The last small wave down on the five and one minute charts is a very clear five.
At 1,111 minuette wave (iii) would reach 2.618 the length of minuette wave (i). If minuette wave (iii) lasts a total Fibonacci thirteen days, then this target would be four days away.
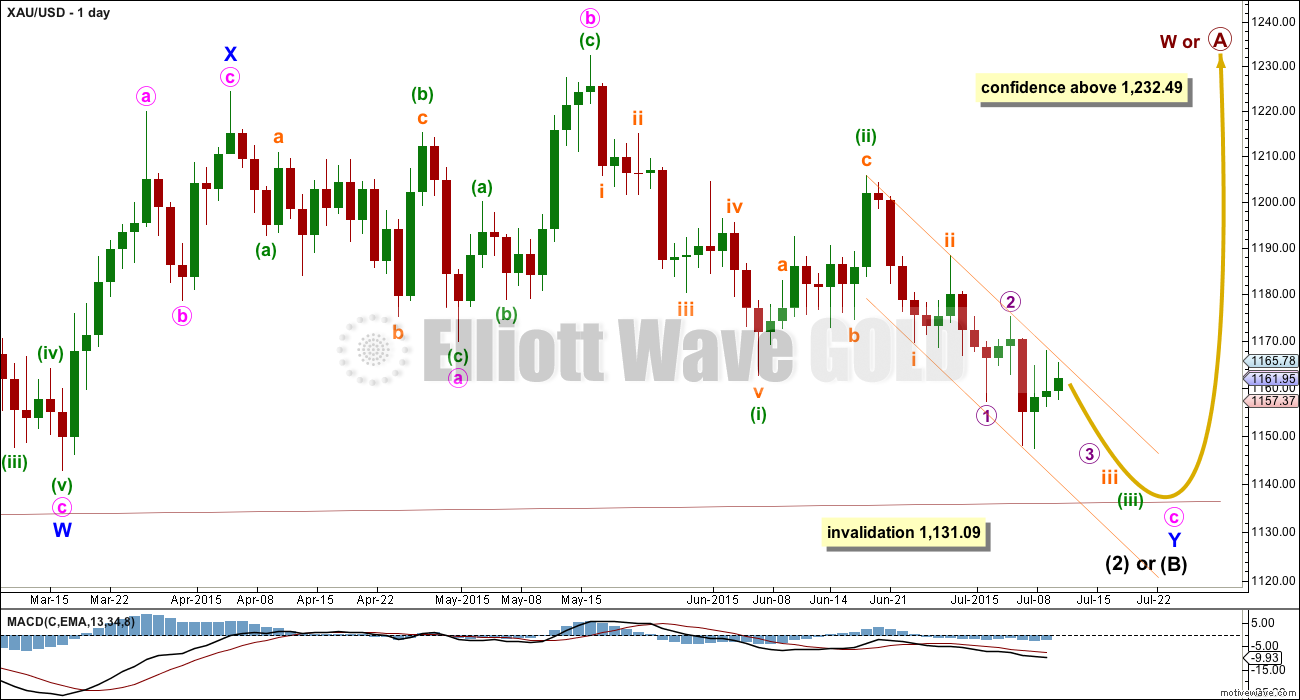
BULL ELLIOTT WAVE COUNT
Click chart to enlarge.
This bull wave count looks at the possibility that cycle wave a is a complete impulse and that cycle wave b began back at 1,131.09. Within cycle wave b, primary wave A is incomplete and subdividing either as a zigzag or an impulse.
Pros:
1. The size of the upwards move labelled here intermediate wave (A) (to the left of this chart) looks right for a new bull trend at the weekly chart level.
2. The downwards wave labelled minor wave W looks best as a three.
3. The small breach of the channel about cycle wave a on the weekly chart would be the first indication that cycle wave a is over and cycle wave b has begun.
Cons:
1. Within intermediate wave (3) of primary wave 5 (to the left of this chart), to see this as a five wave impulse requires either gross disproportion and lack of alternation between minor waves 2 and 4 or a very rare running flat which does not subdivide well. I have tried to see a solution for this movement, and no matter what variation I try it always has a problem which substantially reduces its probability.
2. Intermediate wave (5) of primary wave 5 (to the left of this chart) has a count of seven which means either minor wave 3 or 5 looks like a three on the daily chart.
3. Expanding leading diagonals (of which intermediate wave (A) or (1) is) are are not very common (the contracting variety is more common). There is also now a second expanding leading diagonal for minute wave i.
4. Volume does not support this bull wave count.
5. Intermediate wave (B) or (2) may only be continuing as a double combination. Minor wave X is shallow, and X waves within double combinations are normally very deep. This one looks wrong.
Volume for 8th July shows a strong increase for an up day at 218.9K. It is stronger than all the prior down days since Gold entered the sideways consolidation back on 27th March except for one, that of 9th April at 230.3K.
Intermediate wave (A) (to the left of this chart) subdivides only as a five. I cannot see a solution where this movement subdivides as a three and meets all Elliott wave rules (with the sole exception of a very rare triple zigzag which does not look right). This means that intermediate wave (B) may not move beyond the start of intermediate wave (A) below 1,131.09. That is why 1,131.09 is final confirmation for the bear wave count at the daily and weekly chart level.
The only option now for the bull wave count is to see intermediate wave (B) or (2) continuing sideways as a double combination. The first structure in the double is a zigzag labelled minor wave W. The double is joined by a brief three in the opposite direction labelled minor wave X, a zigzag. The second structure in the combination is an expanded flat labelled minor wave Y which is incomplete.
Within minor wave Y, minute wave b is a 1.15 times the length of minute wave a indicating an expanded flat. Both minute waves a and b are three wave structures.
Minute wave c downwards must subdivide as a five, and because the first wave within it is an impulse and not a zigzag minute wave c may only be unfolding as an impulse.
Within minute wave c downwards, the third wave is incomplete for minuette wave (iii). At the hourly chart level, this bull wave count sees the subdivisions in exactly the same way as the bear (the bull sees everything one degree lower) so the hourly charts are the same. For this reason I will publish only hourly charts for the bear because they work in exactly the same way for the bull.
There does not look to be enough room for minute wave c to complete as a five wave impulse and remain above the invalidation point at 1,131.09. This is now the biggest problem with the bull wave count.
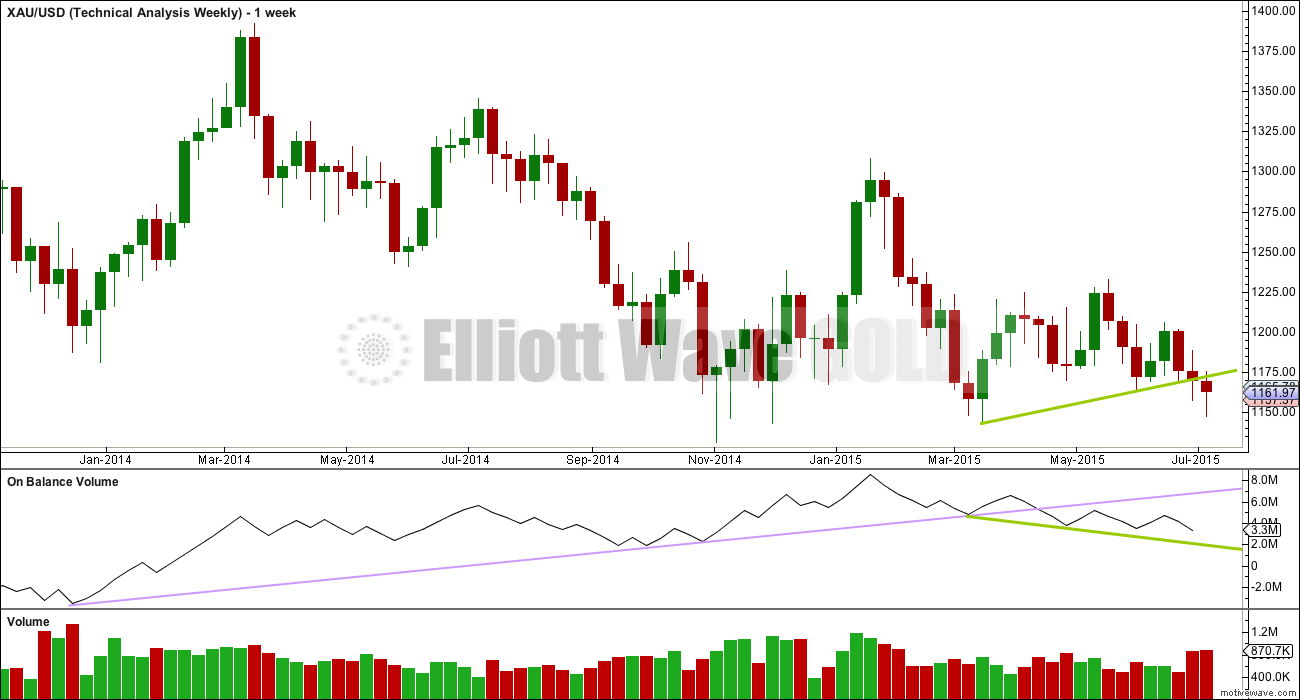
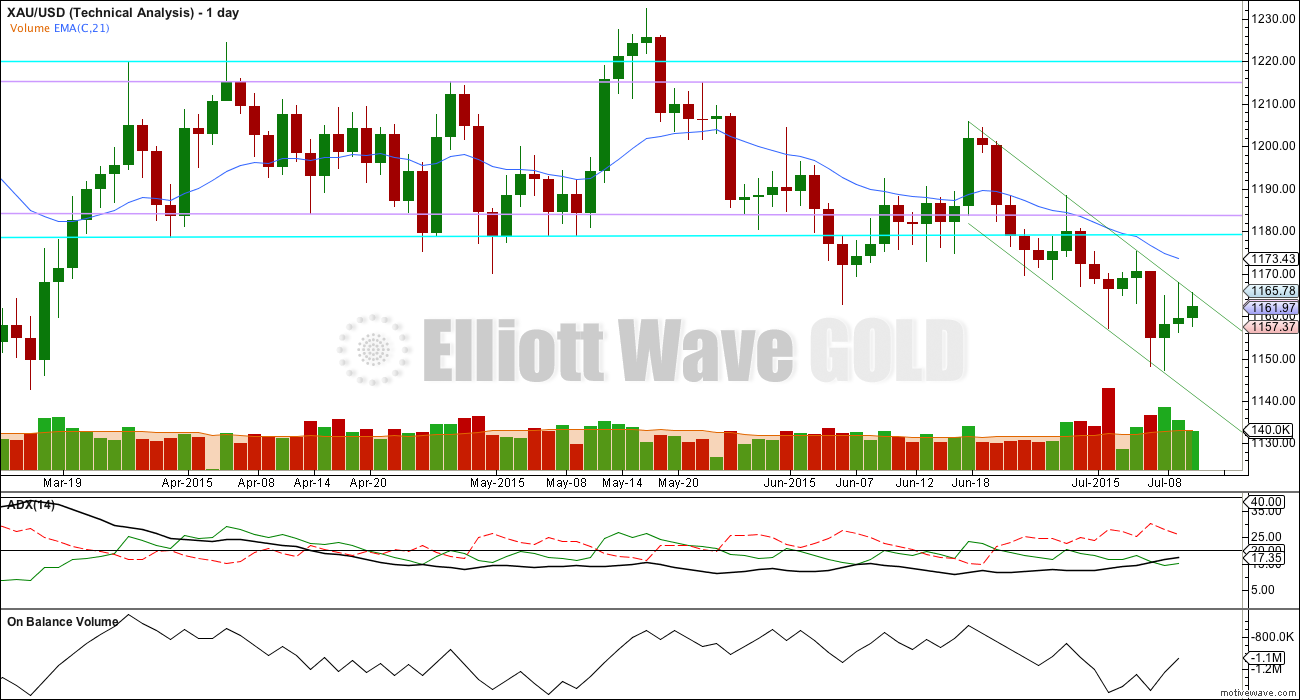
TECHNICAL ANALYSIS
Click chart to enlarge.
Weekly Chart: Overall volume still favours a downwards breakout which may now be underway. During this sideways movement, it is still one down day and a down week which have higher volume. On Balance Volume breaches a trend line (lilac line) which began in December 2013, and the breach is significant.
While price has made higher lows, On Balance Volume has made lower lows (green trend lines). This small rise in price is not supported by volume, and it is suspicious. Price is now breaking below support at the green trend line, which is another bearish indicator.
At the weekly chart level, volume is strongest in a down week. Overall volume up until two weeks ago volume was declining, typical of a maturing consolidation. Each series of down weeks includes a week with stronger volume than the following series of up weeks. The last two weeks has seen downwards volume increase as price breaks below the green trend line. A breakout should come with increasing volume, which looks like what is happening. This week has slightly higher volume than last week, and the fall in price is supported by volume.
Click chart to enlarge.
Daily Chart: The ADX line is above 15 and still rising, which indicates that price may be in the earliest stages of a new trend. The -DX line is still above the +DX line, which indicates the trend is down.
Three small green candlesticks in a row have come with clearly declining volume. This rise in price is clearly not supported by volume and is suspicious. If this rise in price is a correction, then it should show lighter volume which supports the wave count.
This analysis is published about 04:23 p.m. EST.
Bought DUST today at 21.154 at 3:58 pm, gold closed at 1157.96.
Cheaper than bought DUST Friday at 21.235 at 3:59:514 gold closed at 1163,
which I sold today at 9:41 am 4 minutes before DUST high of the day.
DUST closed cheaper today at higher gold price because of 2 hours of upward gold momentum since about 2 pm dropped price of DUST a lot.
Lucky that at 4:08 pm today Lara confirmed, “Yes, definitely Gold should drop this week.”
Looks like a series of 1’s and 2’s.
Those never pan out!
Thats not correct.
When third waves extend then they do begin with a series of 1-2, 1-2. And when it develops into a third wave extension then yes, it does pan out.
And third wave extensions are very common. So it’s actually very common for them to begin in this way.
Lara is gold expected to drop deep again this week?
Does gold only have a big bounce once hits 1111 or before?
Yes, definitely Gold should drop this week.
The targets are all the same. The expectations are all the same.
The upper edge of that channel continues to provide resistance. Its now been tested seven times on the daily chart. That’s significant.
My only concern today would be low volume for a down day.
ADX is still rising, it’s above 15. Over the last 18 days overall Gold is putting in lower highs and lower lows.
It looks reasonably clear that the trend is down. There can be no argument that for the last 18 days the trend has been down. As we have expected it to be.
MACD shows only the smallest increase in downward momentum ATM. The bear wave count expects that to substantially increase. Maybe (hopefully!) this week?
Lara, the inverse etf for silver is so “un” predictable. Could you throw us an update or some hourly charts on Silver?
I will update Silver this week. It may not be today though.
Darn. Ok, but please try to do before any BIG moves. It helps.
I’ll probably just put up charts later today.
NUGT volume already at 3 month average. Looking for a big spike in NUGT volume and a big spike in DUST volume.
GDX tested support from November this morning.
I am curious what count we have here since we have crossed into subminuette wave i price territory. Seems like that shouldn’t have happened.
Keeping an eye on 1162.83, Minuette wave i ending.
The degree of labeling will likely need to go down as Lara suggests in the analysis below the hourly chart.
Sold my DUST and took my 5% profits a few minutes before today’s peak.
Took a chance and bought it Friday night, and good gold crashed this morning.
Lara’s downward surprise she warns us about.
Finding intraday trades may be better than holding DUST for days as big swings up then drops each day.
You called Friday’s purchase right on DUST. I was too unnervy (if thats a word) with if Greece’s issues could alter course so I decided to stay out over weekend. Looking for my next buy in. Great trade!
DUST was a flip of the coin Friday night except for “surprises likely to be to the downside”. Greece deal was in doubt right up to 3 am Monday. So I only bought a little of DUST to reduce the risk. Then sold it at first high today as profits disapear fast everyday.
From his position on the fence, Clive Maund presents the non-EW arguments for the bull and bear cases:
http://www.clivemaund.com/gmu.php?art_id=68&date=2015-07-12
I think he wants to be bullish but is nervous about the size of the potential drop if the bears are right.
I find it difficult to believe that gold and silver are going to plummet with the commercials positioned bullishly.
Added JNUG at 13.90
Good luck trading against the trend (and against EWP)
Ben, are you keeping up with Martin Armstrong? Would be interesting to hear his current opinion on gold.
Edit: I see Armstrong just posted a blog article on gold–but he is difficult to understand, will appreciate anyone who follows his cycle theories to interpret his latest gold opinion.
Would you mind posting the article from him you saw? I know he was expecting a move down when we were in the 1205 range.
Ben, I probably mis-spoke, sometimes my keyboard hands do not accurately translate what’s in my mind.
I did not read Armstrong’s article, I received an email from an acquaintance who follows Armstrong’s work, so my information is 2nd hand, that’s why I was asking for anyone to clarify. Here are comments I received. They are an interpretation of Armstrong’s work.
“I have written about gold breaking $1,000 extensively. The benchmark is $939.50. If gold break below $939.50 – – and then – – goes above $939.50 again then I assure you that – – only then – – THE LOW will be in”
Added NUGT at 6.43
Rambus public post. He expects the bottom to be in October.
Weekend Report…Gold’s Peculiar 6 Month Cycles .
http://rambus1.com/?p=40532
My target is anytime between Nov and June.
Matt is that June 2015 or 2016?
June 2016, but I feel better about it occurring by the end of 2015. I base these times on the lengths of previous waves.
Gold just dropped down quickly to 1154.47 at 3:23 am EST the lowest price since July 8th. Now at 3:40 am EST gold is going down even lower but I have to go to sleep. Thankfully I bought DUST and hope it’s still down at the NYSE open. Looking to sell it Monday at a swing low before intraday bounce.
Meanwhile there is a Greece deal done, which may need Greek parliament to ratify it by Wednesday or else. Seems news changes with updates every half hour in their 15 hour negotiation marathon.
Greece gets bailout deal after all-night eurozone summit – July 13, 2015 3:08 a.m. ET
http://www.marketwatch.com/story/greece-gets-bailout-deal-after-all-night-eurozone-summit-2015-07-13
Uncertainty over Greece keeps euro under pressure – July 12, 2015 6:50 p.m. ET
http://www.marketwatch.com/story/uncertainty-over-greece-keeps-euro-under-pressure-2015-07-12
This may end being – EURO down, US Dollar up, gold down.
…. Gold price needs to see a break below 1159; the downside remains a concern though with the lower band at 1150; an upturn in MacdMA seems to indicate a possible short term rally within the next few bars…. Looking forward to seeing Gold price commence its downward journey for 112x though; I guess one just has to be patient….~!
Gold just dropped down to 1159.46 at 12:38 am getting closer to breaking below 1159 you mentioned.
Gold dropped to 1154.08 at 3:40 am EST.
Someone posted a triangle pattern a while back, don’t recall who that was but it was looking for an E wave up to the 1220 region. If someone reading this presented that chart, I am curious whether you think it’s still in play or not.
It was posted by Jaf (John).
It was not a valid EW count. It violated a rule.
Thanks.
COT Data need to improve before gold goes down????
Last three weeks comm shorts have been declining. A spike in gold should increase commercial short with that gold will reverse to 3rd wave down?????? may be.
7/10 Commercial shorts 298834, Spec long: 192322
7/6 Commercial shorts 310288, Spec long: 196675
6/26 Commercial shorts 323360, Spec long: 207208
6/19 Commercial shorts 305813, Spec long: 195521
6/12 Commercial shorts 300870, Spec long: 189725
How accurate does COT forecast gold?
Is it more accurate or less accurate than EW?
It’s not accurate for short term moves. Only really helpful for the bigger picture IMO.
Jack Chan sums COT up very simply every week on Gold Eagle. Report comes out on Saturdays.
Notice that support or resistance often fails after the 3rd touch. Looks like GLD is ready to breakdown. Chart from Jackdamn on Stocktwits.
Third time’s a charm! 🙂
Dreamer, good call, today it broke down GLD dropped to 110.43 low.
Bought DUST at the close when it dropped. Waiting for Greece to close the deal Sunday so gold can drop by Monday’s open.
Matt, a continuation from previous forum. You appear very EW savvy and willing to trade gold’s move down, why would you not trade a major gold move up using EW? Your investment decisions certainly none of my business, I just mean is there some tactical reason you would trade a gold move down but not a gold move up?
“That said, I personally take a different view on this because I feel that it is extremely difficult to judge where gold is in its wavecount on a multi-year/ multi-decade level. When the time comes, I will make a longer term investment instead of trading the up move. The popular targets are $5000-8000, based on where gold should be in today’s dollars.”
Maybe he meant didn’t want to trade bullish right now as Lara’s warns against it due to bearish breakout risk?
IMO the move down to 950 should take 6 months or less. That’s a short enough period of time to withstand the high level of stress that I go through to trade. I uses futures, which are high reward but also very high risk. I just can’t do this for longer periods of time mentally. Have a regular job and family too.
The upswing, which you anticipate to be 2-3 years, will IMO take considerably longer (5-10 years). I just don’t feel the need to torture myself for that long. Would rather just take the winnings from this downleg and use them for longer term investments, including gold. So, it is really just a personal choice on how much risk and stress I want to endure.
To add to what I just answered, I would say that if gold does move to 950 over the next few months and completes clear 5 wave structures – both on intermediate and primary levels – the most likely next move would be an ABC correction to 1550 (0.618 of move from 1921 to 950). That might take 3 years and the A & B waves will likely not take gold very high – the C wave will be the strongest, or the one that moves the most.
I realize that may contradict what I say about a big multiyear upswing to $5000. However, the way I see it, whichever of the 2 outcomes occurs, the next 2 years may be more mellow and quiet; the C wave or the more extreme case of gold doubling or tripling will be a gradual exponentially growing trajectory. That’s another reason to not trade this, but rather invest in it.
Matt, thanks for your answer. You obviously have a well thought out strategy which I appreciate hearing from someone with your ability as I am mostly mid to long term. I follow short term trades here but only take an occasional short term position.
I would call it experience and not ability. Have made plenty of mistakes too, but thanks for the compliment.
I wouldn’t underestimate the power of a primary A wave up if we bottom near 950. Gold could shoot up like a spring after the long run down. NUGT and JNUG could go up 300% or more before the primary B wave starts. Then another 300% + on the primary C wave to complete cycle B, then more down. Big money to be made. Sounds way too easy, but it never is… First we need to find the elusive bottom.
Exactly! Never did I think that gold would be trading more or less sideways for about two years. However, it looks like the long awaited moment may finally be arriving.
You may be correct about a quick bounce for that A wave.
Lara has A peak as very time consuming.
Only time will tell?
$HUI is breaking down.
http://thedailygold.com/more-weakness-ahead-in-precious-metals-complex/
Dreamer, thanks for the link to the great article and charts.
Thanks Richard. You’re posts are informative also. Just trying to share some of the good info that I read. Hopefully it helps us all meet our goals. Bob.