
Price continues to fall exactly as expected.
The Elliott wave count remains the same, and all targets are the same.
Summary: Downwards movement should continue. Price is today finding support at the green channel. On the hourly chart, the new red channel may show where the next small correction finds resistance. The next move down may break below the green trend line, and if it does, then expect downwards momentum to increase strongly, but it may not be very strong until some fifth waves arrive.
To see weekly charts click here.
Changes to last analysis are bold.
MAIN ELLIOTT WAVE COUNT
Click chart to enlarge.
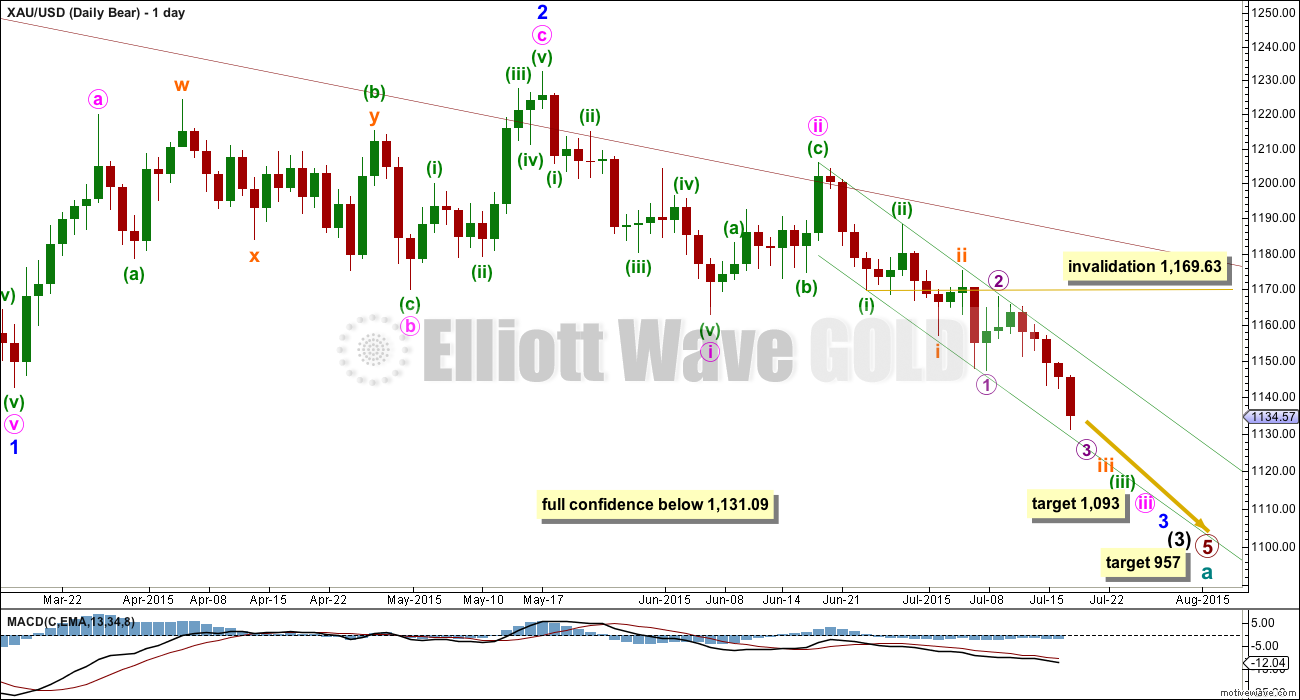
The main wave count expects that cycle wave a is an incomplete impulse.
Within primary wave 5, the daily chart focuses on the middle of intermediate wave (3). Within intermediate wave (3), minor wave 3 has yet to show an increase in momentum beyond that seen for the end of minor wave 1 at the left of the chart. This is why I still expect to see more downwards movement to show a further increase in downwards momentum.
This wave count has increased in probability with a new low below 1,162.80. Full confidence may be had in this wave count with a new low below 1,131.09. The low on my data feed for Friday is at 1,131.22, so we don’t quite have full confirmation.
Pros:
1. Intermediate wave (1) (to the left of this chart) subdivides perfectly as a five wave impulse with good Fibonacci ratios in price and time. There is perfect alternation and proportion between minor waves 2 and 4. For this piece of movement, the bear wave count has a much better fit than the bull wave count.
2. Intermediate wave (2) (to the left of this chart) is a very common expanded flat correction. This sees minor wave C an ending expanding diagonal which is more common than a leading expanding diagonal.
3. Minor wave B (to the left of this chart) within the expanded flat subdivides perfectly as a zigzag.
4. Volume at the weekly and daily chart continues to favour the bear wave count. During the consolidation from 27th March to 30th June (about), it was four down days which had the strongest volume (pinpointed on the daily TA chart).
5. On Balance Volume on the weekly chart breached a trend line from back to December 2013. This was another bearish indicator.
Cons:
1. Intermediate wave (2) (to the left of this chart) looks too big on the weekly chart.
2. Intermediate wave (2) (to the left of this chart) has breached the channel from the weekly chart which contains cycle wave a.
3. Within minor wave 1 down, there is gross disproportion between minute waves iv and ii: minute wave iv is more than 13 times the duration of minute wave i, giving this downwards wave a three wave look.
4. Minor wave 2 is much longer in duration than a minor degree correction within an intermediate impulse normally is for Gold. Normally a minor degree second wave within a third wave should last only about 20 days maximum. This one is 44 days long.
Minor waves 1 and 2 are complete. Minute waves i and ii are also complete. Gold may be ready to move to the strongest part of intermediate wave (3).
Minute wave ii cannot now continue any further. Minute wave iii is underway and may only subdivide as an impulse. Minuette wave (iv) within this impulse may not move into minuette wave (i) price territory above 1,169.63.
At 1,093 minute wave iii would reach 1.618 the length of minute wave i. If minute wave iii ends in a total Fibonacci thirty four days, then this target may be reached in another thirteen days. Because minute wave ii shows on the daily chart so strongly it is extremely likely that minute wave iv will also. Minute wave ii lasted nine days and minute wave iv may be 0.618 the duration about a Fibonacci five days in total. Of all the third wave targets calculated, it is the end of minute wave iii which is the most likely to be where a multi day interruption to this trend arrives.
Draw a base channel about minuette waves (i) and (ii) as shown (green trend lines). Look for upwards corrections along the way down to continue to find resistance at the upper edge of that channel. When the strongest part of downwards movement arrives, then it may have the power to break through support at the lower edge of the channel. For now this channel is perfectly showing where price is finding support and resistance. The daily chart is on a semi-log scale and the hourly is arithmetic. Use the channel on the daily chart as a guide.
If the green channel is breached to the upside, then my wave count may be wrong.
HOURLY ELLIOTT WAVE COUNT
Click chart to enlarge.
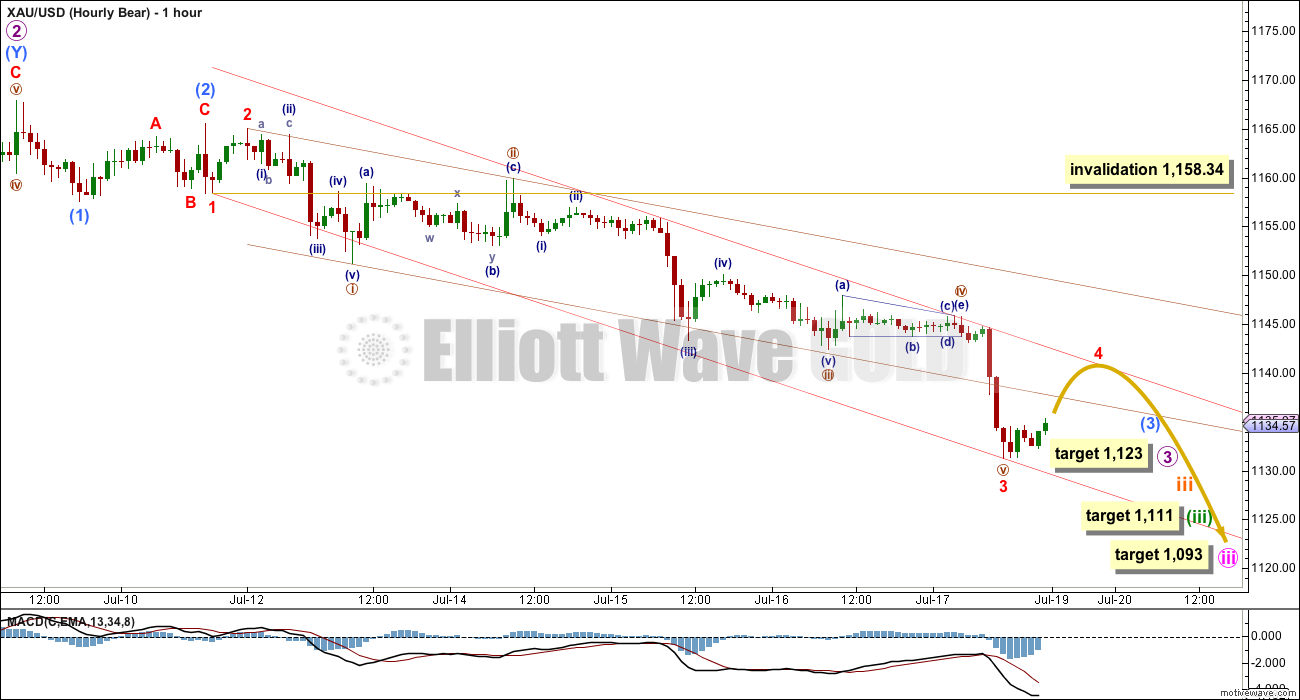
I am moving everything within micro wave 3 all back up one degree. I am struggling with what degree to label this movement, but whatever degree it is labelled the lines of resistance remain the same, the target at minute degree will be the same at 1,093, and the direction will be the same.
Within the last wave down, it was the fifth wave which exhibits the strongest downwards momentum. This is typical of Gold and other commodities. It may be replicated again for the ends of one or more of these third waves.
Ratios within minuscule wave 3 are: there is no Fibonacci ratio between nano waves i and iii (brown circle), and nano wave v is 0.72 longer than equality in length with nano wave i.
Nano wave v exhibited the strongest downwards momentum. Nano wave ii was a deep 0.63 zigzag and nano wave iv was a shallow 0.19 regular contracting triangle; there is perfect alternation between them.
Ratios within nano wave iii are: subnano wave (iii) (navy blue) has no Fibonacci ratio to subnano wave (i), and subnano wave (v) is 0.70 short of 0.618 the length of subnano wave (iii).
The brown channel is a base channel about nano waves i and ii. Draw the first trend line from the start of nano wave i to the end of nano wave ii, then place a parallel copy on the end of nano wave i. In the first instance, look for upwards movement to find resistance at the lower edge of this channel now that it is breached. If this trend line is breached, then the next line of resistance is the upper edge of the red channel.
The red channel is drawn about submicro wave (3). Draw the first trend line from the ends of minuscule waves 1 to 3 (red), then place a parallel copy up on the end of nano wave iv to contain the whole movement. Minuscule wave 4 may end when upwards movement comes to touch this red trend line. If that line is breached, then look for the next line of resistance to be the upper edge of the brown channel. The upper edge of the red channel is the most likely place for this fourth wave to end.
Minuscule wave 4 may not move into minuscule wave 1 price territory above 1,158.34.
Micro wave 3 would reach 1.618 the length of micro wave 1 at 1,123. Micro wave 4 may or may not show up on the daily chart. Micro wave 2 did show up on the daily chart with two green candlesticks lasting one and a half days.
At 1,111 minuette wave (iii) would reach 2.618 the length of minuette wave (i). Minuette wave (iv) may or may not show up on the daily chart. Minuette wave (ii) shows up lasting three candlesticks, but for Gold often its fourth waves are quicker than its second waves giving its impulses a curved look (there is perfect example of this for subnano wave (iii) within nano wave iii on this hourly chart).
ALTERNATE ELLIOTT WAVE COUNT
Click chart to enlarge.
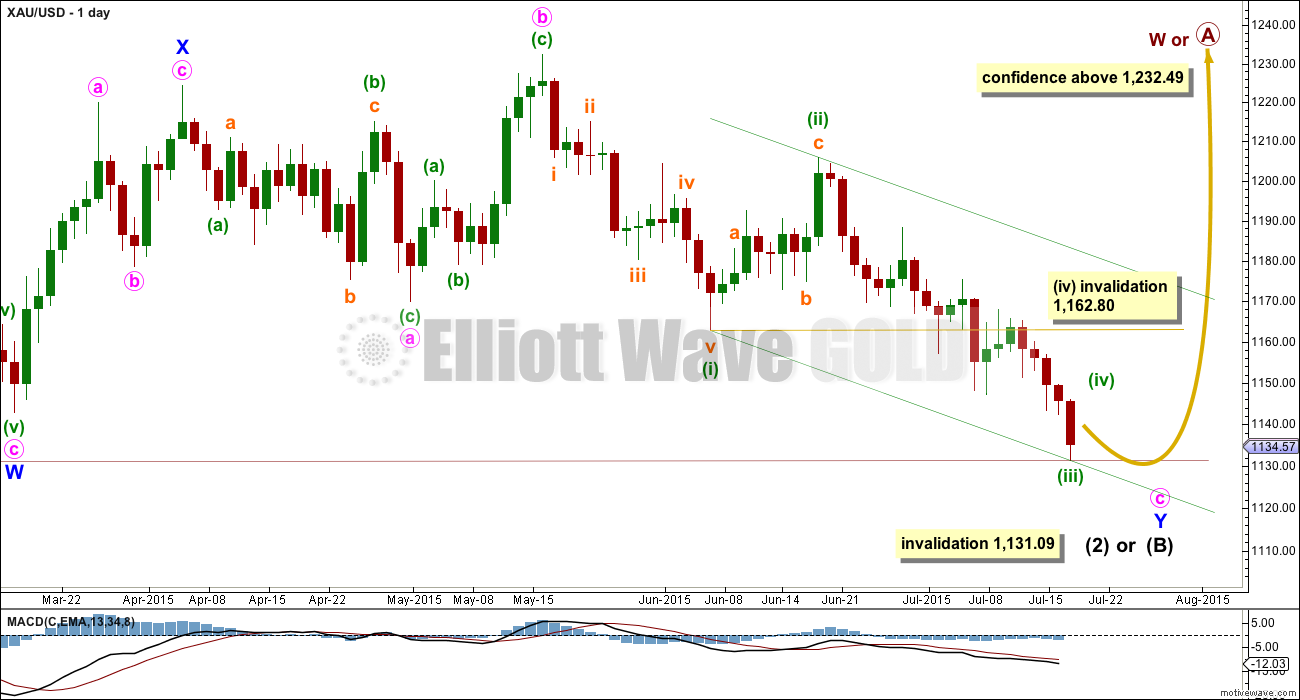
For a full analysis of this bull wave count see yesterday’s analysis. Today, with price only slightly above the invalidation point at 1,131.09 (my FXCM data feed has today’s low at 1,131.22), there is not enough room for minute wave c down to complete as a five wave impulse. I expect this bull wave count to be invalidated next week.
The only option now for minute wave c is to see its third wave over. But minuette wave (iii) will not subdivide easily as an impulse on the hourly chart, and on the daily chart this does not look at all like an impulse. This wave count now looks all wrong.
TECHNICAL ANALYSIS
Click chart to enlarge.
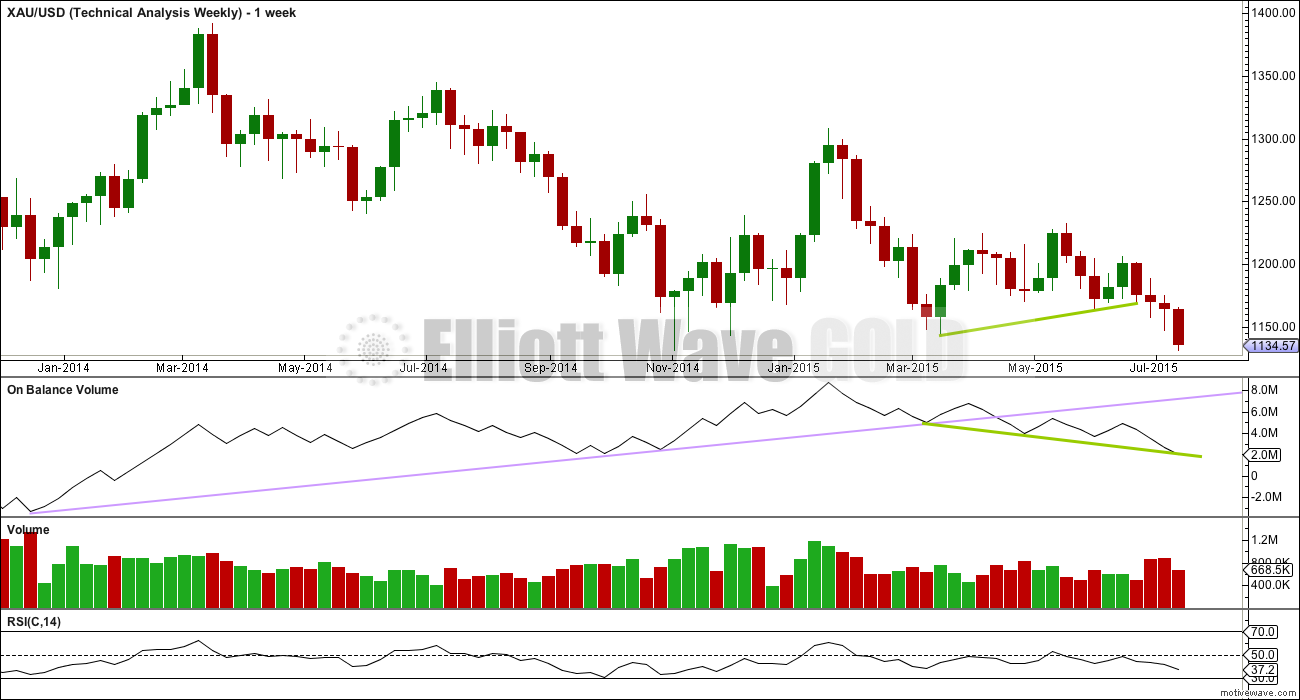
Weekly Chart: Price has broken out of the prior sideways range downwards, which is the direction indicated by volume. During this prior sideways movement, it was four down days and a down week which had higher volume. On Balance Volume breaches a trend line (lilac line) which began in December 2013, and the breach is significant.
While price has made higher lows, On Balance Volume has made lower lows (green trend lines). This small rise in price is not supported by volume, and it is suspicious. Price is now breaking below support at the green trend line, which is another bearish indicator. OBV may now break below support at its green trend line. If that happens, then it will be further bearish indication.
Now that price has broken below the prior area of consolidation volume has increased. This fall in price was supported by volume for the first three down weeks, but not this last week which has just ended. That’s okay. Price can fall on light volume because it does not need more sellers to drive price down, only an absence of buyers. This is why analysts say “the market can fall of its own weight”. That may be what is happening this week, and volume does continue to be reasonable.
RSI is usually a fairly reliable indicator of lows. At the weekly chart level, RSI is well above 30 indicating there is room yet for Gold to move lower.
Click chart to enlarge.
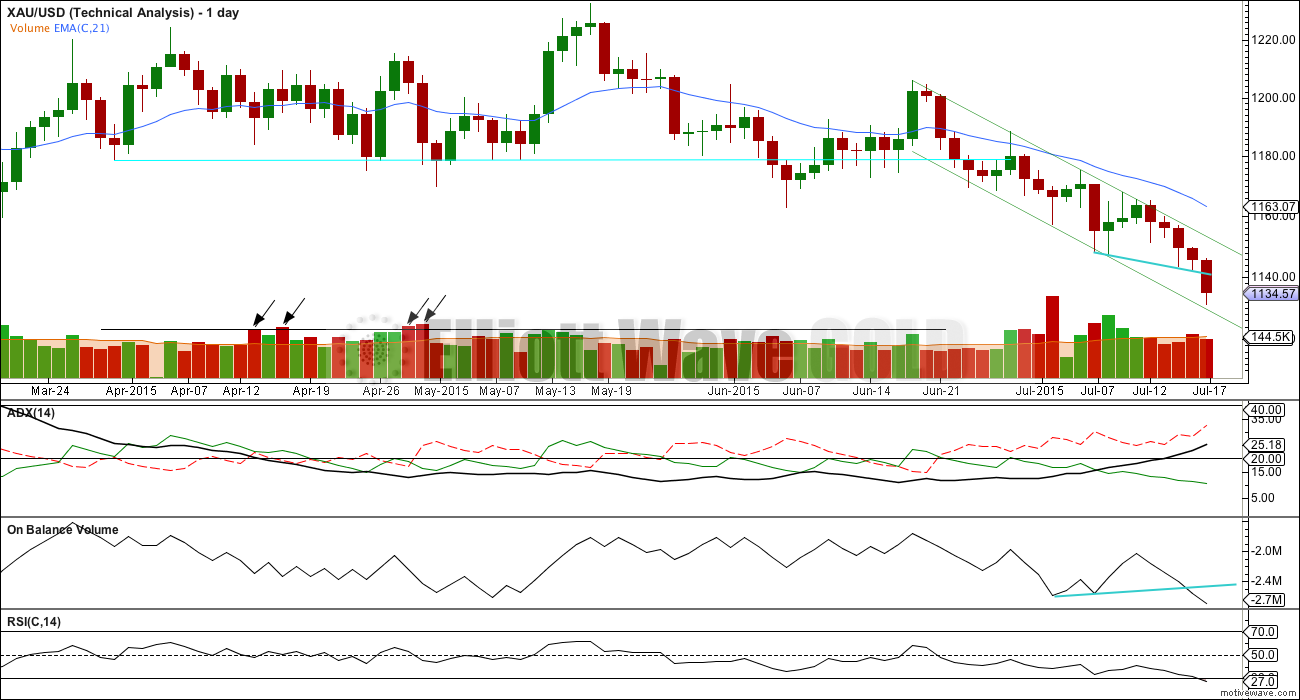
Daily Chart: The ADX line is comfortably above 20 and rising, which indicates a strengthening trend. The -DX line is above the +DX line indicating the trend is down. A trend following trading system should be used.
The idea illustrated here is very simple, and simple is usually best. It uses trend lines to show support and resistance. Expect upwards movement to end at the upper trend line and to bounce down from there. Look for downwards movement to find support at the lower trend line, although this line may be breached. For a downwards trend selling at resistance and exiting at support, staying with the trend, is one of the simplest trend following methods.
Price and On Balance Volume both have breached their small blue lines. While volume for Friday was lower than Thursday, On Balance Volume agrees with price.
RSI on the daily chart is slightly dipping below 30 indicating oversold. However, for the weekly chart there is still room for Gold to fall. For a wave at primary or intermediate degree, RSI should be used at the weekly chart level first. At the end of intermediate waves (3) and primary wave 3, RSI managed to be much lower than 30 on the weekly chart before price found its lows.
This analysis is published about 07:38 p.m. EST.
I bought JDST on 6-26-15 at $7.91. I am now over 113% profit and the wave 3’s continue.
I expect that micro wave 4 is most likely complete and micro wave 5 down is underway now. I’ll move the invalidation point on the hourly chart to 1,119.23. If I’m wrong and micro wave 4 continues the invalidation point for that is back up at 1,147.26.
Sometimes after a swift strong fifth wave (which usually turns up to end a third wave like that one did yesterday) we see a truncated fifth for the next higher degree. So that is a possibility to keep in mind here.
The target for micro wave 5 will be at 1,043. If the target is wrong it may be too high, and the fifth wave may even be truncated (as comment above).
The next target for a multi day interruption to this trend is 1,023 now for minute wave iii.
I’ll look out for the ends of minuette wave (iii) and / or minute wave iii to also have swift strong fifth waves.
Draw a mid line in the parallel channel on the hourly chart. Currently price is finding support there. Look for corrections to find resistance now at the upper edge of the channel. When the mid line is breached look for corrections to find resistance there. When this channel is breached to the downside look for the next increase in momentum.
The trend is still down and momentum still needs to show an increase beyond that for minor wave 1.
Wow, I cant ask for anymore. This is insane. What an emotional roller-coaster last 4 weeks has been.
Micro wave 4 may have ended at 1112.45 at 11:15 and now in micro wave 5.
Lara, highlighting your http: links to a “gold” color suits the site well! Thumbs up.
Noting on the 15-min XAU chart price can not even touch its 50-MA and it turns back down.
Ditto Richards question below– any EW peoples know where we are in this micro 4th wave?
Micro 4 ended at 1119.21 and we are now in the third wave of micro 5. My calculations show that micro 5 (and hence subminuette 3) should end in the region of 1071-1072 so as to avoid a truncation.
I have to respectfully disagree. The bigger move down completed a final 5th wave. I do not expect new lows for several days yet. This last downleg had all the characteristics of an (intermediate) ending.
This would mean a truncation as the third wave dropped to 1072 last night.
In this instance a truncation is possible. The end to micro wave 3 perfectly fits the description of “too far too fast”.
While we shouldn’t expect a truncation, we should consider it as a possibility here.
The other possibility is that 1119.21 is only the A wave of micro 4 and that micro 4 would end up backtesting 1136.
I see 1087 as the low.
I concur. It would be the B wave of micro 4.
Matt, a very interesting viewpoint. You have an excellent awareness of EW.
Thanks for sharing.
Thanks Tham as always for your valuable wave count.
Rambus shows 6 month wave Gold and MIner cycles for decades and projects gold final bottom October/November 2015.
Weekend Report…Gold’s Peculiar 6 Month Cycles . July 12, 2015, 9:57 pm by Rambus
http://rambus1.com/?p=40532
THE SEQUENTIAL 6 MONTH TIME CYCLES -Earlier in the bull market the six month time cycles were usually in May and November but for the last several years October and April have marked the six month cycles. I have place some price objectives at the bottom of the charts so we can get a feel for when this next low, that I’m expecting in October, to occur.
Is it possible gold will back test the breakout level 1131.03?
I would say, yes. The way I see it, gold is now in a multi day sideways correction which should end somewhere between 1115 – 1132. The 2nd wave counterpart to this 4th wave – which took gold from 1162 to 1205 – lasted 11 days. I would expect a similar duration now. Thereafter, the downside target, by my calculations, should take gold to the 1060s. Once that hits, gold will likely correct for several months with the final move to 967 occurring during the first half of 2016.
I should add that there is a chance that the final low for gold is in during the 4th quarter, but later is more likely.
Yes Lara said it is possible although not required and may or may not happen. Lara said the next major multi day correction was at 1023. I figure gold may bottom before or by this fall at the latest. Lara will clarify tonight.
Quite the wild ride with so much action and a big change with narrow corrections due to the strong pull of this 3rd wave down like a whirlpool.
Lara,
Again congrats, you stuck by your analysis thru a long obscure sideways movement and were proven correct. My opinion of who started the wave is inconsequential, as fact is the wave occurred and you called it. Well done.
Question ( I think an important question). Looking at current price and target (Gold-1105-957, Silver 14.77-5.3, GDX 14.19-11.22) it appears , in very rough estimate, downside potential is (Gold-15%, Silver-65%, GDX-20%)
Silver at 65% downside potential could be an awesome trade. Or maybe I am reading charts all wrong.
I know you’ve stated Gold volume makes for better analysis compared to Silver and GDX, but looking at this Silver -65% potential, would you update Silver and possibly comment on the Gold vs Silver vs GDX potential ?
You’ve got it right. And just remember Gold is king and leads the way as it has the volume and follows EW by the book but Silver and GDX don’t in EW analysis due to too low volume so not accurate like gold.
Let Gold lead and be careful with Silver as it whips around multiple times what gold does up or down like a tail on a dog.
Richard I agree gold is king but sometimes his little brother silver runs further and faster. My interest at this stage of PM move down is which( gold, silver or gdx) has most overall downside potential. I don’t have your fortitude for short term trading, I prefer to position for the next 6 months. Difference between gdx at -20% vs silver at -65% is huge. That is (IF) I am reading charts correctly. I seek some confirmation from Lara and or others. Will appreciate comments on silver potential at -65%.
Silver has historically always had more profit potential. However, it is also a lot wilder. Not everyone can stomach it.
Matt, yes silver could be wild. I can buckle up and ride silver if I have confidence in the 5 something target.
Was hoping to get some comments on validity of silver 5 something target.
Also silver is significantly lagging gdx –potential for nice down move in silver to catch gdx.
I’ll update Silver… but really, it’s not going to change much.
I’m not going to comment on the potential of Gold vs Silver vs GDX because it’s all there in the targets. And what if my targets are wrong? They were wrong yesterday for Gold (with the exception of the final target 957).
Any intraday wave counts since Lara’s count? I guess we are still in micro wave 4. Is it almost over?
Lara, I want to thank you for your diligence in following Gold’s moves over the past few months to be assured of these bear market moves. I ‘ve also appreciated your extra updates when they appear appropriate. I’ve told you before your skill shows and I am SO GLAD I found ElliottWaveGold.
I stand positioned now to remove all — ALL — prior losses (4 yrs of beginning trading in regular stocks, I was trading off-n-on, not as often as most of your other subscribers, but still) and I am certain I will go on to bigger profits. {It’s just not time to harvest it}
Thank you SO much for starting ElliottWaveGold.
And thank you for having a comment section where some very fine traders are posting excellent information.
It’s been fun!
Thanks again.
I agree. Once I found Elliott Wave Gold in June 2013 I was hooked for good as Lara is the Best gold forecaster I have found.
I agree.
Curious, are you planning to go back into DUST at end of current 4th wave? I’ve notice some traders in another chat trying to long at 1110– I think they’re crazy
Yes I’m thinking of buying DUST at gold high today. However DUST sure rocketed today up 25% and almost $7, unbelievable. Would be nice if it settles down somewhat today before buying it if that is possible. One would think a retrace is due today but Lara figures it may or may not happen.
.618 Fib is at 1131.31 and the daily trendline may be at 1128 and the hourly trend line may be at 1135?
Hard to see exact price on my little weekly chart, but I have DUST at about $1.00 shy of multi-year trendline which touches tippy top 6/2013 and 11/2014
edit –be careful
Is Gold Forming A Selling Climax?
By Kira Brecht Monday July 20, 2015 09:56
http://bit.ly/1CSjIEg
Lara.. when you get time, please update new GDX target? I have forgotten the count the number of times I have thanked you for giving such a awesome analysis.
Okay, will update GDX too.
And you’re welcome.
Lara… Yet another double. You have spoiled me now. Heading out to cool down my nerves. I am literally shaking.
Congratulations that’s terrific, another double.
Thanks Lara. I can not click and enlarge the chart in comment section.
Is it possible to post the update on gold page?
click on chart and ‘Copy image’ and ‘paste’ into Microsoft Word and enlarge to full 8 1/2 x 11′” as I did when she posted it.
Gold dives to 5-year low as China selling triggers stop-loss orders
http://www.thehindubusinessline.com/markets/gold/gold-dives-to-5year-low-in-sharp-selloff-on-stronger-dollar/article7443037.ece?utm_source=RSS_Feed&utm_medium=RSS&utm_campaign=RSS_Syndication
“The market looks very technically weak and the biggest buyer of all, China, is now selling gold as opposed to buying it on price dips. That’s a recipe for weaker prices,” said Victor Thianpiriya, an analyst at ANZ Bank in Singapore.
More than 3 million lots were traded on a key contract on the Shanghai Gold Exchange, compared to less than 27,000 lots on Friday, Reuters data showed. Prior to Monday, the volume for July had averaged less than 30,000 lots.
Lara that might be your increased selling volume for your bearish outlook.
Refresh your browser, I’ve added a new chart and comment below Richard.
Good luck!
A new hourly chart.
Fourth waves may be quick and shallow. Fifth waves to end these third waves may be strong.
Micro wave 2 was very deep, so micro wave 4 may be shallow. It’s already just a little deeper than the 0.382 Fibonacci ratio so it may not move much deeper if at all. It may be a sideways combination or triangle.
Look for upwards movement to find resistance on the hourly chart at the upper edge of this maroon best fit channel if this fourth wave moves deeper. Look also for price to find resistance at the lower edge of the green channel on the daily chart.
At 1,023 minute iii would reach 2.618 X minute i.
Thanks Lara, I can go to bed now.
Lara I think you mean micro wave 3 was very deep. (not micro 2)
I think Lara’s statement was correct. She is comparing micro wave 2 and 4. Micro 2 was a very deep correction; therefore, the guide of alternation would give probability to a shallow Micro wave 4.
That said, since micro 3 was strong and lengthy, micro 4 may be deep also and show on the daily chart like micro 2 did for 1-3 days. The top of Lara’s new channel at 1131 is a strong possibility.
I’ll watch for a gold high today to buy DUST .
May even be an opportunity at the open to buy DUST if gold is still down in that case DUST would climb up.
Yes, that is possible.
At this stage I would look out for fourth waves to possibly be quicker than the second waves were.
This often (not always) happens after a third wave has ended with a strong fifth wave extension within it.
Richard, it looks like DUST and JDST are going to gap up at the open. My view is that they will quickly reverse and then fill the gap during the day as gold moves up slowly. A deep retrace up for gold will provide a good backtest for the H&S pattern breakout as shown on the GBones chart below. Let’s see if this scenario plays out.
Dreamer’s right. Micro wave 2 was a deep correction so I would expect micro wave 4 to be shallow. Guideline of alternation.
It doesn’t always work like that, just usually it does.
At the time of writing this comment micro wave 4 is now deeper than 0.382 of micro wave 3. It’s not going to be very shallow. It’s still less likely to reach 0.618 or to be deeper than that.
Lara, thanks for the new hourly chart and other late evening replies. Sure helps to get your thoughts after such a big move!
Lara,
First off, thank you so much! I personally just made a killing on this last move. I have been positioning myself appropriately for many weeks because I know from experience that gold makes these bigger, sudden moves. We saw it in primary 3. It will happen again too.
Secondly, I am wondering why you are making this change? You expected gold to get to 1093. It got there faster, yes, but it only overshot by $5 or so. Aren’t you expecting a multi day sideways correction now?
I think we need to see subminuette wave iii complete first.
If it’s fifth wave is truncated then the whole thing may look like a sideways move at the daily chart level. My target for it is 1,043 though.
Subminuette wave iv may show on the daily chart, but it may not.
Minute wave iii is not over yet. So no, I’m not yet expecting a multi day correction. Not yet.
Everyone probably will be expecting upwards movement after that flash crash. Which means it probably won’t happen.
Thanks. If we see an imminent new low, I will change my tune. However, for now, I will have to respectfully disagree and will just wait this one out.
The targets have all been passed. A new target for minute wave iii would be at 1,023.
That strong downward movement looks like a fifth wave to end the middle of the third wave, it would be sub micro wave (5) to end micro wave 3.
At the daily chart level downward momentum still needs to increase.
This does fit the wave count (with the exception of inadequate targets) perfectly; it does look like a typical fifth wave commodity spike to end a third wave. No, I do not think the market is being manipulated to produce that, and I did state fifth waves can be very strong, and I expected them to turn up at the end of third waves. I also stated to expect any surprises to be to the downside.
The invalidation point at the hourly chart level should be at 1,147.26. Use the lower edge of the green channel for resistance.
Lara thanks a lot for answering my prayers for an update before the open.
Lara, you are expert in EW and your wave count has just (again) proven accurate and big congrats for that.
I struggle to see 2.7 billion sell / dump of paper gold in 1 minute in after hours and weekend (most markets) as normal trading. I smell a rat, but as an old saying goes “that does not mean a hill of beans” if as Dreamer posted below, your EW analysis does not discriminate against normal, fat finger or manipulative trades.
Davey we all know that in some form or another people believe in manipulation. We may think of it about the bigger traders than us and non-traders may think that all traders are manipulation in one way or another. I can’t do anything to change or stop manipulation if and when it does happen and we don’t even know if it happened today or there is a non-manipulation explanation. If I think about it a lot it is upsetting. So I let go of thoughts of manipulation and stay positive and focusing on what I can do to improve my results. What I give my focus and awareness to I give my energy to and create more of so I’d rather give it to the ways I can make money trading gold with Lara’s help.
The thing is, every time we see a swift surprising move that someone / lots of people call as manipulation… it fits with the wave count.
We knew there was strong downwards movement ahead. We knew to expect it to turn up in fifth waves. And that’s exactly what it’s doing.
The surprise wasn’t a strong upwards move. It was downwards.
Davey your manipulators have been identified or suspected.
http://www.marketwatch.com/story/big-fund-suspected-of-selling-gold-as-price-crashes-to-five-year-low-2015-07-20?mod=MW_story_latest_news
Richard, many algorithmic traps are set to catch large transactions in unusual circumstances (after hours, light trading when their is no buy sell balance for large transactions etc). That this did not happen is highly suggestive someone “left the door open”. Who is this sellerfronting for? We will probably never know.
So I will take your suggestion to “go with the flow”. Watch Lara’s analysis and forget the rest.
It did happen one minute before Hong Kong market opened at 9:30 am.
I’m sure that as soon as markets were created years ago in the beginning, that people tried to manipulate them to their advantage. So, the manipulation started long before Elliott Wave was recognized and documented. Therefore, it makes sense that all movement be included in the wave count, since the “manipulation” has always been there. Manipulation has likely evolved over the years like everything else. HFT and internet speed so fast that traders get a nano second advantage are more recent examples.
Dreamer, yes there has always been manipulation but it’s becoming blatant, at least big bullion banks used to provide the courtesy of hiding most of it. It’s not HFT but the quantity of naked fake options being used.
But…if Lara EW analysis accounts for all electronic transactions, if EW can account for JP Morgan pumping naked silver shorts then why should I complain–just ride that EW wave! 3XETFs will become dangerous as their market is closed 1/2 a day while gold and silver will be rocking and rolling all night. Maybe I must learn real gold and silver trading like the big boys.
All those players are all still making decisions based on their human brains. They write the programmes, they define the parameters.
The result is still an expression of crowd psychology.
It’s still the human expression of our social mood in market movement.
I know that currently this concept is very unpopular indeed. But that’s the underlying premise of EW.
Davey 3xETF’s may be heaven or hell overnight.
Today DUST was heaven as it opened up 14% higher.
Lara has done well this bearish trend.
Bad news is I’m not holding any bearish ETF.
Good news is I’m not holding any bullish ETF.
Good news is it may take less time to the bottom?
Lara was forecasting a multiday bounce at 1093.
Gold has already retraced .618% of the 1 minute crash.
So has the retrace ended?
Which way will gold go during market hours today?
“At 1,093 minute wave iii would reach 1.618 the length of minute wave i. If minute wave iii ends in a total Fibonacci thirty four days, then this target may be reached in another thirteen days. Because minute wave ii shows on the daily chart so strongly it is extremely likely that minute wave iv will also. Minute wave ii lasted nine days and minute wave iv may be 0.618 the duration about a Fibonacci five days in total. Of all the third wave targets calculated, it is the end of minute wave iii which is the most likely to be where a multi day interruption to this trend arrives.”
Thanks Richard, great job of expressing the conundrum, I’m holding DUST but think I will exit early. I would love to be on the right side of this move but the risk seems to great.
Robert you’re welcome.
Awh. So sorry to hear you weren’t holding any bearish ones.
(I like your good news)
I was mad at myself for selling partial on Thursday when I had intended to add. I did then add on Friday, but overslept (from being underslept) and missed the Friday upmove. Really! So… I just girded up and bought before end of day. Wasn’t able to do the party dance everyone was doing then (too mad at my backwards moves) But Monday has shown Friday worthy.
🙂
Good trade for you today.
Gold, Precious Metals Flash Crash Following $2.7 Billion Notional Dump
http://www.zerohedge.com/news/2015-07-19/gold-precious-metals-flash-crash-following-27-billion-notional-dump
In days gone-by I ran a serious data center with worldwide input links. ANY serious data system has multiple traps to stop these flash crash type incidents. This is manipulation and or hacking. I expect more of these events as worldwide economic conditions deteriorate and economic lawlessness increases
The big question is how does EWP see these events? Is market sentiment (gold price) set by billions of transactions no matter if made by a hacker in the middle of the night? Or does the sentiment of hundreds-of-millions of people around the world , from wedding in India to small personal account on E-Trade, with a few each transactions set market sentiment (gold price)?
This question has come up in the past. Lara treats these events as inclusive to market sentiment and EW. In other words, she does not pick and choose what to include. All movement is included.
Manipulation. Blatant manipulation. I don’t pretend to know how EWP sees this move.
Gold just dropped $57.62 in One Minute at 9:29 pm from 1,129.63 to 1,072.01
Lara did warn surprises would be downward breakouts.
Gold dropped through five 3rd waves in 1 minute $57.62.
Mind-boggling, now up to 1,107 at 10:53 pm
After a bounce in wave iv low will be tested. A flash crash was not expected. This is 3rd of 3rd of 3rd wave total six wave 3. Now I am sure Bull wave is of the consideration.
Lara,
Not sure if you can figure out the wave count of a $40 drop in gold in one minute, but the membership would appreciate an update tonight before market open Monday.
Thanks!
Impressive drop! After that, it’s only another $130 to the target.
8 more hrs, I need to sell my dust!!!
Jezzz what just happened
Lara… how does this fit in current wave count?
Seriously what happened, 60 points in 1 minute bar?
Now it gets tricky as how to play this
What happened to 1123, 1111, 1093, current low 1072.01? Are we going to bounce from here?
It’s official! Gold is down for the count and it ain’t getting up.
Lol. YES!
GBones $USD chart. Looks like more pain for gold.
GBones Gold H&S chart.
Hi Lara,
thank you very much for this great update.
Could you update Oil please. As my trades had expired I am looking for a new entry point, hence if it was possible to provide an hourly chart with resistance lines this was wonderful.
Kindly
Ursula
US Oil has just been updated now.
Good day folks. A VEW / SENTIMENTS: I got GCQ15 August Gold (Globex) H 1144.5 / L 1129.6 / C 1131.9 and it would probably be touch and go at this stage if Bull invalidation of 1131.09 has occurred or not. Some may argue that a close below 1131.09 and not a breach of 1131.09 would invalidate the Bull wave count. I don’t think I would worry about that too much. In either case, with a low range close on Friday, downside continuation can be expected – here I would watch Gold price reaction around its pivot (1135-37)…. Currently 1140-43 is seen as restrictive with 1148-52 on the outside…. Volatility appears to have picked up a bit with Gold price in oversold territory suggesting further oversold levels to expect…. Currently Gold price is tracking below the lower band (I don’t like) and is not likely to stay below the lower band for too long (2-3 days but have seen in certain instances – not for Gold – price stay below the lower band for up to 5 days~!)…. Whilst Gold price remains bearish, momentum seems to have slowed down suggesting a snap rally to occur… It will then remain to be seen if Gold price can take out 1144.5 high for further upside continuation to test 1148-52… On the downside I would look for Gold price to seek out 1129-26-23-20 (Gann square of nine is also helpful)…. There are no signs of bottoming and reversal just yet but with low 14-Stochastic reading and StochRSI %K of daily and weekly both at 0.000 and %D as close to 0.000 as it can get, I just wonder how much more downside Gold price can stretch / squeeze out at this stage and if an impending reversal is not forthcoming (will wait for Lara to make that call)…. With price below the lower band, I would look to pull (some of) my money off the table here and wait for a price rise before going short. Gold price is eloquently below the moving averages having a tough time even getting to 5dma (1146-48) lol…. Weekly outlook is bearish…. A cycle turn was due on 16-Juy-15 and Gold price just dropped; monthly cycle is also indicating for Gold price to head on down for >>1114>>1096>>1078…. //// Can’t thank Lara enough for the brilliant, thought provoking and accurate analysis presented over the past few months~! It has been tough going – the storm seems to have been weathered. Thank you Lara, your analysis has been most beneficial for me, as I am sure it has been for others. There have been WOW moments; simply awesome lol
Thanks Syed.
Just a note about EW invalidation points:
EW rules are black and white. So any movement, at any time frame, for any duration whatsoever beyond an invalidation point will invalidate a wave count.
For the bull, wave B of a zigzag or wave 2 of an impulse can’t move beyond the start of wave A or 1. Price may touch the invalidation point, it is movement beyond it which invalidates the count.
It doesn’t have to be the close.
Thanks Lara about EW invalidation points. Much appreciated. I get the picture.
Metal and miner targets. Also, this article explains why GDX is falling harder than GDXJ.
http://thedailygold.com/where-is-support-for-precious-metals-markets/
Thanks Dreamer for a helpful article and charts.
Gold stocks at lowest level since 2002.
http://jlfmi.tumblr.com/post/124068892045/gold-stocks-at-lowest-levels-since-goldmember
Hello Lara.
Can you please post duration and time frame, if possible, for wave 3, 4 and 5 for bear count. Thanks.
Possibly, if I knew which degree you are referring to.
Hello Lara, I meat intermediate wave 3 that ends at 1093, intermediate 4 ends ? and intermediate 5 that ends at 957. Thanks.
Great analysis Lara. I am in cash now and will look for a short entry when one of the channels is hit.
That sounds like a splendid idea. Here’s hoping my wave count is correct and you can all make some nice profits next week!
Lara you’ve done another Elliott Wave work of art masterpiece with this analysis.
The Bull wave lives on by a lucky 13 cents. We’ll give it a sudden death elimination time out for it’s much needed final breather of a weekend to enjoy before being put to rest and it sadly won’t be missed. LOL Next week begins gold’s trip into the deep and DUSTY bear country.
Thanks Richard. I was slow today, that took a long time. I always feel like I want to give it an extra effort at the week end, to make it more thorough.
I do hope you are making nice profits. May you have a relaxing refreshing weekend.