
Price continues to move slowly lower.
Another red candlestick fits the main Elliott wave count.
I have a new alternate Elliott wave count for you today.
Summary: The main wave count and the new alternate still expect more downward movement as does the regular technical analysis. For the main wave count the target for a third wave to end remains at 1,060. At that point, another fourth wave correction should unfold which may or may not show up on the daily chart. The new alternate expects a third wave to end at 1,061 and there a multi-day correction should begin for a fourth wave. When the correction arrives, then trend lines showing where price should find resistance may be used to show which wave count is correct. For now expect any more surprises to be to the downside; a fifth wave to end a third wave is approaching and they can be very swift, strong and extended.
To see weekly charts click here.
Changes to last analysis are bold.
MAIN ELLIOTT WAVE COUNT
Click chart to enlarge.
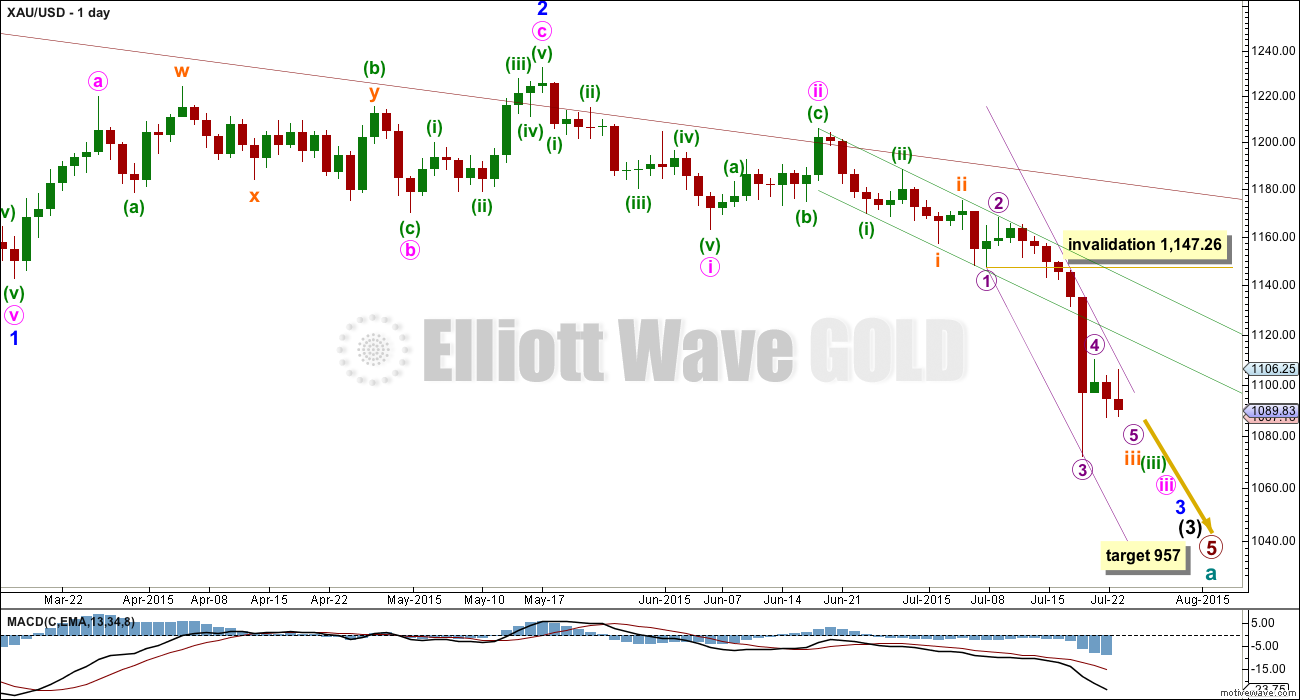
Cycle wave a is an incomplete impulse.
Within primary wave 5, the daily chart focuses on the middle of intermediate wave (3). Within intermediate wave (3), minor wave 3 has yet to show an increase in momentum beyond that seen for the end of minor wave 1 at the left of the chart. This is why I still expect to see more downwards movement to show a further increase in downwards momentum. The strongest downwards momentum may turn up in a fifth wave somewhere within minor wave 3, maybe the fifth wave to end minute wave iii or that to end minor wave 3 itself.
Draw a base channel about minuette waves (i) and (ii) as shown (green trend lines). If the steeper violet channel is breached then look for the lower green trend line to provide resistance. Only if the upper green line is breached would I consider the wave count to be wrong.
Draw a best fit channel about subminuette wave iii as shown (violet lines) and use that channel on the hourly chart.
Micro wave 4 (if it continues further) may not move into micro wave 1 price territory above 1,147.26.
At 957 primary wave 5 would reach equality in length with primary wave 1.
Click chart to enlarge.
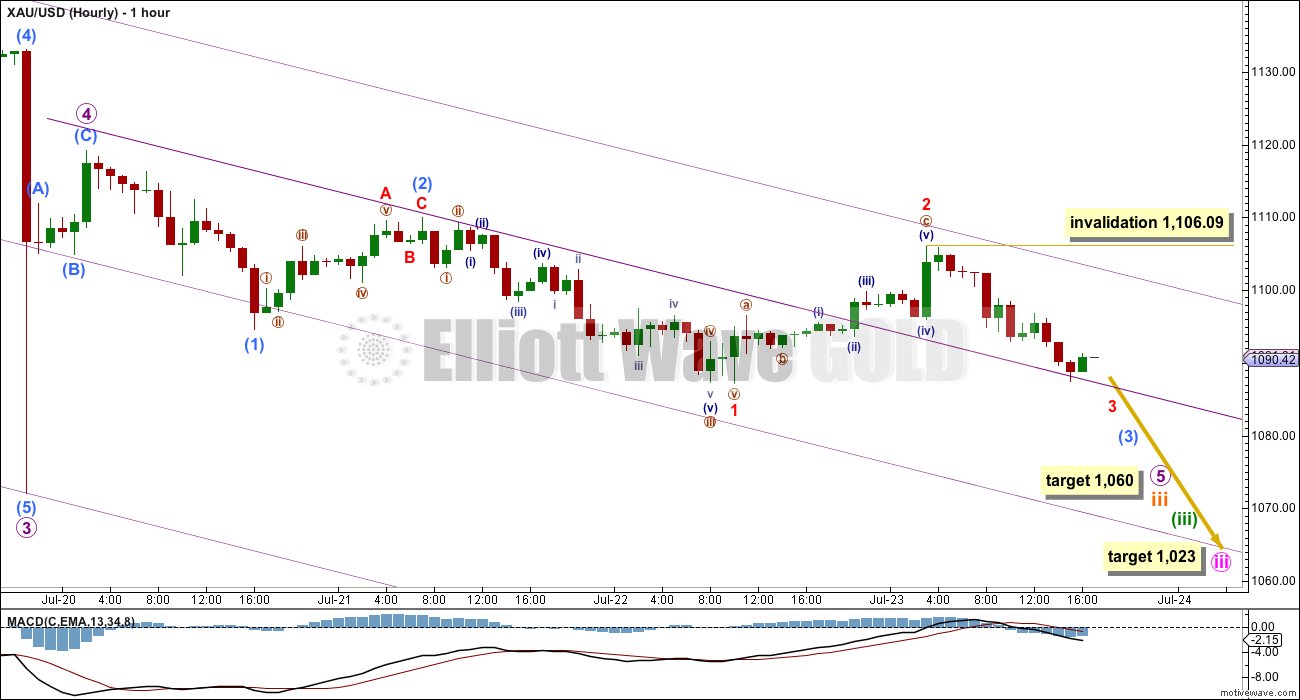
Gold often exhibits swift strong fifth wave extensions, and they usually turn up to end its third waves. We saw this to end micro wave 3. It is entirely possible, and should be expected, that it may happen again to end one or more of subminuette wave iii, minuette wave (iii), minute wave iii, minor wave 3 and maybe even intermediate wave (3). Look out for any more surprises on the way down to be to the downside.
Ratios within micro wave 3 (the middle of this whole third wave) are: submicro wave (1) has no Fibonacci ratio to submicro wave (3) and submicro wave (5) is 2.5 longer than 1.618 the length of submicro wave (3). Because there is a good Fibonacci ratio within this movement for this main wave count and there is not for the alternate, this main wave count has a higher probability.
There is no Fibonacci ratio between micro waves 1 and 3. This is important and means that micro wave 5 is more likely to exhibit a Fibonacci ratio to either micro waves 1 or 3. At 1,060 micro wave 5 would reach 0.618 the length of micro wave 3. This fifth wave down for micro wave 5 will complete subminuette wave iii impulse. Subminuette wave iii has now lasted a Fibonacci thirteen days and the structure is incomplete. It may not exhibit a Fibonacci ratio, or it may end in one more day and be one day longer than a Fibonacci thirteen.
I am changing the analysis within micro wave 5. I have checked the five minute chart and it is possible to see submicro wave (1) over as labelled, not higher up. This has better proportion and overall a better look. It makes no difference to expected direction or the target. Micro wave 5 may have two overlapping first and second waves for submicro waves (1) and (2) and now minuscule waves 1 and 2. This still expects an increase in downward momentum to come as the middle of a third wave unfolds. When submicro wave (3) is complete it is possible that submicro wave (4) may be quick and shallow and submicro wave (5) may be swift, strong and extended. It does not have to be like this, but do look out for this tendency of Gold to exhibit this behaviour.
Within minuscule wave 3, no second wave correction may move beyond the start of its first wave above 1,106.09.
At the daily chart level, micro wave 3 now has a curved look to it (very typical for Gold’s third waves). We may see this curved look for one or more of subminuette, minuette or minute degree third waves too. This happens often because Gold’s second wave corrections are often more time consuming than its fourth waves; because it has swift strong fifth waves, they tend to force the fourth wave corrections to be relatively swift and shallow.
For now I will focus on looking for the end of subminuette wave iii. When subminuette waves iii and iv are complete, then I will use multiple degrees to calculate the target for minuette wave (iii). I will not provide a target again for it until I can do so at more than one wave degree.
When minuette waves (iii) and (iv) are both complete, then the target for minute wave iii to end may be recalculated and may change. For now I can only calculate that at one wave degree.
At 1,023 minute wave iii would reach 2.618 the length of minute wave i. Minute wave iii has now lasted twenty five days and its structure is incomplete. If minute wave iii totals a Fibonacci thirty four days, then it may end in another nine days. If that expectation is wrong, then minute wave iii may be too long in duration, it may not exhibit a Fibonacci duration, and may end quicker than this.
ALTERNATE ELLIOTT WAVE COUNT
Click chart to enlarge.
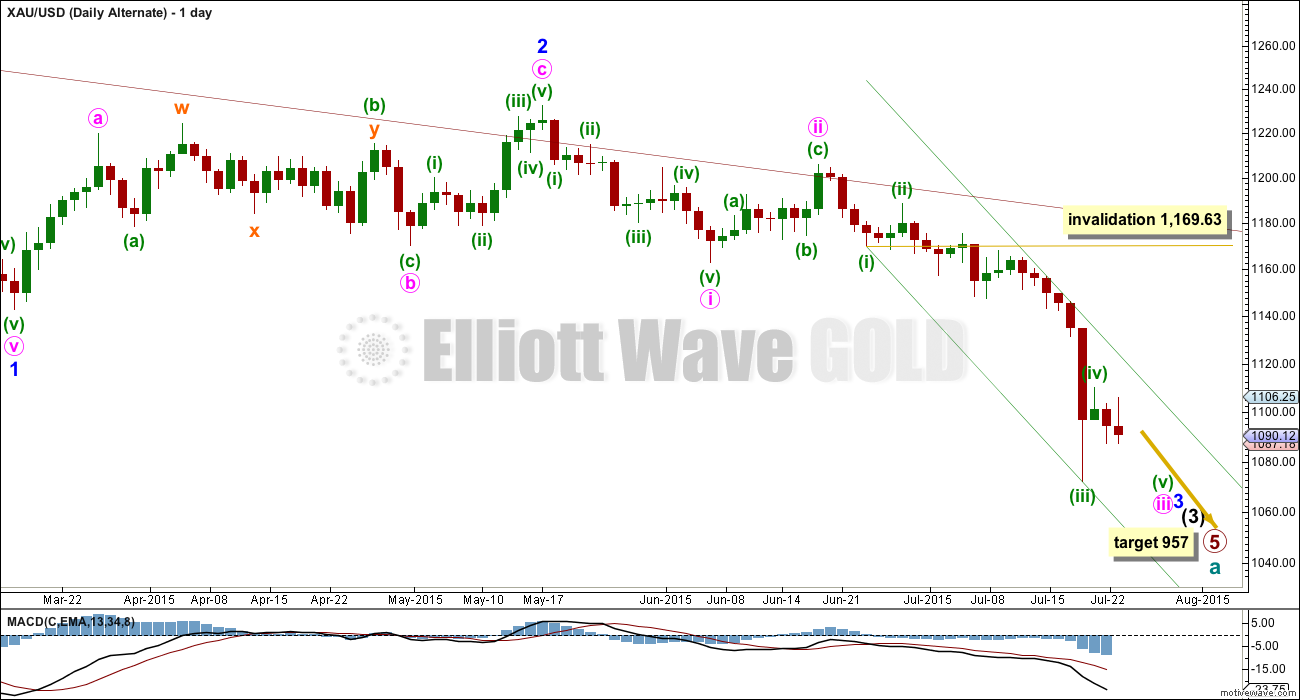
It is possible that minuette wave (iii) was over at the last low. The structure within minuette wave (iii) can fit as a completed five wave impulse on the hourly chart, shown below.
Minuette wave (iii) has no Fibonacci ratio to minuette wave (i). This means a Fibonacci ratio for minuette wave (v) would be extremely likely.
Minuette wave (ii) lasted three days and shows up on the daily chart. Minuette wave (iv) would be very likely to be quicker than three days because it came after a swift strong fifth wave. It is very likely that minuette wave (iv) is over as labelled in just one day, and it also shows up on the daily chart.
If minuette wave (iv) is not over and continues higher, then it may not move into minuette wave (i) price territory above 1,169.63. It should find resistance at the upper edge of the best fit channel.
Click chart to enlarge.
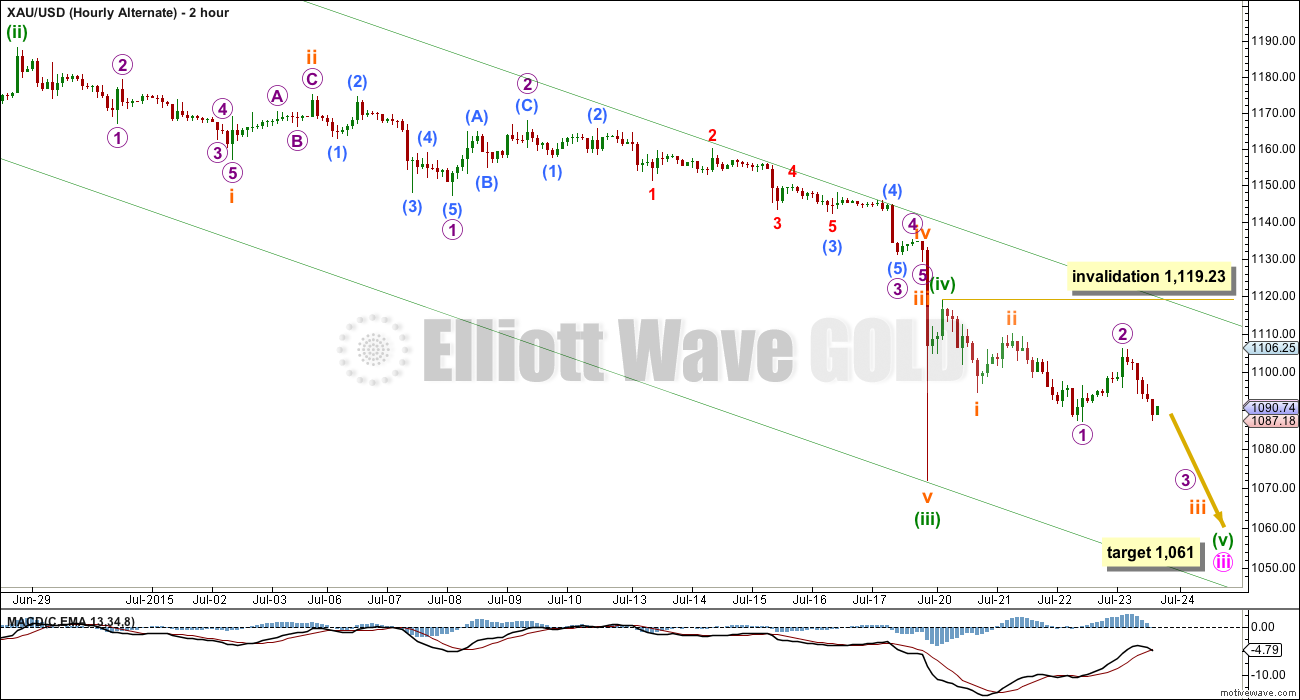
This two hourly chart shows all of minuette wave (iii).
Within minuette wave (iii), there are no Fibonacci ratios between subminuette waves i, iii and v. This is unusual for Gold and substantially reduces the probability of this wave count.
Further, it does not have as typical a look on the daily chart as the main wave count. This wave count is an alternate with a lower probability.
Minuette wave (ii) was a relatively deep 0.52 expanded flat correction. Minuette wave (iv) was a more shallow 0.41 and quicker zigzag. There is very good alternation between these two corrections.
If minuette wave (v) were to reach only equality with minuette wave (i), then it would be truncated. This is unlikely. The next likely target would be at 1.618 the length of minuette wave (i) at 1,061. This target would see minute wave iii have no Fibonacci ratio to minute wave i.
Because it should be expected that minute wave iv shows up on the daily chart (most likely lasting five days), this alternate wave count expects that multi-day correction against the trend to come sooner than the main wave count. Because this alternate wave count has a lower probability, my conclusion is that it is possible but less likely the multi-day correction will arrive sooner than later.
TECHNICAL ANALYSIS
Click chart to enlarge.
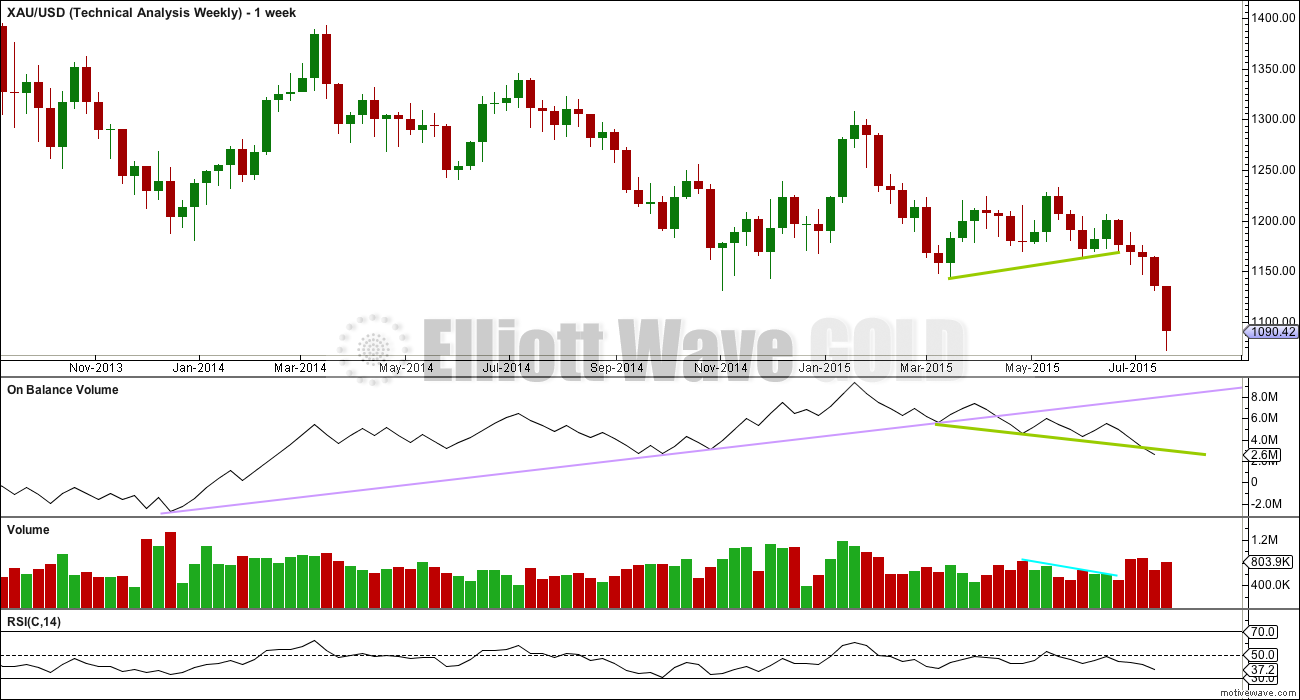
Weekly Chart: The lilac trend line on On Balance Volume has been breached, which is a longer term bearish indicator.
OBV is now breaking below the shorter green trend line, another bearish indicator.
Volume for this week is already showing an increase beyond last week, and Friday has not yet begun. This fall in price is supported by volume at the weekly chart level.
RSI is usually a fairly reliable indicator of lows. At the weekly chart level, RSI is well above 30 indicating there is room yet for Gold to move lower.
Click chart to enlarge.
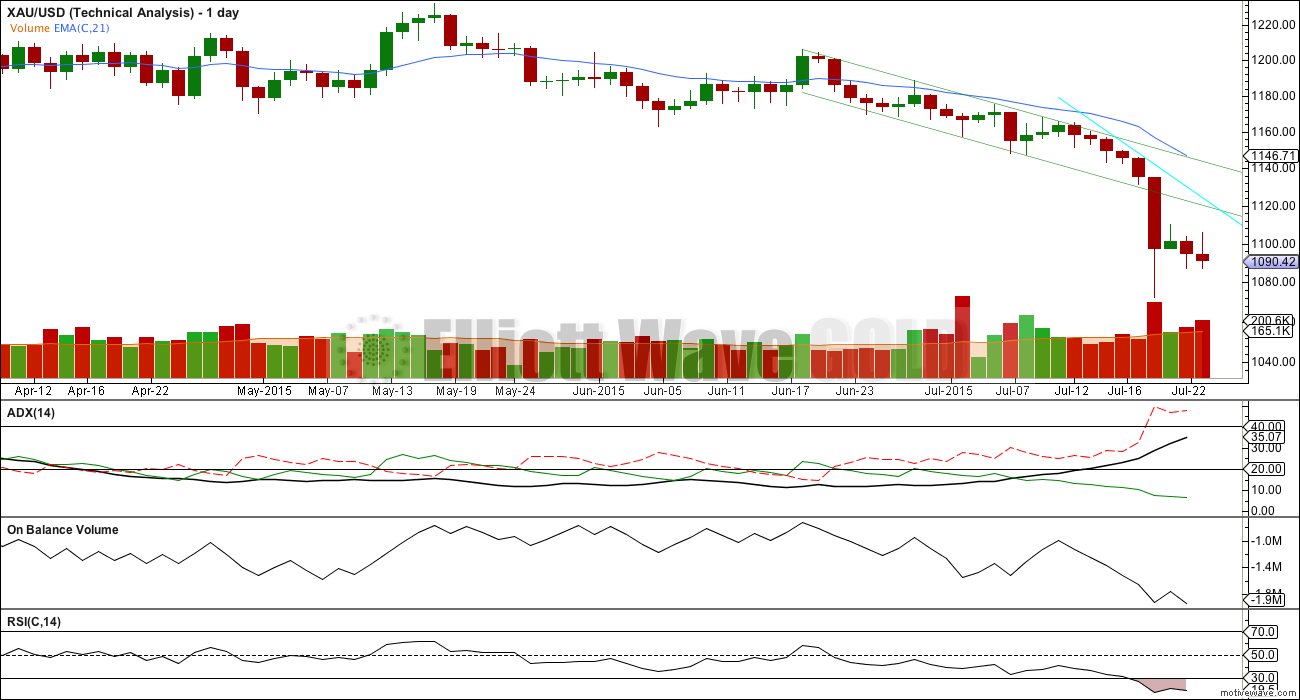
Daily Chart: What is quite stark on this daily chart is the strong volume for Monday. This strong downwards movement was supported very well by volume. There is nothing suspicious about it.
I have looked back again at the ends of third and fifth waves within primary wave 3 during April, May and June 2013. During that downwards movement there were a few strong down days with volume spikes, similar to what we have seen this week for Monday. Each time this happened it was not the temporary price low. A brief discussion of some of those important down days follows.
The strong days of 12th and 15th April, 2013, (a Friday and Monday, so consecutive trading days) saw one more day down after that to reach the low on 16th April. At the low price diverged with RSI: price made a new low while RSI turned up. That low ended minute wave iii within minor wave 5 within intermediate wave (3) within primary wave 3.
There was a series of strong down days culminating in a volume spike on 16th May, 2013. The price low happened the following trading day on 20th May and was again seen with divergence between price and RSI on that day. That low ended a truncated fifth wave (the third wave prior was the strongest move; too far too fast) for minor wave 5 within intermediate wave (3) within primary wave 3.
The strong downwards day of 19th June, 2013, was impressive with a price range of 27.65 for the day and the strongest volume spike of them all at 124.9K. But that was not the end of the fall. The low came six days later on 27th June 2013. Only that last day with the final low for primary wave 3 saw a divergence between price and RSI. The final day also produced a new low but a green candlestick and a strong bullish engulfing candlestick pattern. That was the end of primary wave 3 and the start of primary wave 4.
With this analysis we should expect the pattern to be repeated again within primary wave 5. At the price low for Monday’s strong downwards day to 1,072.09, there is no divergence between price moving lower and RSI also moving lower. The short term / mid term low may not be seen for another one to three days yet. This analysis fits nicely with the Elliott wave count and potential Fibonacci durations.
A correction may be expected soon, but not quite yet.
ADX is still clear. The ADX line is above 20 and rising indicating a strengthening trend. The -DX line (red dashed) is above the +DX line (solid green) indicating the trend is down. A trend following trading system should be used.
The simplest system for a downwards trend like this is to use resistance lines: each time price touches resistance that represents an opportunity to enter in the direction of the trend. Trades may be held until price either reaches support, a target, or if the trade is held for one day if you are a day trader. Depending upon your trading style, your risk management, and management of the equity in your account, stops as always are essential: they may be money management stops, they may be just above lines of resistance (allow for small overshoots), or they may be Elliott wave invalidation points.
Today I have added another likely trend line (in aqua blue) showing resistance.
This approach outlined here is just one trend following method of many.
This analysis is published about 06:05 p.m. EST.
DUST was up and down today.
I traded it 6 times today all profitable and sold before the long crash started.
I bought some GDX before the close once I read Lara’s first comment.
Monday sell GDX slightly above gold 1,119.23.
Then buy back into DUST.
Thanks Lara for your great and timely comment.
As I told you this morning, NUGT could be the trade today, I bought before started 23% run up, unfortunately I was like a deer in the headlights and forgot to sell and now will sweat out the weekend.
lol!
Robert you made a great call early Friday about NUGT.
I know two top traders who are expecting Gold up day Monday.
Perhaps you can make a profitable bullish trade Monday or before the open.
Good luck.
The last wave down from the high at 1,119.23 (micro wave 4 on the main count) will not subdivide as a five. Therefore it must be a three.
Which means a larger correction is unfolding. It is either micro wave 4 or minuette wave (iv).
It is a regular flat; the C wave up is completing. It would be extremely likely to make at least a slight new high above A at 1,119.23. It would be most likely to end slightly above that point because it’s a regular flat and they move sideways, C normally is close to equality in length with A.
The only other option is another 1-2 within micro wave 5; this upwards move is too high, too strong and is breaking above the violent channel so I don’t think it’s another second wave correction. That idea would be invalid above 1,106.09 but I won’t chart and publish it, I think the probability is extremely low.
This is not what I’d expected! The multi day correction has turned up earlier, and there was no divergence with price and RSI.
There will be at least one more multi day correction to come, but there needs to be another fifth wave down first and it still needs to show an increase in downward momentum at the daily chart level.
The trend remains down. This is a correction against the trend. In a downward trend when using a trend following system corrections can be seen as an opportunity to join the trend at a good price…. at their end.
Thanks Lara. It definitely was a “violent channel”. lol
Looks like we will get that gap fill on DUST and JDST next week.
Yes, possibly.
I’m moving the degree of labelling for the third wave middle up one; this correction is most likely subminuette wave iv not micro wave 4.
That still has a good look on the daily chart.
Draw a new channel: from the low of submineutte wave i (it’s in the same place, see the low on the daily chart) to the end of subminuette wave iii (now at the last low 1,072.09 three days ago). Place a parallel copy up to contain all the movement of this third wave.
Subminuette wave iv may find some resistance at the upper edge, but I think that won’t stop it because that would require a truncation. I think subminuette iv will overshoot the channel to end.
Then we’ll be ready for a fifth wave down. Which may be swift and strong.
I think Monday will begin with some upward movement to end slightly above 1,119.23. Once that’s done Gold will be ready to fall again.
I’m leaving comments now to write that up. Good luck everybody and have a fabulous weekend!
I see the action since last night at 10 pm as a nano wave 2 zigzag. Invalidation for this idea is 1106.09.
agreed
JDST dropped from plus 8% down to minus 17% today in a 90 minute frerfall.
DUST dropped from plus 7% down to minus 12% in a 90 minute freefall.
If gold stays at this price 1097 then DUST still has room to adjust down before close as there is momentum working against it and GDX is bullish.
My indicators are still showing DUST is bearish on 1, 5 15, 39, 1 hour time frames
15 minute TTM-Squeeze fired off bearish and now has 4 red bearish bars. That indicator sometimes goes to 8 to 10 bars. Not a good sign for DUST.
Looks like we could get a bearish engulfing candle on JDST today signaling the possibility of more downside and maybe a gap fill next week. That’s counter to the EW fcst for Gold.
Also, Fed meeting next week.
Need some Lara guidance, as always!
Bullish Engulfing forming. More upside?
Dreamer thanks for your charts. I bought GDX at the close.
No invalidations anywhere however gold to high of 1101.67 at 2:31 pm and GDX just went from low of 13.17 to 13.94 high.
Dust just dropped from $39.30 to 34.93 in 43 minutes, ouch.
What is up with the count.
Will gold continue up or head down from here.
I feel like buying something, unsure of direction.
what are u thinking Richard? upper trendline on XAU hit. Dust bottoming near 30 min 50-MA / 1 hr. 21-MA . Is gold going higher or u think done?
With this unexpected price spike, Micro 5 may now consist of 3 sets of nested 1-2’s. This raises the possibility that the target of 1060 may be too high. Let’s wait till Lara comes on to see her views.
want to agree. Dust below prior close. (top is in?) XAU 4-hr shows MACD bouncing back upward. DXY ready for pullback? — for those who follow it
(darn comment edit cut me off. lol.)
There is nothing like the EW experts! Giving us a glimpse of where we’ll be based on where we were. Thanks Tham for your recommendation.
Thanks dsprospering.
I don’t profess to be an expert, just learning.
This is more than a ‘C’ wave
Gold hit 1098.63 at 2:05pm EST
Gold just jumped up $6 in 6 minutes maybe headed for 1095 mentioned below not sure why.
?? DXY daily ready to drop
I couldn’t take it anymore. I sold all but 50 shares bout an hour ago for my BIGGEST profit in my trading (probably done under 100 trades). Thank you Lara! Thank you everyone that contributes their excellence.
(Of course I’ll look into getting back in lower than I sold!)
🙂
That’s a good move.
It is always good to take profits whenever appropriate. Many traders lose money because they are too greedy.
The market is always there, and there will be opportunities galore.
May not get in lower – but that’s ok. For now. 47%+ gain, had to grab it. (I was definitely over leveraged).
opportunities galore – i like it!
Very good timing. You can get in lower. Congrats!
thank you.
Well , you back in yet!! Nicely timed sell by the way
No not going back in yet. Just read Lara’s comment above and definitely waiting now to see what Monday brings. And thank you – I can still use much improvement – but this felt good compared to days of old where I would have been holding probably still. I was having trouble figuring out where to put my stop cause I missed the tight T-stop spot and price was declining. I did not want to miss out on today’s gap up, I thought awh heck go- now – you can get back in. Better profit at 8:05. I got out at 8:19. whew! I am grateful.
Good for you. One does not go banckrupt while taking profit????
I got out also at 38.
Bet you’re glad now! (As am I)
I was at 38.50. Waiting to review analysis Sunday for Monday
dsprospering
Your timing turned out perfect today. Gold bulls took over and Gold jumped up $14 and DUST lost 12% in 45 minutes. Enjoy your awesome 47% gain.
There’s an angel out there in right (and left) field for me. Enjoy life yes. But these profits? Back to work! lol. They warrant a day trip.
Is no one eyeing the mid-1090s as a short term upside target?
heading that way Mat, c at 1095?
The nano wavecount that Tham and I have been discussing today invalidates in the 1094-1095 area as I see it..
Matt, you called it. Psychic or EW guru?
I was feeling upside but couldn’t give you any “analysis” for it. You called it – glad you shouted out- gave me a tad more confidence I was “feeling it” right.
Above 1086.56 and then I think gold drops.
I don’t know if the regular flat correction is done yet. (see Tham’s post 9:20 am)
The 4th wave, nano 4, completed as a regular flat 1077.38 – 1086.56 – 1077.76 – 1089.05.
Upon completing nano 5, and hence miniscule 5, there will be 2 sets of 4th and 5th waves before we see 1060. So, I very much doubt it could happen today.
My rudimentary analysis of DUST yields a 3rd wave high at 41.36 at 1.618 Fibonacci. This could perhaps coincide with 1060 gold price. I’ll get more precise with DUST once I can consolidate the charts to use.
With nano 4 being a regular flat, subnano C must divide as a 5. I would assume you see that as an ending diagonal. With the charts I am looking at, it is not clearcut.
I went down to the 1-minute chart. You can see a 5-wave impulse.
Tham, re your post (yesterday?) about intra-day data for Dust, can you pull up something like Tradingview.com?
Thanks dspropsering. Tradingview chart looks good. I took a cursory look, and will explore it in detail over the weekend.
Tham, thanks. An important DUST question seems to be how far will DUST correct after 3rd wave at 41.36 ? Or, what is DUST 4th wave target?
Get out at 41 or hold thru drop of 4th wave?
I think the most likely is 38.78 if the 4th wave is a normal 0.382 retrace of the third.
One wave degree up is also a third, and that is why DUST has been so strong lately.
Does gold have to retrace above 1186.56 the high of today before it can continue to a new low today?
glad for your question – Richard its 10 86 not 11 86 – just a typo
Yes does gold just have to get above 1086.56 then can drop as just did that.
Please refer to my simple analysis posted above.
So if Friday a 1060 day? Any comments on possibility, small or highly likely?
I would think the decline to the end of micro 5 (target 1060) would involve high volume and panic selling. While that could happen in the middle of the day or afternoon, it most commonly happens early in the COMEX day. So my opinion is the market ends today with its toes on the edge of the cliff and keeps all the leveraged speculators (both bull and bear) sweating over the weekend.
fencepost that would be unfortunate if left hanging over the weekend when could be celebrating.
If gold did drop to 1060 today. We still wouldn’t know if the retrace would be multi-day or not due to 2 possibilities so may not know if should hold over the weekend or not. Perhaps if hits 1060 today take your money and run then start again Monday. I would.
Does it look like gold will drop to 1060 target today before the close?
If not has it already reached it low of 1177.38 or will it go lower?
Is this subnano 4 as a regular flat?
I would say it is either the miniscule 4 or nano 4 wave.
I have yet to figure out whether the drop from 1105.84 is all of miniscule 3, or if it ended at 1077.38 miniscule 3. But it doesn’t really matter as it will continue to drop towards 1060.
You are absolutely correct. It looks like it is a regular flat.
Just to clarify. The first is part of miniscule 3 (three subwaves so far). The second is the whole of miniscule 3 (5 subwaves). It depends on whether one can easily discern the drop from 1105.84 to 1077.38 as 3 or 5 waves. Any comments?
Looking at a 1-hour chart on pmbull.com, I see wave 1 as a 5 from 1105.84 to about 1095, then a shallow wave 2, then wave 3 as a five down to 1077.38. This wave 4 might not be done yet and could end up being a triangle or combination.
Thanks. I concur. That is my second scenario which now looks more likely.
On Rambus forum one trader’s worth is close to $622,500 from January to date with initial investment of $100,000.
Just trading DUST/JDST only.
That is impressive!!!!!!
That shows how powerful the 3x ETF’s can be. This forum will likely make many millionaires in the coming year!
U mean this as well the other. We r in good hand here.
Yes
Yes 3X Gold ETF’s can be heaven, and can be hell. Careful is suggested as Lara said Gold was trend less and part way through a long process DUST can be in a big loss.
Hindsight is always 20-20, however many days EW had other plans like going up for days and not down.
Dreamer I want in on being a Millionaire on this site.
Dream On – Aerosmith
https://www.youtube.com/watch?v=Txt6-24HHVM
I do love that song! Once we hit bottom, if you buy and hold JNUG or NUGT, you’ll be looking at 300+% gains in just a few months and that’s just during Primary wave A. I know you like to day trade, but you won’t want to miss the powerful rally by trying to time small pullbacks.
Gold futures halt losing streak to finish higher – July 23, 2015 2:10 p.m. ET
http://www.marketwatch.com/story/gold-prices-rise-trying-to-halt-10-session-slide-2015-07-23
“There is decent velocity to the downside right now,” he said, but there is also strong support in the $1,040 to $1,050 range. If that support is tested, the next stop will be $1,000, Kerr said.
Peter Grandich of risk-management services provider Peter Grandich & Co., said he believes the bottom in gold prices will come between now and the Fed’s meeting in mid-September.
Both the NYSE Arca Gold Bugs index HUI, -4.30% and the Philadelphia Gold and Silver index XAU, -4.74% traded lower Thursday and were each down about 25% month to date.
Do not trust Peter. Lot of people have lost money in the past. Working for prospectors and pumping their companies. One come to mind is Northern Dynasty. Buy Buy when it was at $21.
When you have analyst like Lara why even bother with these gold bugs.
Have peace.
Gold just dropped $7 in 7 minutes to 1,083 at 9:07 pm down $11 from the close with another $23 to 1160 target.
Sounds like you are going to have break out another batch of fresh caviar tommorow!!!
I’ll have to decide by Friday night about the caviar. I don’t have any DUST so I’ll be buying Friday and would like it to still go well, hopefully gold is up at the open then drops slowly to to 1,060 by the close.
Hi Richard, You know Gold could drop to 1060 before the market opens, if NUGT breaks $3.00 a lot of buyers could come in. NUGT could be the play tomorrow as a day trade. Just a thought, Good Luck
I’ll take anyway to make money with gold although if gold hits 1060 Friday I’m hesitate to hold over the weekend as we won’t know if will bounce or not as Lara has one probability with a multi-day bounce and one without.
Question to subscribers – I am amazed at all the etf derivatives of gold analayzed. As if trading gold wasnt difficult enough. Why dont people just use the continuous gold contract on any FX platform? Usually it reflects gold precisely and trades close to 24 hours? For example I use IC Markets http://www.icmarkets.com/forex-trading/commodities-trading
Am I missing something? Is it that fees are lower via etfs?
For me, the 3x mining ETF’s can provide huge leverage and profit potential in a non-margin IRA account.
Lara, As you know it is Sentiment that moves the gold and silver market not the news events. The Bullish Daily Sentiment Index: DSI for Gold is only at 8% and Silver only at 9% as of Wednesday close. That is an extreme low where markets have already bounced up from and the rare time may drop down to 6% 4% or record 2%. A few more days down might take gold down to record low DSI. See articles here.
See the DSI chart at middle of the page here.
The Daily Sentiment Index based upon % BULLS polled as of July 22nd (Wednesday’s Close): Gold 8% Silver 9%.
http://www.tag618.com/
This article shows DSI at last Silver bottoms the last 2 years.
http://www.marketwatch.com/story/as-gold-falters-big-bank-stocks-are-mounting-a-rally-2015-07-23?dist=afterbell
So from an Elliott wave POV the market would be ready to move up.
Because EW is contrarian.
But it does not help with exactly when the market is ready to move up. Sentiment may remain extreme for a little while before price reaches it’s extreme.