
Yesterday’s Elliott wave analysis was confident for several technical analysis reasons that a downwards breakout should happen, and it did.
Summary: Downwards movement should continue. The new target for it to end is at 1,038 – 1,035. Along the way down, if the structure is complete when price gets below 1,072, then it is also possible it may end earlier. Use the bright aqua blue upper trend line on the hourly chart as the first line of resistance. Only if the upper edge of the orange channel on the daily chart is clearly breached, then would an end to this downwards movement be indicated.
To see weekly charts click here.
Changes to last analysis are bold.
ELLIOTT WAVE COUNT
Click chart to enlarge.
Cycle wave a is an incomplete impulse.
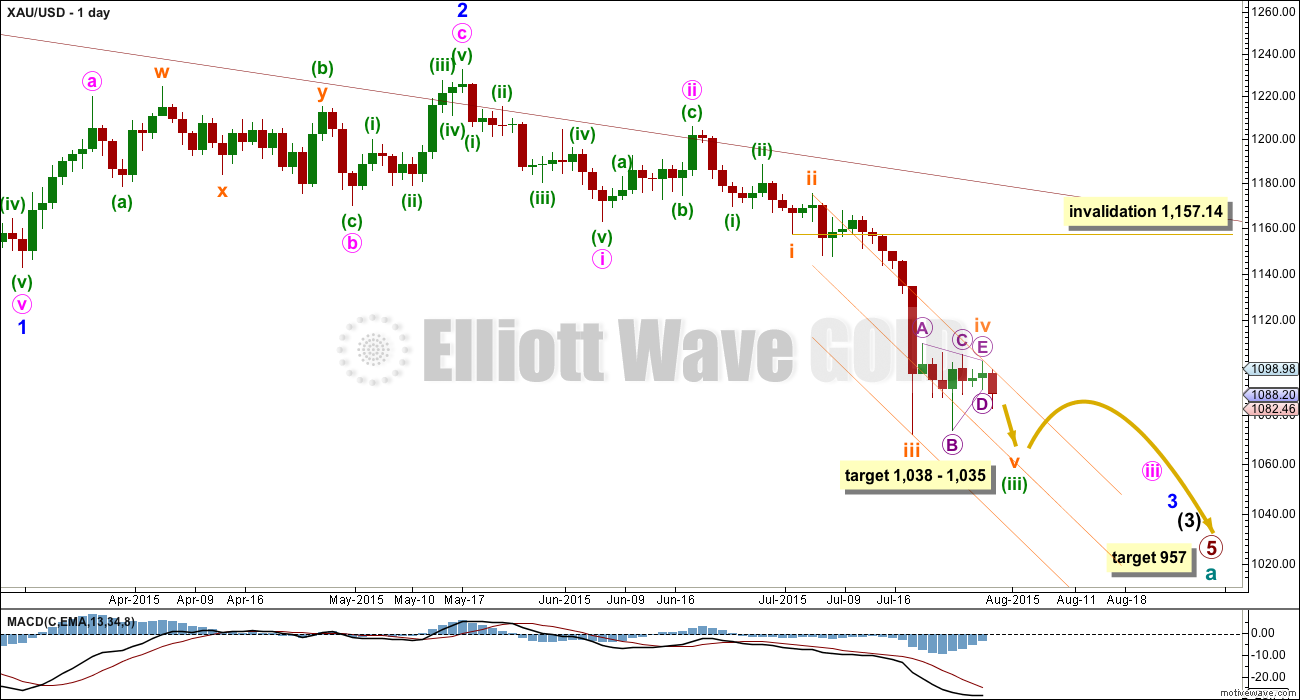
Within primary wave 5, the daily chart focuses on the middle of intermediate wave (3). Within intermediate wave (3), minor wave 3 now shows a slight increase in momentum beyond that seen for the end of minor wave 1 at the left of the chart. Third waves for Gold usually have clearly stronger momentum than its first waves, so I still expect to see a further increase in downwards momentum. The strongest downwards momentum may appear in a fifth wave somewhere within minor wave 3, or maybe the fifth wave to end minuette wave (iii) or minute wave iii, or that to end minor wave 3 itself.
Draw a base channel about minuette waves (i) and (ii) as shown (green trend lines). If the steeper orange channel is breached then look for the lower green trend line to provide resistance. Only if the upper green line is breached would I consider the wave count to be wrong.
Subminuette wave iii looks like it is over at the daily chart level. Subminuette wave iii has a typical curved look to it at the daily chart level and this wave count has the right look.
Subminuette wave iv may not move into subminuette wave i price territory above 1,157.14.
Subminuette wave iv was a regular contracting triangle. The structure is clear on the daily and hourly charts. Subminuette wave ii was a relatively deep 0.58 zigzag lasting two days, and subminuette wave iv exhibits perfect alternation as a shallow 0.29 triangle lasting seven days. Zigzags are normally quicker than triangles, so some disproportion would be expected.
Draw a channel about minuette wave (iii) using Elliott’s second technique: draw the first trend line from the ends of subminuette waves ii to iv, then place a parallel copy on the end of subminuette wave iii. Subminuette wave v may end midway within this channel so add a mid line. Along the way down, upwards corrections against the trend should find resistance at the upper edge of this channel.
I would not expect subminuette wave v to be truncated, at today’s low. So I would expect price to keep falling from here to at least below the end of subminuette wave iii at 1,072 to avoid a truncation.
Once price is below 1,072, look for the structure of subminuette wave v to be a completed five wave impulse on the hourly chart. Once that is clear, a subsequent breach of the upper edge of this orange channel would provide trend channel confirmation that minuette wave (iii) would be over and minuette wave (iv) would have begun.
Minuette wave (iv) should unfold sideways. It may be very shallow because minuette wave (ii) was relatively deep at 0.52. Minuette wave (ii) lasted three days and was an expanded flat. Minuette wave (iv) may exhibit alternation as another triangle or a zigzag most likely, and may last about five to eight days.
At 957 primary wave 5 would reach equality in length with primary wave 1.
Click chart to enlarge.
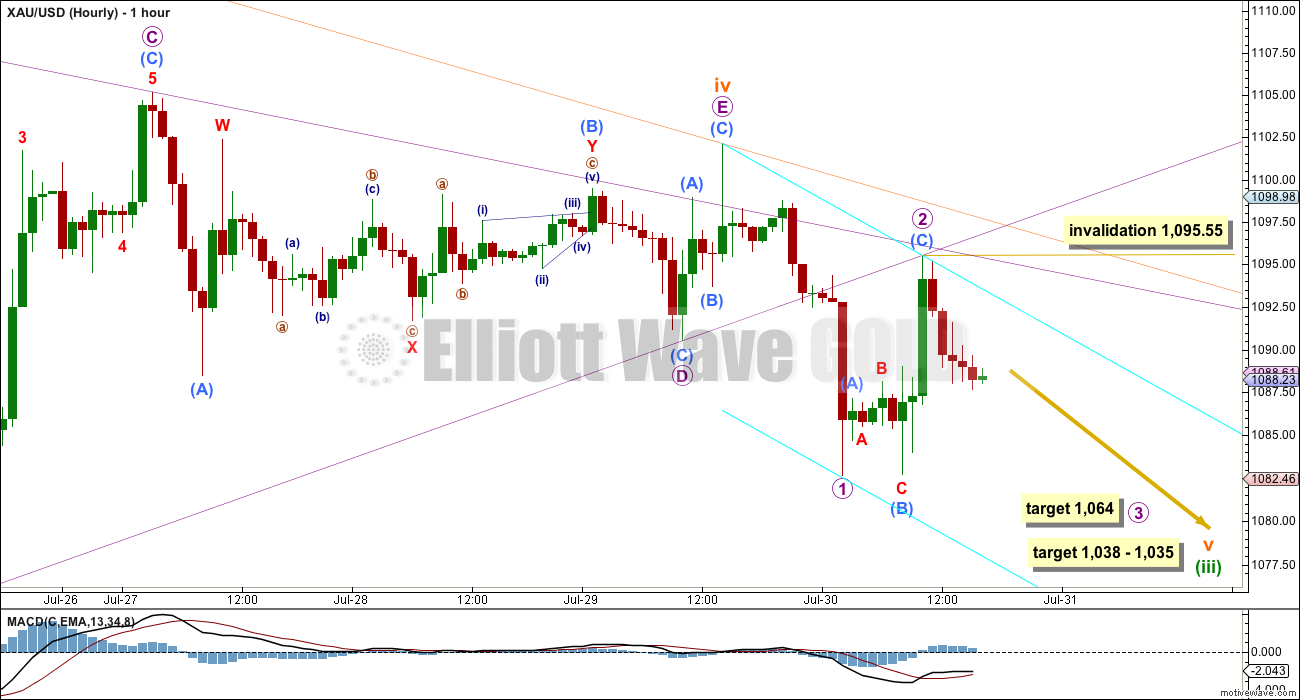
So far there is a five down complete to break out of the triangle. I have checked the structure within micro wave 1 on the five minute chart which does subdivide perfectly as an impulse with (for Gold) a typically sideways time consuming second wave compared to a short shallow fourth wave, giving this impulse a curved look at the hourly chart level. Within micro wave 1, it was the fifth wave to end its third wave which was the strongest part of this downwards movement.
Micro wave 2 is a complete three wave structure and a typically deep second wave at 0.66 of micro wave 1. Micro wave 2 perfectly found resistance at the lower B-D triangle trend line extended outwards. It was almost at the point in time where the triangle trend lines crossed over that a trend change was seen; this is almost where micro wave 2 ended and micro wave 3 began. Yesterday’s analysis had expected the whole of subminuette wave v to end at this point in time, but that’s not how it is unfolding.
It is extremely unlikely that subminuette wave v is over at today’s low labelled micro wave 1; there would be a huge truncation at 10.59 which would look wrong at the daily chart level. It is much more likely that this is only micro wave 1 of a five wave impulse for subminuette wave v.
At 1,064 micro wave 3 would reach 1.618 the length of micro wave 1. Micro wave 3 should show an increase in downwards momentum beyond that seen for micro wave 1. Within micro wave 3, its second wave correction is yet to unfold which may not move beyond the start of micro wave 3 above 1,095.55.
The bright blue aqua trend channel is a base channel about micro waves 1 and 2. Along the way down, upwards corrections should find resistance at the upper blue line. This almost always works, but almost always is not the same as always. If that blue line is breached, then the next line of resistance should be either the triangle trend lines (violet) or the upper edge of the orange channel which is also shown on the daily chart.
Micro wave 3 should have the power to break through support at the lower blue line, but first some support for a small bounce may be seen there.
The final target for subminuette wave v is recalculated today because it does not look like yesterday’s target at 1,071 allows enough room down for this whole structure to unfold. That is still possible, so if my new target is wrong it may now be too low. If price reaches about 1,071, and it looks like the structure may be complete, then it is still possible that this wave may end there.
At 1,035 minuette wave (iii) would reach 4.236 the length of minuette wave (i). At 1,038 subminuette wave v would reach 0.618 the length of submineutte wave iii. This gives a $3 target zone calculated at two wave degrees, so it should have a reasonable probability.
Whichever target turns out to be correct (1,071 or 1,038 – 1,035), an end to this wave down would only be confirmed with a breach of the upper edge of the orange channel at the daily chart level. That would indicate an end to minuette wave (iii) and the start of minuette wave (iv).
TECHNICAL ANALYSIS
Click chart to enlarge.
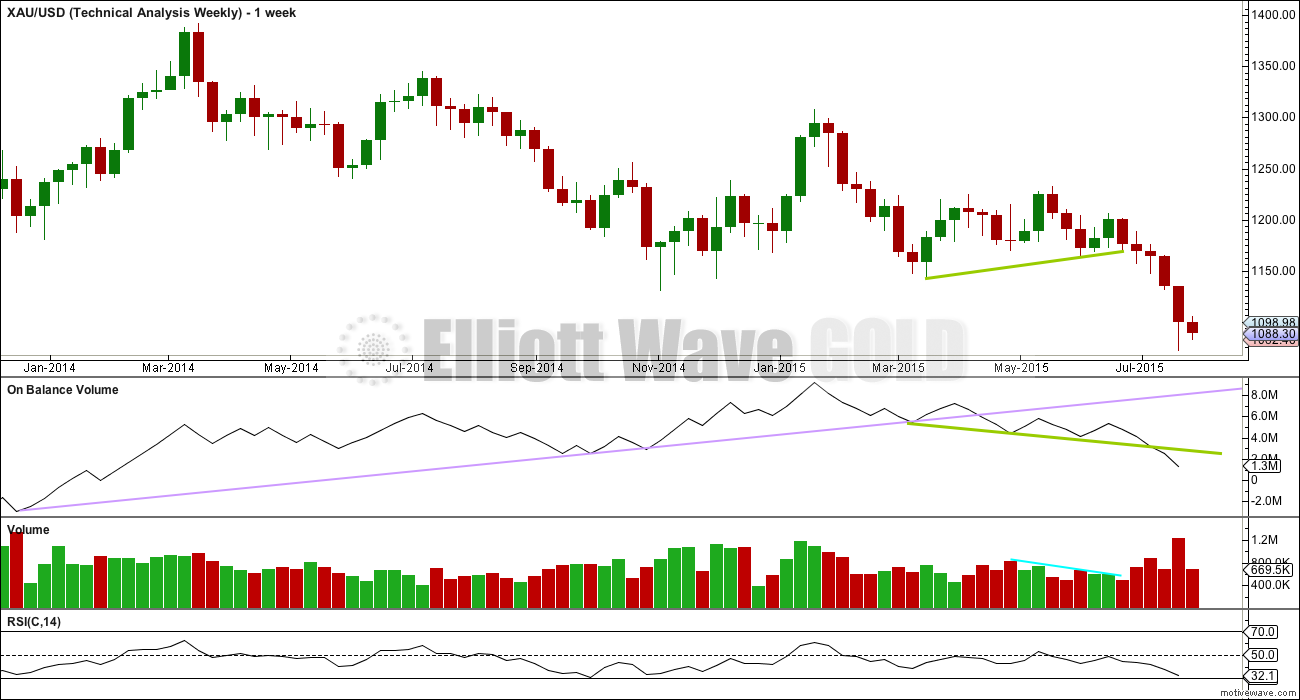
Weekly Chart: The lilac trend line on On Balance Volume has been breached, which is a longer term bearish indicator.
OBV is now breaking below the shorter green trend line, another bearish indicator.
As price falls volume is increasing and OBV is moving lower. This fall in price is supported by volume at the weekly chart level.
RSI is usually a fairly reliable indicator of lows. At the weekly chart level, RSI is still above 30 indicating there is room yet for Gold to move lower.
Click chart to enlarge.
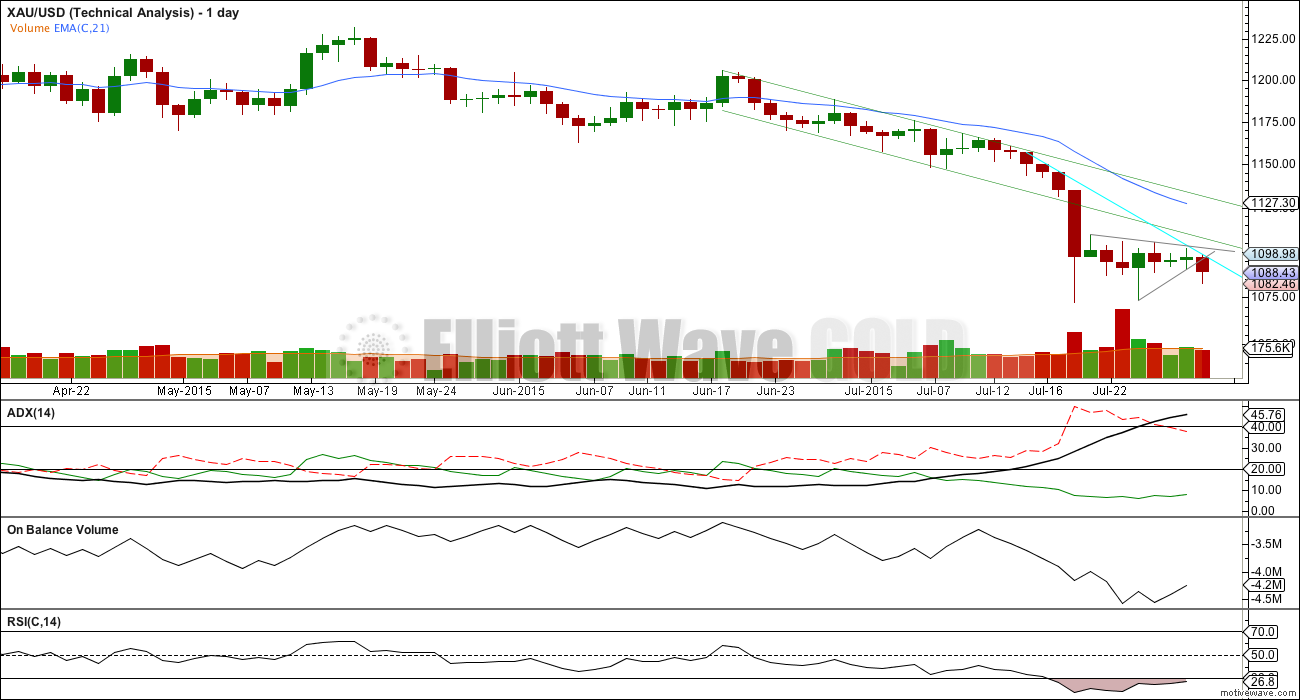
Daily Chart: The small pennant pattern looks like is working well. Price is now breaking below the lower edge of the pattern, so a continuation of the downwards trend would be expected from this classic pattern.
Although RSI is oversold, there is no divergence between RSI and price: as price moved lower to the last low at 1,072 RSI also moved lower. I would not expect a larger correction to begin until there is some divergence. If the Elliott wave count is correct, then new lows below 1,072 may see RSI remain oversold for a few more days yet, but it may not make corresponding new lows. However, it may be too optimistic to expect substantial new lows while RSI remains oversold; therefore, the Elliott wave target may be too low.
Today volume is lighter than yesterday. The downwards breakout is so far not occurring on increased volume and may be slightly suspicious. The market can fall of its own weight, because a fall in price does not necessarily require more sellers and may occur with an absence of buyers. However, it is slightly concerning that this downwards day has light volume. If tomorrow sees an increase in volume, then this would no longer be of any concern. Overall, during the formation of the pennant, it was very clearly a downwards day which had strongest volume, so a downwards breakout is still expected as most likely particularly as it comes in conjunction with one of the most reliable classic technical analysis continuation patterns.
ADX continues to rise during the formation of this consolidation. Despite price drifting sideways the trend continues to strengthen and remains down.
A trend following strategy should be used. Trading with the trend is advised. A mean reverting system which allows trades against the trend should only be used by the most experienced professional traders, and for all others it is strongly advised to never trade against the trend.
The simplest system for a downwards trend like this is to use resistance lines: each time price touches resistance that represents an opportunity to enter in the direction of the trend. Trades may be held until price either reaches support, a target, or if the trade is held for one day if you are a day trader. Depending upon your trading style, your risk management, and management of the equity in your account, stops as always are essential: they may be money management stops, they may be just above lines of resistance (allow for small overshoots), or they may be Elliott wave invalidation points.
Corrections against the trend offer an opportunity to join the trend at a good price.
The aqua blue trend line is slightly redrawn today to show exactly where price is currently finding resistance. At this point, I would strongly expect this line to continue to hold while the trend remains down. If price breaks above this line, then a larger correction may be beginning to interrupt this trend.
This approach outlined here is just one trend following method of many.
There is a little positive bullish divergence last week: the low for 23rd July did not move below the prior low of 17th July, but On Balance Volume did make a new low. OBV moved lower while price did not. This bullish divergence indicates a correction against the trend to unfold, which is what has been happening. This correction should resolve this divergence.
The long lower wick of today’s candlestick is slightly bullish, but it is most certainly not a reversal signal. The break below the lower edge of the pennant pattern is more bearish than this candlestick is bullish, so on balance more downwards movement would still be expected.
This analysis is published about 06:00 p.m. EST.
Analysis is being proofed now for you and should be ready very soon.
As I went through that process I thought I’d share with you what I’ve learned today:
I was too complacent over the last two weeks, the wave count was unfolding pretty much as expected and was supported by technical analysis. I should have kept looking for alternates, I was too quick to label that triangle complete. Triangles are very tricky structures!
The indicator that I didn’t pay enough attention to yesterday was volume. Thursday’s downwards movement looked like a breakout of the pennant pattern. But it was a small red candlestick and most importantly it did not come with an increase in volume. It was suspicious. My mistake was not being suspicious of my triangle count.
Volume continues to be useful, and I need to pay greater attention to it. If I had done that yesterday I would have looked for an alternate which didn’t see the move down as a breakout but saw it as part of the correction.
A breakout should come with an increase in volume almost always. But then again, almost always is not the same as always!
So in conclusion, volume for today’s up day isn’t stronger. It’s not indicating an upwards breakout.
I just bought back into DUST averaged under $34 and looking forward to GOLD hitting 1,171 early next week then I sell.
Hitting 1071 in 1 to 3 days not 1171, typo again. Love that Lara just said 80% probability for 1,071 projection.
This will be my summary today:
It is most likely a triangle has just ended a fourth wave correction. This should be followed by a fifth wave down which is highly likely to make at least a slight new low below 1,072 to avoid a truncation. The target is again 1,071. This first idea has a higher probability, maybe about 80% Alternately a flat correction may be continuing, which would be confirmed if price moves above 1,105.18. If that happens then upwards movement should continue to at least above 1,119, the target is 1,121. This has a low probability, maybe about 20%.
Lara thanks for your great comments today. I look forward to your analysis.
Have a great weekend.
Lara any idea how long ( hours or days?) for gold to reach down to 1071 target as it is the weekend and would need to exit bearish position before minuette wave (iv) correction.
One to three days, with less more likely than more.
A flat looks wrong. A combination does not work. I’m left with an alternate as a double zigzag which should move higher, maybe up to 1,142. But that has a REALLY low probability. Because then subminuette wave ii would be a single deep zigzag and subminuette wave iv would be a too long deep double zigzag.
I’m concluding that it is much more likely subminuette wave iv was a triangle and it’s over now.
So yes, one to three days to 1,171 is my conclusion.
You mean 1071?
Sorry, yes. My bad. 1,071.
This is what I have so far, it has a reasonable look to it. The invalidation point is extremely close so the risk / reward should be pretty good. If I’m wrong losses on this idea should be relatively small, and reducing position size / leverage can make it smaller.
When triangles are done the move out of them is often quick and short.
Lara, can a move to your original flat target at 1121 be ruled out?
No, not ruled out, but it does look very strange because the C wave would have a huge second wave correction moving sideways.
I’m leaving now to look at combinations or flats for this fourth wave. If I find it has a better look than the triangle in the next half hour I’ll jump back in here and let you all know.
For now the triangle which should be complete would be my main wave count. It’s neater, as Tham says.
A double zigzag actually looks all wrong on the daily chart. A flat correction will be my only alternate.
This triangle idea looks like it would work better with Gdx..
Sometimes I get it wrong. This is most unfortunately one of those times.
This is what I am thinking so far:
The last downwards movement to today’s low does not subdivide well as a five; it is not an impulse. I will look to see if it can subdivide as an ending diagonal. But it is extremely unusual for an ending diagonal to end a truncated fifth wave. That is so very rare, it has maybe 1% probability. This is much more likely to be part of the prior correction.
This correction is most likely subminuettte wave iv. It may also be minuettte wave (iv) but that doesn’t have the right look to it.
It fits okay as a triangle, invalidation point 1,105.18. The downwards move was a continuation of wave D, and this upwards move absolutely must be the end of wave E because there’s almost no room left for it. Someone’s posted a chart of this below. That will probably be my main wave count today.
I’m looking now for alternates and checking subdivisions.
My conclusion is the final fifth wave of subminuette wave v still has to unfold down, it still needs to move below 1,072 to avoid a truncation.
Redraw the orange channel; the new first line from today’s high back up to the high of subminuette wave ii.
Volume is still relatively light, lighter than the prior strong down day within this sideways move. Overall the picture is more bearish than bullish.
There is still a trend and ADX still indicates it is down. The EW structure still is incomplete.
Today’s movement against the trend which I did not expect illustrates perfectly the need for good money management and stops. Stops are essential. Trading will always incur losses, even the best traders and systems. Making sure your losses don’t wipe out your account is essential. Making sure your losses are losses you can handle is essential.
Lara, I’m so glad you appeared and also posted a chart for us. It is a TERRIFIC help. I really appreciate the elliott wave analysis you do. I’ve gotten used to the fact that, yes, even Lara isn’t perfect. Still the best!
I’m hoping to have a good weekend because this analysis again is confirming imminent move. But that darned dust chart is horrid to trade from.
Wishing you a good weekend too!
Thank you. Yes, I’m not perfect and make mistakes.
I’m trying to figure out how that D wave of the triangle subdivides. It’s really tricky.
One small thing I can see is the first drop from today’s high at 1,103 subdivides perfectly as a small five on the five minute chart.
That means at least a little more downwards movement short term.
Hi Lara
Thanks for the update.
My losses today are because I didn’t take gains yesterday and I was given some very good advice to do so.
Currently a poor trader looking to learn from good traders!
Have an awesome weekend.
A
Aidan, I had a ‘Gut feeling’ last night not to buy back in DUST even though it didn’t agree with Lara’s analysis. No other way to explain it but went with my feelings over the logic. If gold hits 1071 early next week, I’ll sell DUST as I believe then may be a longer correction. I may also buy GDX. I feel more comfortable with a regular ETF over a 3 x ETF when gold is bullish. There’s those feelings again. To each their own.
80% probability in DUST, while heading for a new low in gold for well over 5 years, that will feel good over the weekend. I’m already imagining DUST peaking maybe at about $40 next week and selling fast. DUST hit a high of $39.82 when gold hit $1,072.30 on July 24th
http://stockcharts.com/h-sc/ui?s=dust
Thanks Richard
Its the hitting of $40 IN DUST that keeps me going 🙂
Going to stay here, keep learning, keep open minded and hopefully buy myself a home soon!
Very best wishes
Aidan
The thing is, losses are inevitable even for the most experienced traders.
And that’s where stops and money management come into play.
A great rule is don’t risk more than 2% of equity in your account on any one trade. If the stop must be placed so that your 2% rule is broken then reduce position size until the rule is met.
This allows 10 losses in a row to not wipe out your account.
It may mean you trade smaller positions for a while, and have smaller profits to build your account back up, but you’ll get there eventually.
The key is to stay calm, unemotional and manage risk.
Even a bad to average trading system can profit long term with good risk management.
If you’re not using good risk management then you may be letting the emotions of fear and greed dominate your trading. And trading is probably 80 – 90% psychology!
When I have a position which shows a profit I always move my stop to just beyond my entry point, and I try to do that within 24 hours. That way I may get stopped out for a small profit, but I avoid losses whenever possible. Perhaps try that next time?
“Whichever target turns out to be correct (1,071 or 1,038 – 1,035), an end to this wave down would only be confirmed with a breach of the upper edge of the orange channel at the daily chart level. That would indicate an end to minuette wave (iii) and the start of minuette wave (iv).”
I think this is the most important passage in the above analysis.
Surely we should be looking to enter NUGT/JNUG?
Perhaps, but I’m not so sure. It would mean accepting a pretty big truncation, which i don’t think Lara would be ready to do until after the fact once it’s proven. It’s more likely that the lines will be redrawn to show either a different ending to subminuette wave iv or perhaps even minuette wave iv.
i believe the daily chart breach was to signal which one of those targets were right, not whether the wave was over with a truncation.
Take a look at John’s gold chart below. Maybe Lara will go with something like that.
If so, best buy-ins are at trendline touches, not midline, for risk/reward.
There are some fast and furious trading opportunities in both directions today. However gold is like a YoYo today and one has gotten used to buying DUST cheap on dips and then going with the flow. The bearish daily wave count is still valid and as Lara says, the trend is down. Lara will arrive at about 3:30 pm EST and provide some quick guidance that is surely needed to adjust our positions for the weekend.
“If price breaks above the aqua blue trend line, then a larger correction may be beginning to interrupt this trend.”
It’s an overshoot of that aqua line, not a proper breach. Which is why classic TA would allow for movement a specific market value beyond support / resistance lines, usually 3%. I think in this instance that’s too big.
Volume for today so far is relatively light. And during this sideways move it’s still a down day which is starkly stronger than the rest.
I think this was a backtest of the upper pennant line. It has the tiniest overshoot.
This may bring RSI back up from oversold once we have the data for it, once today is done. If that happens then it may be easier for Gold to fall from here.
I’m now going to leave comments to focus on alternates. I can’t do that while I’m still here.
Good luck everybody, and risk management. It’s the MOST important technical aspect of trading.
Managing emotions is the other thing though, if this has you rattled maybe step aside and come back calmer (that’s not directed at you Richard, just generally).
I understand and I am calm and your wisdom is always appreciated.
Gold trading Like riding the rodeo!!!
Yeehaa a rodeo and I have no shares and waiting to buy DUST cheap.
Tham mentioned an upper target range for Gold of 1110 – 1112.
“My count shows a drop to anywhere between 32.54 and 32.20.
That would be the low, after which price would rise significantly.”
I will be adding at the target price.
He says in the next paragraph:
“My alternative of the lower target at 27.61 looks at the case in which DUST correction is not over. That now has a lower probability, and corresponds to the truncation case in gold with a run-up towards 1130. After that, DUST prices would reach for the stars.”
Looks like bumpy ride ahead — take a look at John’s Gold chart. Liking it as long as EW rules are met.
Just wondering: With a H 1102.70 / L 1079.30 probably now 1077-76 has been hammered in as support which will be hard to take out ….
Lara, thoughts on one hour Gdx chart?
And this for gold…?
Gdx would follow along with gold for blue 3 & 4 and then ignore blue 5 in anticipation of lower pog.
Ignore black 2
That looks pretty good. I’d want to see how the proportion looks at a higher time frame.
In light of today’s move:
If you are in a position:
– What is your target exit price – Dust/Nugt?
If you are not in a position:
– What are you looking/ waiting for to enter?
trying now to decide, as I have purchase ability on monday as well as currently holding shares. To sell today’s at break even, or let it ride because I want a large share holding for big down move and today’s sale wouldn’t be available to me till Tuesday [ maybe soon enough] Multiple variables in my decision process.
edit: I’m looking at Tham’s projection where 1099.55 was not end of micro 2, but submicro a within micro 2, and anticipating submicro c ends micro 2 around 1110.12 as a place to add to current position. This all translates into multiple re-testing of recent large triangle breakout. (subminuette iv) But alas I am not an EW analyst.
Please know that it is risky to make judgements based on others views and one must ultimately do their own research and choices.
edit: I fear that I missed the dust daily chart exit –should’ve been this am pre-market
edit: however, dust hourly chart shows Bollinger Bands back inside Keltner Channel-READY for big move. (is that up, or is that down??) Honestly I think daily chart on dust is showing consolidation for a higher price breakout, based on Lara’s final gold projection around 950’s — this diverges from Tham’s perspective on dust daiy
There is no divergence. My count shows a drop to anywhere between 32.54 and 32.20. That would be the low, after which price would rise significantly.
My alternative of the lower target at 27.61 looks at the case in which DUST correction is not over. That now has a lower probability, and corresponds to the truncation case in gold with a run-up towards 1130. After that, DUST prices would reach for the stars.
I used the word divergence in relation to our perspectives – not meant to confuse you. I see dust daily chart consolidating but unless there is a large EW correction like minuette iv I don’t think it’ll go to 27 – but I could be wrong.
dsprospering diverged from Tham – uh oh. : )
Appreciated Tham and dspropering.
Both helpful and informative.
Help a novice out here. My screen is definitely showing that the DS has crossed the T.H.A.M. and is showing increasing divergence. Does that mean gold will go up or down? 🙂
Lol. Tham is Very smart I think. just re-read his post:
[Dust] “anywhere between 32.54 and 32.20. That would be the low, after which price would rise significantly.”
Nobody’s perfect. I have been wrong countless times. This time may be one of those.
It is just that the big picture is easily discerned; it is impossible to get it wrong unless one has a very strong bias/prejudice, hence distorting data to “prove” his pet theory. The story is different when it comes to lower degree waves, especially in REAL TIME. The number of possibilities are staggering and beyond the human brain. This is what makes trading interesting. We trade based on our best guess. Unfortunately, that is projecting from the past (at least projecting from the past few hours/minutes). Non-linear entities do not have a linear relationship, and may not even have a statistical bias. The only certain way is to use a powerful computer running on Chaos Theory rules. However, if you wait for a “perfect” setup, and that is not 100% guaranteed, then you could wait forever. Tried and true trading practice involves setting entry points and suitable stops even before one enters a trade. That prevents greed from setting in (refusal to exit a trade), or worse still snowballing losses. This has been my experience. I have paid dearly to learn this.
Hi dspropering.
The wave count you mentioned was invalidated by a move up above 1102.02. Please refer to my later post. I reckon the up move would end at 1110-1111/1112. There is a minor change to that post. Submicro 4 was deeper than expected; it ended at 1092.78. We are now slowly moving up in submicro 5 / micro c / subminuette 4. Currently still at the first subwave. Long wait! Probably can go to sleep as I am not keen on NUGT; the returns are so minimal that it is not worth the stress/effort, you would need to buy 10000 shares or more of those to get some respectable gains.
so we are only about $15 on XAU from end of subminuette iv? meaning subminuette 5 arrives about when do you think? because micro c is the end of submin iv, right? or am i missing something(s)
You are right. So far as I can see (remember I wear glasses), that is the most likely scenario. I am not sure of the timing though. My best guess is my earlier estimate of a day or two for the upward countertrend correction to end. There is not much by way of news to stimulate prices one way or another, so inertia sets in.
Tham, do you have a EW chart you can share w/ your current perspective? It might help everybody.
Hi Tham,
I bought 15,000 shares at yesterday’s close. Then read Laras Report and spent the next hour plus getting rid of it after hours. I’m worn out!
Thanks for all your input it’s going to make my nap more restful!!
Hi Robert
Out of interest what in Lara’s report made you sell?
I held and read the report and watched video and was comfortable doing so.
A
Hi Aidan, I think you held DUST. I bought Dust Wednesday after Dust settled and sold Thursday. I bought NUGT at close Thursday, Laras statement, increase in downwards momentum, made me doubt my own analysis.
That’s right Robert
Next time we will get it right mate… next time…
Hi dsprospering. I usually don’t draw up charts. It is too time consuming especially to annotate all the data. I much prefer to tabulate the figures and calculate from there. This is especially so when I have to juggle the time between monitoring the day trades. I am quite at home looking at numbers.
Ride the trend. My intent is to hold DUST thru ups and downs to the 1035 target, then evaluate. Possibly add more if DUST has a big drop.
Day trading best left for for very experienced or very lucky.
I wish I had done this before selling DUST at $15.60!
What was your starting point Davey?
Aidan, no specific start point, bought in over time after Lara’s trend confirmation target met. I am not a day trader, I ride the trend. Costly lesson I learned was never bet against the trend.
DUST 1st minute of the open had a range of between 32.42 and 33.92.
July 28th Tham gave out a possible low target of $27.61 for DUST.
Gold low today was 1,080.11 at 5:38 am
Gold high today was 1,103.59 at 9:31 am
gold low during market hours was 1092.78 at 10:38 am
Is gold likely to bounce up to a new intra day high or continue down for awhile?
As you know, predicting what is happening in corrective waves is difficult.
On pmbull.com 1-minute chart, I can see a completed zigzag down since the high this morning. The correction so far is 45-50% which is not near a Fib number. The correction could be over or could continue.
Alternatively, we could be in wave 4 of an A wave of a bigger correction from today’s high.
The third choice is that the rise this morning was wave C of a flat which is part of subminuette iv. If that wave C completed at today’s high, then we have started down.
On 27 July hour wave count :
May be this is still in play????
I like this. This could be a better fit than what I posted below, simpler, neater. Only thing is that what I thought would invalidate this wave count. Let’s see whether the “e” wave would exceed 1105.18.
Tham sounds like your suggesting an “e” wave bounce up above today’s high.
Earlier today you mentioned 1,111.21.
Dust would be cheaper at either area 1,105.18 or 1,111.21.
Perhaps we will get clarity on that today or else at about 3:30 when Lara said she would show up.
??? In order for wave iv to complete gold needs to close below 1080?
I have it at 1080.11. That should be “d” on the graph.
Alan Lara wrote this: If subminuette wave iv is a regular contracting triangle, then micro wave D may not move beyond the end of micro wave B below 1,073.56. Micro wave E to complete it may not move beyond the end of micro wave C above 1,105.18. Micro wave E is most likely to end short of the A-C triangle trend line particularly if it finds resistance at the orange trend line. Alternatively and less likely, micro wave E may overshoot the A-C trend line.
Exactly. 1080.11 > 1073.56.
The only difference between the counts is that I have the final rise above 1105.18. If so, then the more convoluted count is correct and this simpler triangle is wrong.
Interesting possibility. Well remembered.
Yes. This will probably be my main wave count today.
Well, after the upside move, its back to looking a break below 1090 to occur…. grrr
Any possibility this was e wave up?
Can you give some context for that? Are you talking about an e wave of a triangle from 2 days ago?
yes
See Tham’s two posts much farther down. 9:26 am and 9:35 am.
Thanks
Here is a possible wavecount based on Lara’s work and no change in degree of labeling.
subminuette 1 (up) of minuette iv (up) with invalidation in the 1160-1170 area (not a typo, I really mean 1160-1170 area) at the end of minuette i.
We need help from Tham and others who are better at this than I am.
Yes. Where is Tham? (maybe busy at EW!)
He’s been posting below! Scroll down a bit.
thanks alister, found him.
No problem – we’re all glad of his thinking.
Hourly chart has been invalidated above 1095.55
Now at 1096.83 at 9:21 am
I’m glad I sold DUST Thursday. Now how high can it go?
Does this mean the big drop is over?
Any wave count?
Hourly chart has been invalidatied above 1095.55 at 9:20 am.
Now at 1096.83 at 9:21 am
I’m glad I sold DUST Thursday. Now how high can it go?
Does this mean the big drop is over and multi day rebound started?
Any wave count?
A new wavecount is not easy. We need to look for ending diagonals, which means examining for 3-wave versus 5-wave behavior. We also need to see how large the current volume is on this upward move. We also need to consider change of degree. Was it Matt who gave his view yesterday that minute III or V was about over?
I suggested minute 3 could be over, and minute 4 could reach 1110 or higher. I don’t know if that is happening but it looks more possible now
Bloody Typical – I held.
Livid.
Dust in premarket, I saw 39.53, now at 34.50. Did gold bottom already? E.W. invalidation needs a new E.W. count please.
edit: Orange Daily trendline broken. Per Lara’s video, downward movement is over
Downward movement cannot be over due to large truncation.
Not impossible, not ruled out, just unlikely/low probability. Sometimes low probability things happen. At the moment, we are suspecting a truncation but it will take time and Lara’s help to be confident there was a truncation.
I can’t imagine a truncation that large is reasonable. Much more likely degree of labeling should change and this is just a larger correction imho
The final fifth wave would have to be an ending diagonal because an impulse won’t fit at all. It’s extremely unusual for a truncated fifth wave to be a diagonal. About 1% probability.
What is way more likely is this upwards move is part of the prior correction, and it’s either over now or should be very soon. So that’s what I’m working on.
Wave count hour ly got invalidated at 1195.55.
What is next????
Current wave count micro 3 invalidation is pretty close at 1195.55. If it gets invalidated what is next ??????
Hourly chart has been invalidatied above 1095.55 at 9:20 am.
Now at 1096.83 at 9:21 am
I’m glad I sold DUST Thursday. Now how high can it go?
Does this mean the big drop is over?
Any wave count?
The ’10’ / ’11’ malaise is still epidemic! Just kidding.
On a serious note, I expect and am happy that it happens now before the market opens. It would be catastrophic otherwise as many of us would have shorted, and are caught out quite badly. (For selfish reasons, I sold off my DUST holdings at 36.60, according to my DUST wave count).
What this means is that 1095.55 is NOT micro 2, only submicro a within micro 2. Micro 2 is now an expanded flat because the drop went below micro 1. It was 1082.62 – 1095.55 – 1080.11 – (I expect 1101.03, the 1.618 retrace). It should drop from there. Invalidation 1102.02. If so, excellent shorting opportunity.
Moments after I posted, price went above 1102.02. This can only mean one of two things: either the drop is over (not that likely because the truncation is quite sizeable), or subminuette 4 continues as some combination. This is also not a palatable option as it means probably another couple of days of waiting. Select between a rock and a hard place. Sigh.
This may confirm my suspicions for my lower target for DUST at 27ish, posted two or three days ago.
Tham I like your suspicions for a lower target for DUST. Your lower target was at 27.61. It that a possibility today or would it take longer?
I like it because I have no DUST and daily wave count is still bearish. Good you already sold DUST Thursday.
I am inclined to believe that subminuette 4 is not over. The target is more normal at 1111.21, the 0.382 retrace of subminuette 3.
It has most likely gone through 1072.01 – 1102.02 – today’s low at 1080.11 – (1110.12, where micro c = micro a). This yields a 1.09 difference at two degrees and is quite likely to be correct. Now completed submicro 4, going for the final rise. Whew, shorter in time duration than I thought.
actually I liked the sound of a couple of day’s off, I need time to recharge, exhausting week
There is a chance that it could be faster, as I considered above.
All this mess is caused by Yellen. Hyping investors about a “sure” rate hike, and then reneging at the crucial moment. What a hypocrite. (At least Bernanke meant what he said).
It appears that prices are now resuming their normal course of events.
Wavecounts:
submicro 4 (up) of micro 3 (down), invalidation around 1088.
or
miniscule 4 (up) of submicro 3 (down) of micro 3 (down), invalidation around 1084.25.
Price reference pmbull.com
Please be advised that I am still on the lookout for a truncation because my non-EW studies show the 24jul15 low at 1072 as a possible bottom and we are in the process of doing a secondary test of that bottom.
Yesterday I missed buying PUT option on Dec gold by small amount when gold was trading at 1089. Ouch!!! Next time when gold corrects in wave iv.
JUST THINKING: Whew~! Finally Gold price broke below 1080…. As even weekly RSI begins to dip below 30, a small bounce can be expected to not likely reach 1089-90 (pivot) / 1095 range for rejection subject to break above 1085 (upturn in MacdMA is seen indicating possible short term rally)…. Sell pressure is being maintained though with stochastic %K below %D for downside at risk all the way down to the lower band at 1062 with up an trending support at 1078-77 and last week low 1073 below that possibly engaging before price try’s to tag lower band….
Great analysis – think that me exactly what is playing out now.
Would you agree?
Gold may reverse today by end of the day appears. After hitting Lara’s target of 1060 may bounce.
Lara your ‘Chartered Market Technician’ skills are really helping provide additional clarity. They enable more trading confidence and success for us, while other traders who unfortunately don’t receive your daily EW Technical Analysis are left confused and undecided on which direction to trade and many are still bullish, ouch.
Wow, this analysis sounds like gold may end up being a Snakes and Ladders game today. Numerous twists and turns and unsure when minuette wave (iii) would be over and minuette wave (iv) up would have begun for a week.
I’m sending out the Elliott Wave, Batman signal into the night sky for EW count experts to please be on board during market hours today for some appreciated count clarity so we know when to take our profits off the table and end the week getting more profits today instead of losing them. Prosperous trading to all.
I’ll be up early tomorrow so I’ll be here before NY closes, probably about 3:30pm.
Thanks Lara that will help as you said gold may reach the targets in the next day ‘or so’. We may need to adjust our trading positions before the market close. It appears the EW Bat signal is working as we already have one top notch EW wave counter on board at 3:30 pm.
Gee, I didn’t think the Snakes and Ladders roller coaster would start immediately at the market open leaving us in confusion. I have no gold shares so on the fence now wondering which way gold will turn next and if I should buy or stay out until Lara’s comments as she said, ” I’ll be up early tomorrow so I’ll be here before NY closes, probably about 3:30pm.”