
Primary wave 5 is in its early stages.
The Elliott wave count remains the same.
Summary: Fifth waves on commodities are often very swift and strong. The target for this one to end is at 21.96 and may be met in another six months time. A shorter term target for an interruption to the downward trend is at 49.96 – 48.52 which may be met in four days time.
Changes and additions to last analysis are bold.
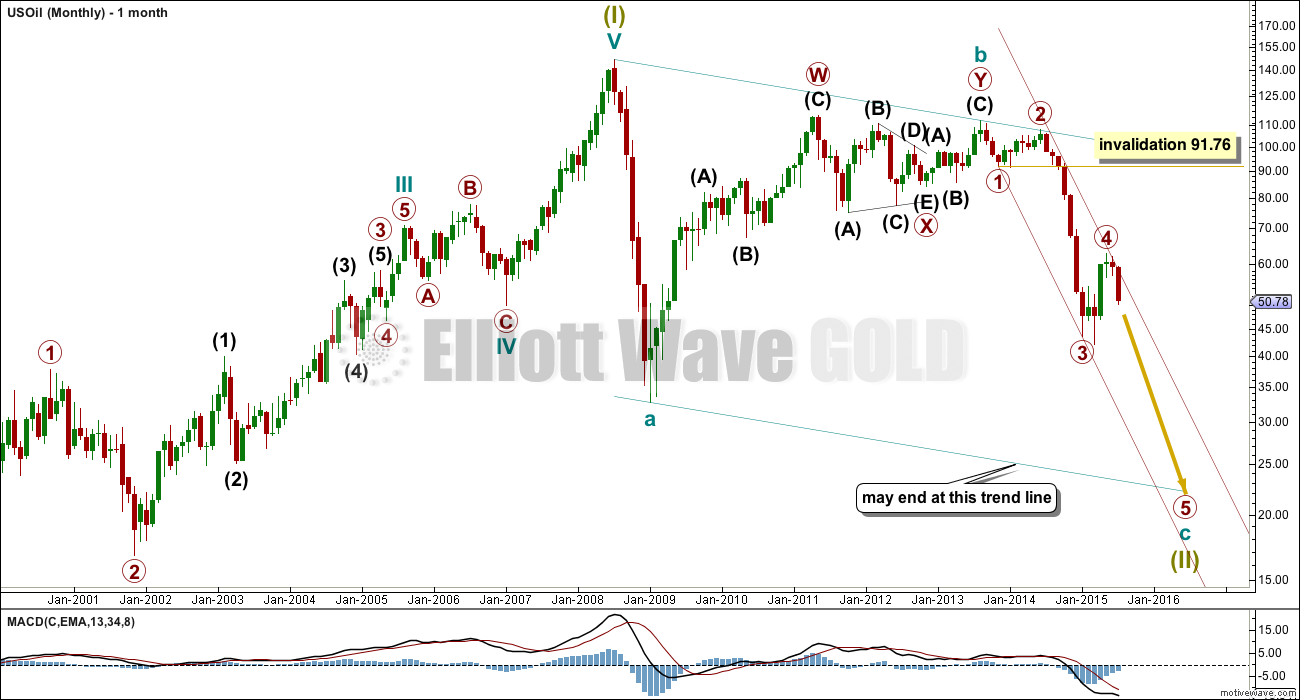
MONTHLY ELLIOTT WAVE COUNT
Click chart to enlarge.
This wave count sees US Oil as within a big super cycle wave (II) zigzag. Cycle wave c is highly likely to move at least slightly below the end of cycle wave a at 32.70 to avoid a truncation. Cycle wave c may end when price touches the lower edge of the big teal channel about this zigzag.
Within cycle wave c, primary wave 5 is expected to be extended which is common for commodities.
Primary wave 4 may not move into primary wave 1 price territory above 91.76.
Draw a channel about this unfolding impulse downwards. Draw the first trend line from the lows labelled primary waves 1 and 3 then push up a parallel copy to contain all of primary wave 2. Copy this maroon trend line carefully over to the daily chart.
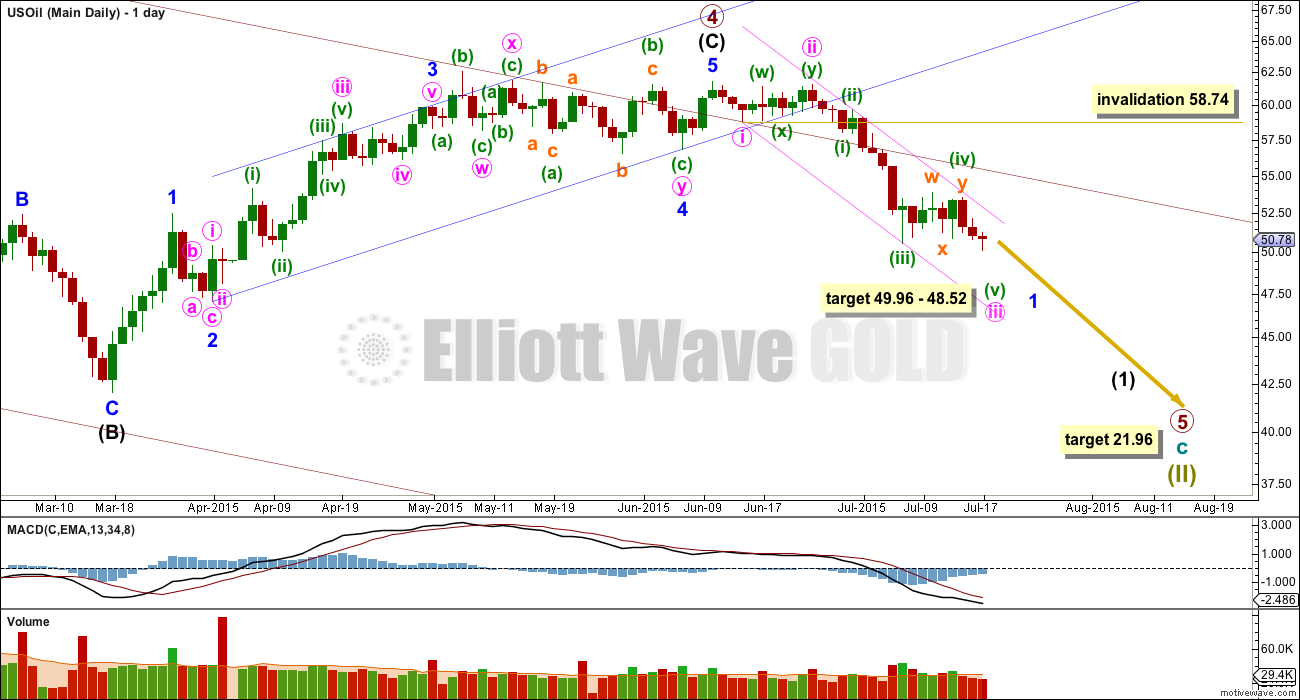
DAILY ELLIOTT WAVE COUNT
Click chart to enlarge.
Primary wave 4 is very likely to now be complete. The channel about intermediate wave (C) is comfortably breached.
Within the new downward trend, a first wave is an incomplete impulse and this is most likely minor wave 1.
Within minute wave iii, minuette wave (iii) is 0.17 short of 2.618 the length of minuette wave (i), minuette wave (ii) was a shallow 0.47 zigzag, and minuette wave (iv) exhibits good alternation as a more shallow 0.32 double combination.
At 49.96 minuette wave (v) would reach equality in length with minuette wave (i). At 48.52 minute wave iii would reach 4.236 the length of minute wave i. This gives a 1.44 target zone for the end of minute wave iii. Minute wave iv to follow may be expected to be a very shallow zigzag, zigzag multiple or triangle to exhibit alternation with the deep combination of minute wave ii.
Minute wave iv to come may not move into minute wave i price territory above 58.74.
The trend channel drawn about minor wave 1 down is a best fit. The upper edge may be where minute wave iv finds resistance.
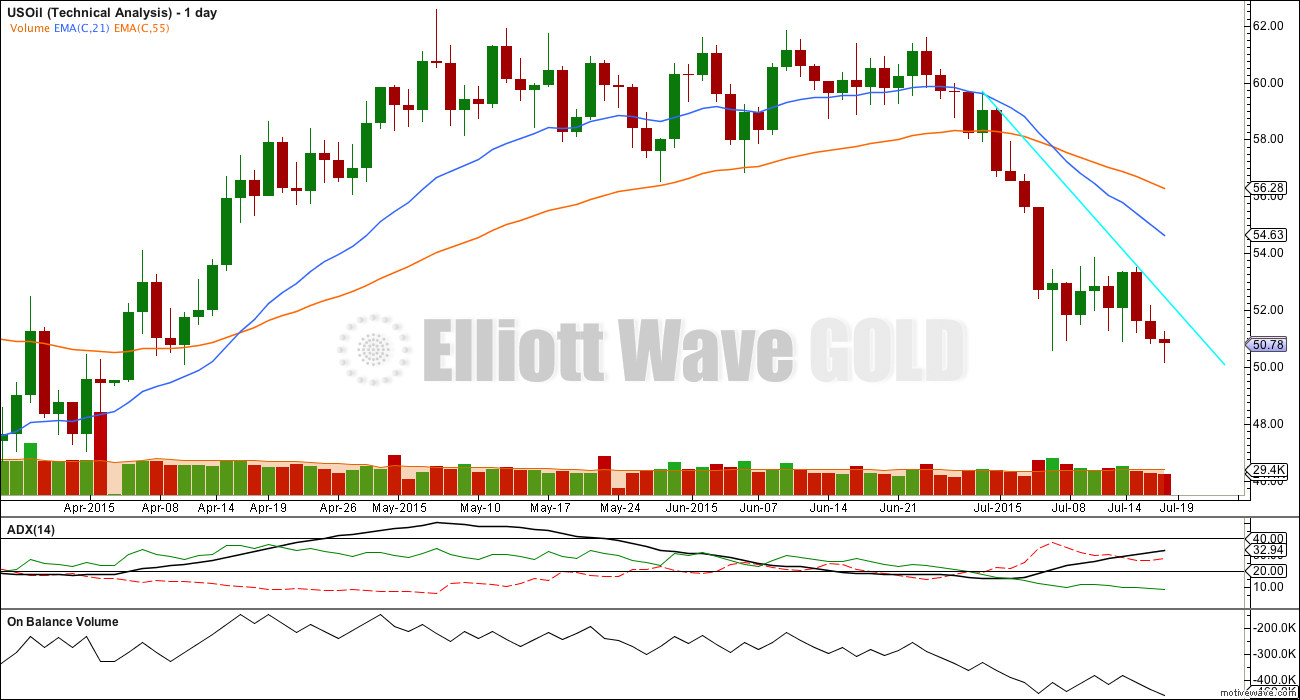
TECHNICAL ANALYSIS
Click chart to enlarge.
ADX is now very clear. The ADX line is above 20 and rising indicating a trend which is strengthening. The -DX line (red dashed) is above the +DX line (green solid) indicating the trend is down.
When a market is trending, then a trend following system should be used for trading. The simplest trend following system uses lines of support and resistance. For a downwards trend, upwards movement may be expected to be corrections against the trend and should end when price finds resistance. As each short term high is made it should not be exceeded again for some time. A trend should be assumed to continue while ADX continues to rise and price remains below resistance.
The market has been falling of its own weight; not all falls in price have been supported by an increase in volume. This is okay, price can fall due to an absence of buyers and so may fall on light volume. At the end of each fall over the last seventeen days volume increased on the last day down. This pattern may repeat. As at the end of this week there was no increase in volume, so it may be quite likely that next week price will continue to fall. Look out for a down day which shows an increase in volume to indicate a potential short term low.
On Balance Volume very slightly agrees with price; as price falls OBV trends lower. The last low in price to end the week corresponds with a very slight new low on OBV.
The shorter EMA is below the longer EMA, indicating the trend is down.
This regular technical analysis agrees with the Elliott wave count.
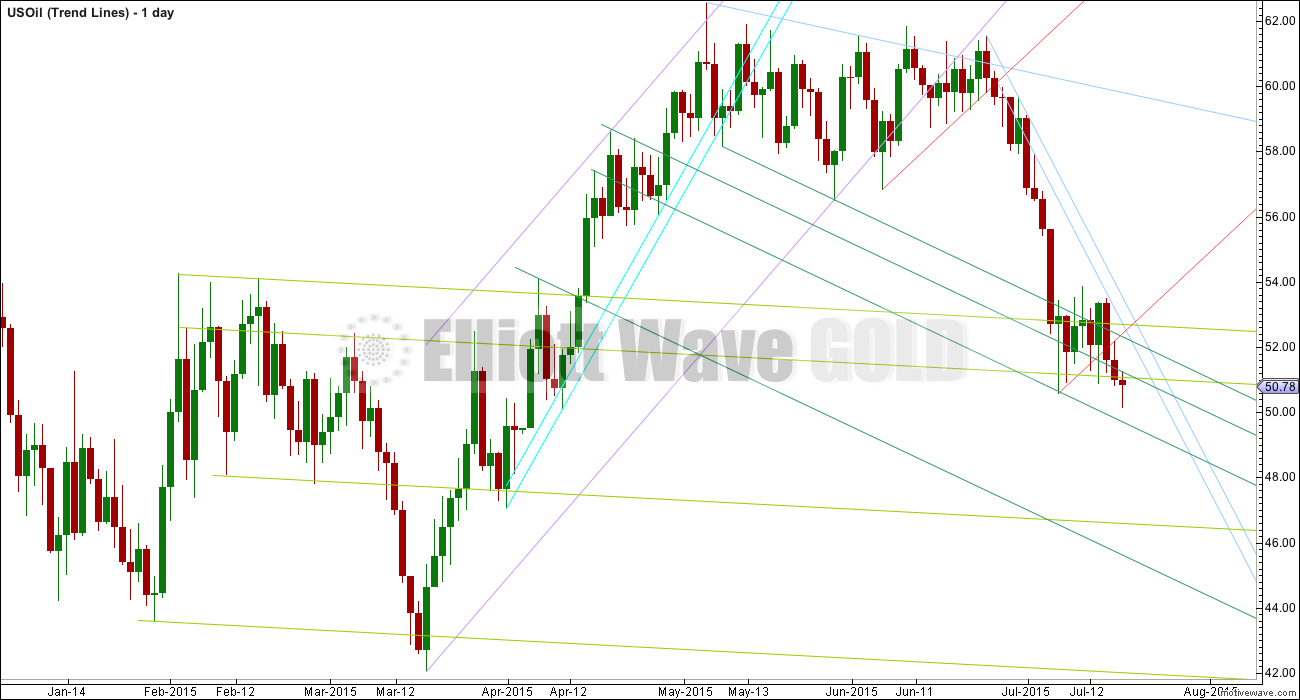
TREND LINES
Click chart to enlarge.
The two aqua blue lines are drawn using Magee’s approach as outlined in the classic “Technical Analysis of Stock Trends”. These were both breached on 15th May indicating a trend change. Since the breach price has moved lower.
The other trend lines are my own. I use this approach to indicate potential areas of support and resistance.
This analysis is published about 12:34 a.m. EST.
Oil gets all the headlines but natural gas is at a curious juncture (in my humble Elliott Wave opinion). I’m curious if you have ever taken a stab at this market (appropriately named the ‘widow maker’ as it is the most volatile commodity on a statistical basis). A lot of energy companies are just as/even more dependent on this commodity. thanks
No, I have not. It sounds interesting; higher volatility = the potential for bigger profits (and of course higher risk).
I am considering an idea which may change the format of presentation here on EWG to include analysis of more markets more regularly. Maybe this would be a market members would like to be analysed weekly…
Watch this space. I’m still figuring out how it may work.
That is a great idea. It would enable us to touch base more often, and checking whether our calculations about price movement are in sync with yours.
Thank you for this.
Hi Lara,
thank you very much for this instant update
Kindly
Ursula
Thanks Lara for the timely update.
Just a query. With this price movement, it is possible to reach the target of 21.96 by moving the labeling degree up by one, such that your Minor 1 is Intermediate 1. Then, applying standard Fibonacci ratios to the five intermediate waves, the target of 21.96 can be easily obtained. The waves could be 61.82-45.09-55.43-28.35-38.70-21.96.
Yes, I’m sure you’re right. I need to move my degree of labelling up one.
Hi Alan;
I am looking at your comments with great interest. Would you mind to explain in detail how you have derive the number from?
Thank you in advanced.
Rachel
Hi Rachel. My apologies for not responding earlier. I did not look at oil since the post as I was not keen to trade the current movement. I am waiting for Minute 5 / Minor 3 (this is the movement up one degree as I alluded) before seriously looking at the oil market with a view to trade. Lara has the target for this at 49.96 or 48.52. I calculated that Minor 5 / Intermediate 1 would end at 45.09.
From there on, Int 2 retrace = 0.618 * Int 1
So, Int 2 = 45.09 + 0.618 * (61.82 – 45.09) = 55.43
Similarly, Int 3 retrace = 1.618 * Int 1
Int 4 retrace = 0.382 * Int 3
Int 5 = Int 1.
You can work out the rest yourselves.
Tham, would you put a rough timeline on hitting 21.96 target?
I understand timeline is difficult but would appreciate your opinion or maybe call it your experienced guess on a timeline.
Hi Davey. Time analysis is the weakest part of my repertoire. I don’t do it often as it has a much greater tendency than price for errors. Moreover, I have seen what most analysts do and it tantamounts to being a little bit better than guessing. That is why you have “gurus” calling for market crashes or trend changes umpteen times and nothing happens; the trend inertia continues on its merry way. Apart from the fact that these gurus may have a personal agenda, I don’t think they really have great confidence in their calls. I have seen people use Fibonacci numbers, Lucas numbers, time cycles, Hurst cycles etc. For the immediate future, time analysis may be accurate, but the further in time one projects, the more fuzzy it gets. Such is the nature of non-linear entities.
From my experience, oil is a slow moving market compared to others. It is a much easier market to analyse in terms of price movements because of this. It lends itself very well to EW analysis. If you trade the commodity itself, it would not be an issue unless you have a cash flow problem. The problem is exacerbated if you trade leveraged ETFs like UWTI or DWTI due to the time decay effect.
My strategy is to ride the trend. As long as the trend goes in one direction without significant pullbacks, I go long. There is less stress compared to trading highly volatile markets in which close monitoring is often required. I will lose a bit due to time decay but the leverage takes up the slag. I rely on trendline analysis coupled with candlestick patterns to determine the possibility of pullbacks.
I will use Lara’s guide of 6 months for the oil market to bottom. In any case, I reckon it is best to play by ear.
Thank you Tham for your most excellent comment.
Especially your comments on time predictions for price targets. I agree completely. It’s the hardest of all, and has the most room for error.