
A downwards breakout was expected for Monday, but did not happen.
Upwards movement invalidated the main Elliott wave count and confirmed the alternate Elliott wave count.
Summary: The new wave count sees this correction as minute wave iv unfolding as a combination. The second structure in the double is a flat correction, and the final C wave up is completing with a target for it to end between 1,118 – 1,123 which may take one or two more days to get there; along the way up another fourth wave correction needs to complete. The trend remains down, but for now Gold is within a correction against the trend, so trading during a correction is not recommended. Trying to pick exactly where and when a correction ends is also not recommended. The safest way to approach this market at this time is to wait for the breakout to be indicated by a red daily candlestick with increased volume.
To see weekly charts and analysis click here.
Changes to last analysis are bold.
ELLIOTT WAVE COUNT
Click chart to enlarge.
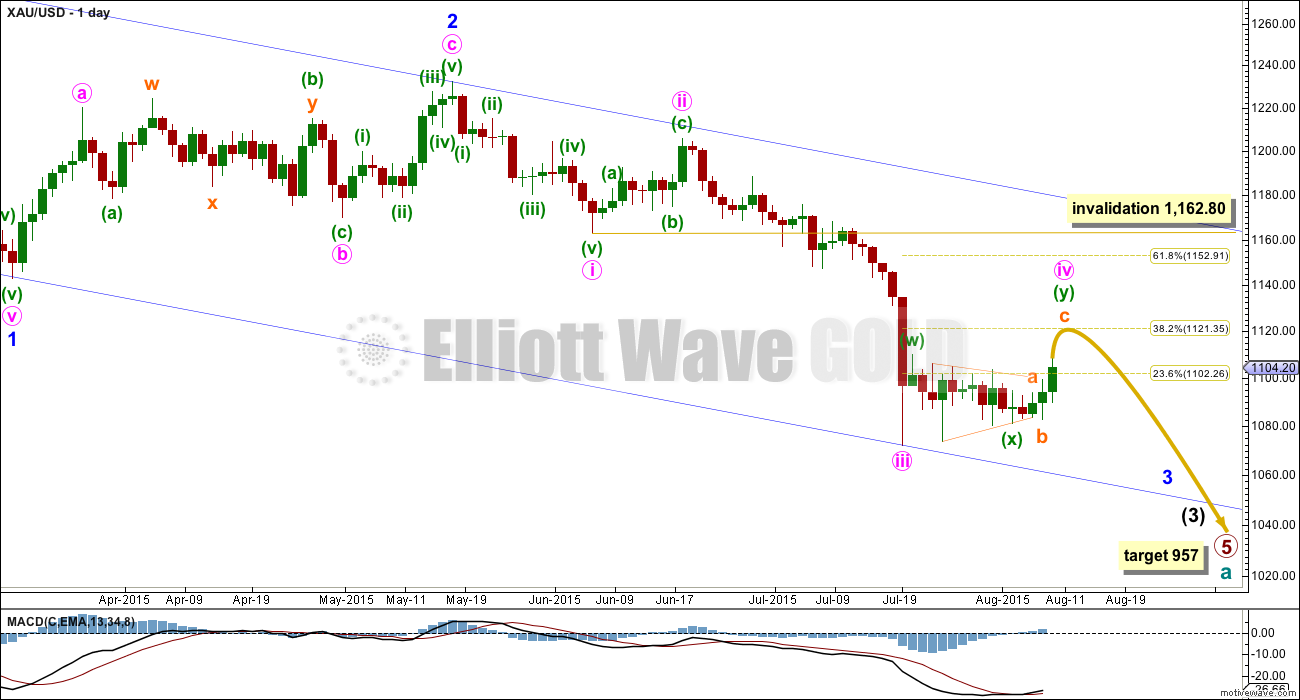
Cycle wave a is an incomplete impulse.
Within primary wave 5, the daily chart focuses on the middle of intermediate wave (3). Within intermediate wave (3), minor wave 3 now shows a slight increase in momentum beyond that seen for the end of minor wave 1 at the left of the chart. Third waves for Gold usually have clearly stronger momentum than its first waves, so I still expect to see a further increase in downwards momentum. The strongest downwards movement is still ahead of us, and now it may be expected to show up within the next fifth wave down of minute wave v to end minor wave 3. Gold often exhibits very strong fifth waves, and when it does this they usually turn up to end its third wave impulses.
The degree of labelling for this current correction is moved up two degrees. It is possible (just, with an unusual looking expanded flat within it for a second wave) to see minute wave iii as over. The duration of this current correction indicates that despite the problem within its subdivisions minute wave iii must have been over and this current correction is minute wave iv.
Minute wave ii was a deep 0.618 single zigzag lasting nine days. Minute wave iv is a double combination which provides structural alternation. If it ends about the 0.382 Fibonacci ratio of minute wave iii at 1,121, then it would also show alternation in depth.
Minute wave iv may not move into minute wave i price territory above 1,162.80.
The blue channel is a base channel drawn about minor waves 1 and 2: draw the first trend line from the start of minor wave 1 (off to the left of the chart at the high of 1,308) to the end of minor wave 2, then place a parallel copy on the end of minor wave 1. The lower trend line perfectly shows where minute wave iii found support. Minor wave 3 should have the power to break through support at the lower trend line; when its fifth wave arrives, then it should be strong enough to do that.
There is no Fibonacci ratio between minute waves i and iii, which makes it very likely that minute wave v will exhibit a Fibonacci ratio to either of minute waves i or iii. When minute wave iv is over (and a downwards breakout has been confirmed), then I will be able to calculate a target for minute wave v to end minor wave 3. I cannot do that yet.
Along the way down to the final target for primary wave 5 at 954, there will be two more big fourth wave corrections: one for minor wave 4 and another for intermediate wave (4). They may be expected to be less time consuming than their counterpart second wave corrections; they may also be expected to be shallow, but they will both still likely be multi week corrections (at least two weeks in the case of minor wave 4 and longer for intermediate wave (4) ).
At 957 primary wave 5 would reach equality in length with primary wave 1.
Click chart to enlarge.
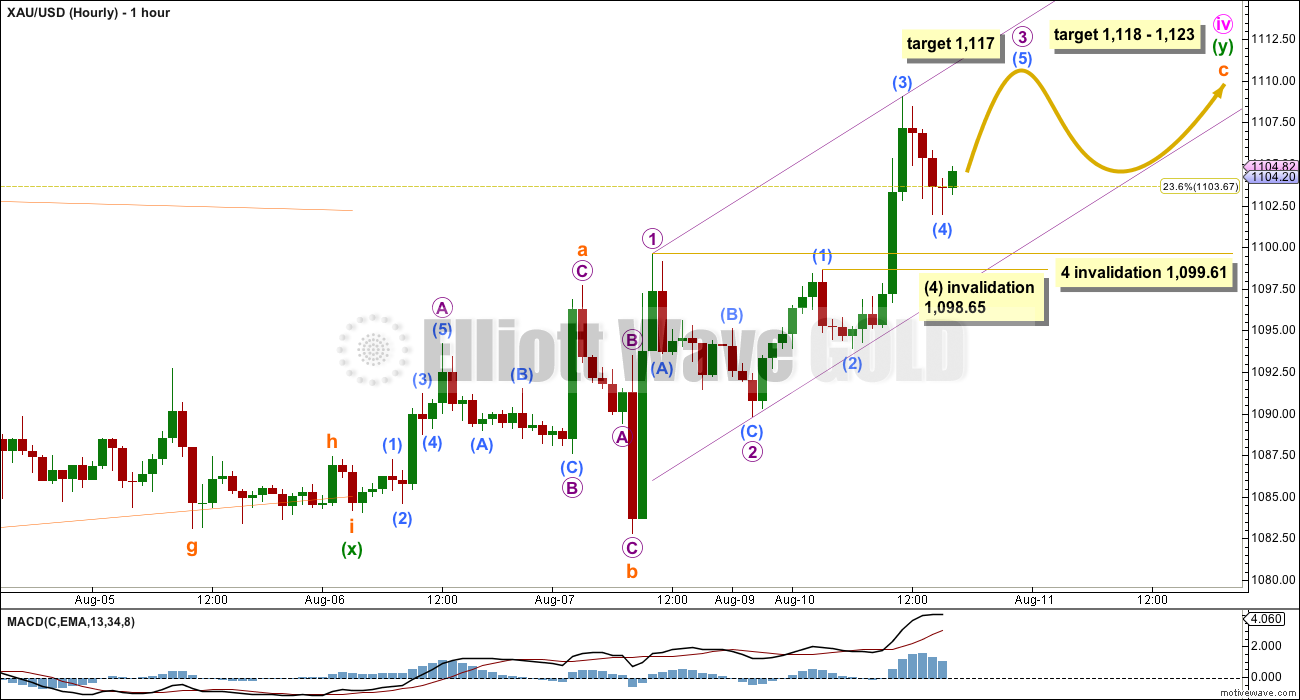
The whipsaw we saw last week, which is labelled here subminuette waves a and b, was problematic as the end of a time consuming triangle. I have reanalysed the triangle, and it fits as a nine wave triangle ending earlier.
The structure for this fourth wave correction is still seen as a double combination, but the second structure in the double begins earlier. This is important because it means the B wave is already over, and was a 109% correction of subminuette wave a.
Within the second structure of the double labelled minuette wave (y), subminuette waves a and b are both three wave structures. Subminuette wave c must be a five wave structure.
At 1,118 subminuette wave c would reach 2.618 the length of subminuette wave a. This would take price up to close to the 0.382 Fibonacci ratio of minute wave iii at 1,123 giving a $5 target zone for this upwards movement to end.
Within subminuette wave c, micro waves 1 and 2 are complete. Micro wave 3 may only subdivide as an impulse. At 1,117 micro wave 3 would reach 1.618 the length of micro wave 1, and also at 1,117 submicro wave (5) would reach equality in length with submicro wave (3).
Submicro wave (4) may not move into submicro wave (1) price territory below 1,098.65
When micro wave 3 is a complete five wave impulse, then micro wave 4 should unfold. It is unlikely to show up on the daily chart as a red candlestick because micro wave 2 does not. Micro wave 2 was a relatively deep 0.58 zigzag so micro wave 4 would exhibit alternation if it is a shallow flat, combination or triangle. It may not move into micro wave 1 price territory below 1,099.61.
Draw an acceleration channel about subminuette wave c: draw the first trend line from the end of micro wave 1 to the last high, then place a parallel copy on the end of micro wave 2. This channel shows where corrections along the way up should find support. As new highs are made keep redrawing the channel. When micro wave 4 arrives, then it too should find support at the lower trend line.
TECHNICAL ANALYSIS
Click chart to enlarge.
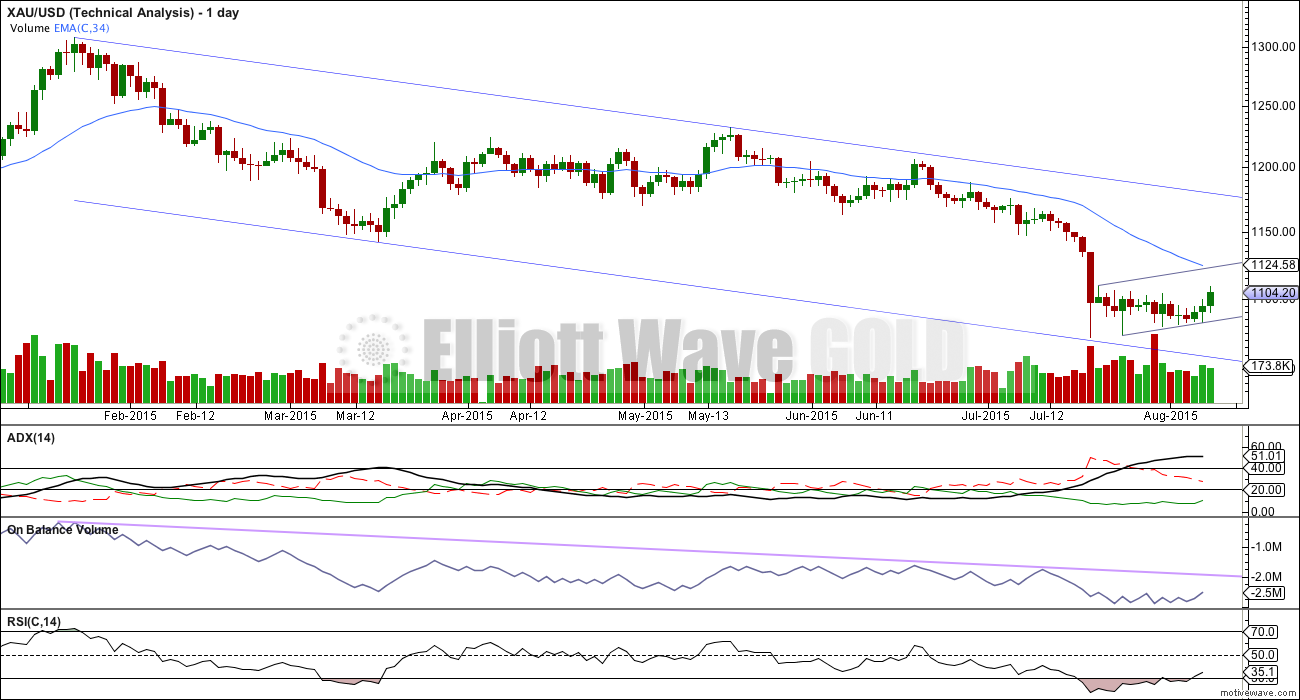
ADX is starting to flatten off where previously it had been rising. Unfortunately, ADX is a lagging indicator and now finally indicates that Gold is within a correction, but we had expected that for the last two weeks anyway. When the trend returns, then it is still most likely to be downwards.
Volume during this current correction still has a downwards day which is much stronger than all other days. This indicates that when the breakout comes from this correction it is most likely to be downwards.
The pennant pattern did not work. Monday did not complete with a downwards breakout, so the pattern is now too long in duration to be a pennant.
Redraw the trend lines about this current correction: draw the first trend line to sit along the lower edge and place a parallel copy on the first high within it. Upwards movement may find resistance at the upper edge. If that happens, then the classic technical analysis pattern may be a flag, which is another continuation pattern.
The blue trend channel is the same as that drawn on the daily Elliott wave count chart. The upper edge should provide resistance, but this small pattern would not be expected to be that deep or time consuming. The lower edge may provide some support.
Draw a long term trend line on On Balance Volume as shown. This trend line has been tested three times, and may show where and when upwards movement ends. Look for OBV to touch that trend line. When it does, then that may be it for upwards movement.
While this correction unfolds, there is still declining volume. Today’s upwards day has lighter volume than the prior upwards day. This rise in price is not supported by volume, and a new upwards trend is certainly not indicated; this upwards movement is part of a correction against a downwards trend.
RSI is returning now from oversold. When this correction is over, then there is again room for the market to fall.
From a classic technical analysis perspective, the safest approach to this market, at this stage, would be to wait until a red daily candlestick on higher volume is seen before any confidence may be had that the correction is over and price is breaking out downwards. When the lower edge of the corrective pattern trend line is breached, then a throw back to that line would be highly likely, and that may be a safer entry point than trying to pick a top and trying to pick an end to the correction.
We know that this correction will end. We may still be confident that price will make new lows after it is done, but exactly when and where it will end is much harder to pick.
This analysis is published about 06:12 p.m. EST.
It appears traders must pay attention to short term up/down of gold using COT data.
Following is the latest COT
8/7 Commercial shorts 268826, Spec long: 181234
7/31 Commercial shorts 273993, Spec long: 180989
7/24 Commercial shorts 316862, Spec long: 183702
7/14 Commercial shorts 307511, Spec long: 189648
Commercial shorts keeps shrinking. From Jul 24 comm short has shrunk by -48036. That is bullish. AT highs comm shorts should be high and up.
By Friday we will know what comm shorts are for today???? Delayed data.
Tham,
Looking forward to your perspective.
Dust’s weekly and daily charts sure say its done for now.
Lara’s updated XAU chart this morning reminded me of the Nov/Dec daily with its leading diagonal going into bull moves. So much to look at concerning gold. Appreciate your views. 🙂
Tham, getting close to your 27 DUST target which a few days ago sounded like science fiction.
oh its not science fiction. (He may be sleeping)
If not, hope Tham comes back on to confirm DUST should NOT go lower than 27, like the 22 area.
Hi dspropering, Davey.
Apologies. I was indeed sleeping. My analysis showed that DUST would be dropping the whole day as it still has to drop to the 27+ target since gold is undergoing an unmitigted upward correction. As such, it should drop direct to the target. Since I am not keen to play the countertrend with NUGT, I took an early night (Singapore time, 12 hours difference from US).
I will post my perspective in Lara’s tomorrow’s report as there is a greater chance that you will read it. I like the old Disqus forum better; it sends an e-mail alert when there is a new posting; this version doesn’t, and it is a hassle to search for posts.
I have two concerns today:
Volume is higher. It’s still lower than a prior downwards day within this correction, but today’s volume is higher than the last three up days. This rise in price is supported by volume.
Sometimes a correction will end with a one day volume spike. That may be what this is. But more usually Gold’s corrections seem to end on declining volume. This doesn’t look like just a one day spike either, volume over the last four up days has been overall increasing.
My second concern is the structure on the five minute chart for this downwards move after the high. It subdivides best as a double zigzag. It may also be a series of first and second waves, but this current sideways drift is getting pretty big in duration.
I’ll have an alternate. It will move everything within minuette wave (y) all down one degree. What if that was only subminuette wave a? As an expanded flat?
That idea would still require downwards movement to 90% of a which would be at 1,087.74.
On the plus side, price is back into submicro (A) territory, so this downwards move can’t be a fourth wave correction within an impulse continuing up because there would now be an overlap between the first and fourth waves. So that idea is invalidated.
Hi Lara,
if i got you right for both wavecounts you ll present the direction is down and invalidation 1119?
Not necessarily.
I’m trying out an alternate idea; what if minute wave iv is a flat correction?
It will take a bit more time to check all the subdivisions on the hourly chart, but if it works then that idea would see some more upwards movement to end it all.
I’m considering the possibility that this upwards movement is not over yet due to the volume profile.
At this stage I’m concerned that it is a very real possibility.
But overall the bigger picture remains the same; this is still a correction, and the breakout when it comes will still eventually be down.
thank you for your fast response
Lara take a look at GDX “hourly” it may help you with gold… not saying my count is right but take a look at the structures.. sub structure..
Let me know if you need to zoom in at any point.
That looks pretty good.
What’s GDX doing with volume at the daily chart level? Has volume increased with the last few days rise in price?
I’ll import the data into motive wave and take a look….
But at the end of the day I’ll never let GDX lead the Gold count. It just doesn’t have the volume to give typical looking EW structures. I don’t think EW analysis is reliable enough on a smaller market like that.
I see volume for GDX is declining during this correction.
My imported data doesn’t show the new high above 14.38 but I’ll take it from your chart that it’s there. That ends the flat correction for a fourth wave.
I’ll move it up one degree though. And I’ll update GDX analysis later today.
Thanks John!
John – Do you have a GDX target?
Are you thinking the up move is over or do we go higher, maybe up to your trend line?
This upward correction has touched barely the 23.6% fib, plus the increased volume today as you mention, it doesn´t look like the MIN wave 4 is over. I think the odds are still ahead in the 38% fib supported by lower volume.
Any further thoughts on what is playing out here?
Lara states that there is a good probability that this would be a strong move. This doesn’t appear to be the case. Interested in thoughts?
Lara has also said recently that strong moves down can often be preceeded by sideways movement where nested first and second waves are constructed. Gold’s behavior today is consistent with that. Right now, I am trying to figure out what the miners are saying.
the market is so quiet its scary.
dang, I don’t know how many times this makes that I posted and Lara posted at the same time. Just saw her comment above.
GLD should move higher. Investors didn’t price in the devaluation of the yuan by China. Fear trade is creeping back, so trades like TLT and GLD should go higher.
Sitting on the sidelines today – Interested to see whether DUST gap gets closed today though.
What was the target for it to close completely?
Sounds like you also need access to charts where you can see the high and low of bars in the past so you can examine gaps carefully. I think there have been some posts in the past week of free charting sites.
Aidan,
Regarding your 3:59pm post yesterday, I suggest you read this book: https://en.wikipedia.org/wiki/Reminiscences_of_a_Stock_Operator
ASAP if you have not already done so. It is about perhaps the greatest trader ever, how he learned the key lessons (mostly the hard way), and how he dealt with being wiped out multiple times.
I heard a sobering statistic a few months ago: the typical trader these days is out of the game within 3 years because he has no money left.
I have a paper back. It is a must read for every trader.
Thanks Fencepost
I have ordered a book that Lara recommended by Magee and Edwards I believe.
Going to only trade confirmation points from no on.
Appreciate thoughts – will get a copy ASAP.
I agree. This is the greatest trading book of all time. I try to read it again every few years.
There are probably a number of members on this site who should probably sit down and study that.
At this stage is Gold price likely to break below $1108-06 for $1096-95?…. Thanks. // At this stage a break below $1089-86 looks to be a long shot….
I recall from Frost & Prechter that a reversal after an ending diagonal can be violent.
Can you provide a page # for this please???? THX
Thanks fencepost:
I think if Gold price can manage to break below todays low $1093.40 that ought to see Gold price motor on down…. On the other hand, a break above $1122.25 opens up upside risk $1130….
10-th edition, hardcover, top of page 40
Please explain: On pg 37 under Ending diagonal first line: An ending diagonal occurs primarily in 5th wave posiotion at times……..
The current situation is not 5th wave but wave iv.
Does it apply here?
The ending diagonal is the structure of the 5th wave of the C wave, subminuette c to be exact.
Ending diagonals can unfold in C waves. C waves are like fifth waves.
This one was wave C of the second structure in a combination.
if Laras count is correct and iV is over the first wave down should unfold as a five wave structure?
but it looks more like a three?
Give it some more time to develop. No concern unless it makes a new high.
It looks like a 1-2 1-2 to me. The minuette and subminuette waves of Minute 5. We should have a strong third wave down soon, if the wave count is correct.
Possible to have a 1-2 1-2 1-2?
It could be developing. The more the merrier. It would mean a strong third down.
Hi Tham, I was wondering if you had a count for DUST. I’ve been hesitant to enter this market, but looking for possible entry point? Thanks as always
It appears traders must pay attention to short term up/down of gold using COT data.
Following is the latest COT
8/7 Commercial shorts 268826, Spec long: 181234
7/31 Commercial shorts 273993, Spec long: 180989
7/24 Commercial shorts 316862, Spec long: 183702
7/14 Commercial shorts 307511, Spec long: 189648
Commercial shorts keeps shrinking. From Jul 24 comm short has shrunk by -48036. That is bullish. AT highs comm shorts should be high and up.
By Friday we will know what comm shorts are today???? Delayed data.
I have the final fifth wave up now a completed zigzag (as per the updated hourly chart published earlier in comments below).
That should be it for upwards movement if my wave count is correct.
Confirmation point is still at 1,082.77. A new low below that point, with a red daily candlestick AND higher volume would confirm a downwards breakout.
That’s it from me tonight. I will be up before NY closes.
Good luck everybody!
Good morning/ Good Night Lara.
As I understand at 1119 gold just completed wave iv/ wave c.
Thank you I will short equal amount both NUGT/DUST today.
My no brainer investment strategy .
did wave 3 of c of y of iv end at 1119?
are we now in wave 4 of c of y of iv?
That looks very likely. And the Greece deal along with Chinese currency devaluation noted by Matt is bearish for gold. We may turn down as soon as a new high is made.
Lara wrote above :” I have the final fifth wave up now a completed zigzag ”
I presumed at 1119 at 3:50 AM EST.
Actually, we may have topped already. Since c is an ending diagonal, all we needed was a”3″ up to complete micro 5 of c of (y) of iv. We might go down from here.
What Papudi says below is correct. This final wave had to complete as a zigzag (3 wave structure), so there is no 4th wave in this instance. Lara explains this well in today’s comments.
The sudden knee jerk reaction in gold and other financial markets, which was just experienced, was due to the Chinese drastically lowering their currency relative to the USD.
There are only two possible structures for subminuette c; either an impulse or an ending diagonal.
The impulse has been invalidated, leaving the less common diagonal.
Ending diagonals require all sub waves to subdivide as zigzags and the fourth wave to overlap first wave price territory.
The final target is the same, the expectation that this correction is not over remains the same.
A new low below 1,082.77 could not be a second wave correction within subminuette wave c, and so at that stage subminuette wave c would have to be over. A downwards breakout would be highly likely below that price point.
If 1,082.77 is breached on a downwards day to produce a red candlestick and comes with increased volume then a downwards breakout would be confirmed by price AND volume AND a trend line breach on the TA chart.
The next wave down after this correction is over is still expected to be extended and very strong. Waiting for some confirmation of the breakout is a very good idea.
Lara, thanks for the timely update.
Was wondering if you allow for larger waves within this C up? For example, could what you have marked as the 3rd wave actually be the 1st? Not saying it is so – am just leaving the door open. Would this be an issue in terms of the scale of this C wave relative to A and B?
It could be only the first wave up if you see that move I’ve labelled micro wave 3 as a five.
It looks pretty strongly like a three.
That’s why I didn’t label it as a five.
But your idea is still somewhat valid; what if the first wave within subminuette c is incomplete? That’s why the price confirmation point is 1,082.77. No second wave correction can move below that point.
Thanks. I don’t want to speak too soon, but it looks like gold is making it’s way back up anyway.
Lara, thanks so much for the update!
Thanks for this excellent analysis Lara with very fast turnaround appreciated. Given the micro ED tendline is now overshot with a decent spike in volume, do you think we are now in minute 5 down?
Yes I do, but it comes with the caveat that this is unconfirmed. Only a new low below 1,082.77 along with a red daily candlestick AND an increase in volume for that day would confirm a downwards breakout.
One thing is sure gold just completed wave iv. This moce down felt like impulse to me.
Today’s wave count is invalidated at 9:47PM EST.
I hope by morning we may have a new wave count possibly.????
This is hard work for you Lara.
Thanks for your hard work. May be new wave count still have gold go higher from here????
You’re welcome, and thanks for your patience.
Corrections. They test our patience. They’re hard to analyse, hard to trade.
I stay clear of them and wait for the trend to re-emerge.
Any chance we could get an updated count Lara?
Back to expanded flat wave count of alternate from day before.
Gold is going down to 1071. LOL!!!!
lol…what a ride. I stopped out of my JDST today, giving back gains from last week, and was going to wait a day or two to get back in. So much for that!
I stayed in took the days hit. A strong support at the top of the gap below in DUST kept me in.
Lara, in hindsight, seems like the first sign that the wave degree was too low was when you started using pico, nano, etc. Since the inception of EWG, I believe that was the first time you used waves that low. What do you think?
Possibly.
Hindsight is a wonderful thing. I wish I had it in advance.
When I look at minute iii now on the daily chart it doesn’t look like a very good impulse. The fourth wave corrections in it are all so quick, way quicker than the second waves within it. This is common, but this particular example is pretty extreme even for Gold.
Within the subdivisions of minute wave iii there is an expanded flat correction with a B wave that is 4.5 times the length of the A wave. The C wave moves beyond the end of A so a truncation is avoided. I’ll accept it because the subdivisions fit, bit it’s highly unusual. It’s the only way (so far) that I’ve been able to see minute iii as complete. And it’s the biggest reason why I didn’t do so before.
So with that highly unusual structure in there I shied away from seeing minute iii as complete. The probability was too low. It had to show itself before I was willing to accept it.
I have to approach this as an exercise in probability: expect more normal typical structures, expect the highest probability outcome to occur and therefore we should be right more often than wrong.
At the same time consider all possibilities, no matter how unlikely, and rank them in order of probability based on how common the structures are and how well the form fits.
Low probability outcomes will never be the ones you expect to see, precisely because they are low probability. But that doesn’t mean they don’t happen.
So in conclusion I guess the mistake I made was to see this outcome as too low a probability to publish.
Lara don’t be too hard on yourself, not humanly possible to analyze every possibility at hourly level where possibilities are constantly changing. This forum has something of a day trader vibe, that’s not bad, I appreciate the expertise but it does sort of set an unrealistic standard that the perfect hourly analysis is available for a 10% daily DUST trade–unrealistic even if you were posting an updated chart of every possibility every hour of every trading day–because every trader would be forced to choose between multiple possibilities multiple times per day, injecting human error at every decision point.
Gold trading is like combat where the best plan only survives until first enemy contact.
I like hourly chart to help find an entry or exit point but daily chart is most important–better value for time spent analyzing different possibilities.
My opinion. Good fortune to all.
Yes, you’re right. The members who are commenting here are mostly day traders.
Some of them are very experienced professionals.
I’m really concerned though that a few aren’t and are getting burnt.
As I keep saying, trading the small waves within a correction is a nightmare, it’s really hard and best left to the professionals.
Waiting for a trend and staying with it is much easier to profit.
It’s the trades you DON’T take which make the difference between profit and loss. To reduce losses steer clear of corrections.
I don’t trade them. Ever. I wait for a trend to be clear before I jump in. And I’ll hold a position for weeks / months. I’ve got NZDUSD at the moment, and that’s enough for me.
The market always offers another opportunity.
Lara, IMO your warnings of dangers and trading loss have been prolific. People gonna be people. Even Master Yoda could not change human nature.
Traders who get burned did it to themselves. Everyone here has a different trading style and approach and will use your analysis differently. Ironically, some will lose money while others make a great deal on the same information. There is nothing you can do about that, so might as well just focus on your work. You do a terrific job.
Gold price bottomy, looking to rally and top….$1093-91 below $1098-97 holding….
Do not be too sure about gold. Do not make prediction about price.
Lara correctly says that wave iv can take 18 different structures so as wave b.
Thats why gold price remains a mystery.
Odds are gold will drop tomorrow and there will be a new wave count. I expect a reversal inverted hammer or a candle.
I have a different strategy for miners 3Xetf investment (not trading). This strategy makes profit over long term without regard to gold price up/down.
If you count all the different combinations possible the total is 23.