
Upwards movement to 1,118 – 1,123 was expected. This is what happened, but only after a whipsaw took out the invalidation points on the hourly chart necessitating an updated short term chart for the hourly structure.
I have two wave counts for you today to consider all possibilities.
Summary: This fourth wave correction is again most likely over, but would not be confirmed until there is a new low below 1,082.77. If this comes with a red daily candlestick and increased volume, then a downwards breakout would finally be confirmed. A new high above 1,119.56, at this stage, would be reasonably bullish; should that happen, then the target for upwards movement to end would be 1,135, but this has a lower probability.
To see weekly charts and analysis click here.
Changes to last analysis are bold.
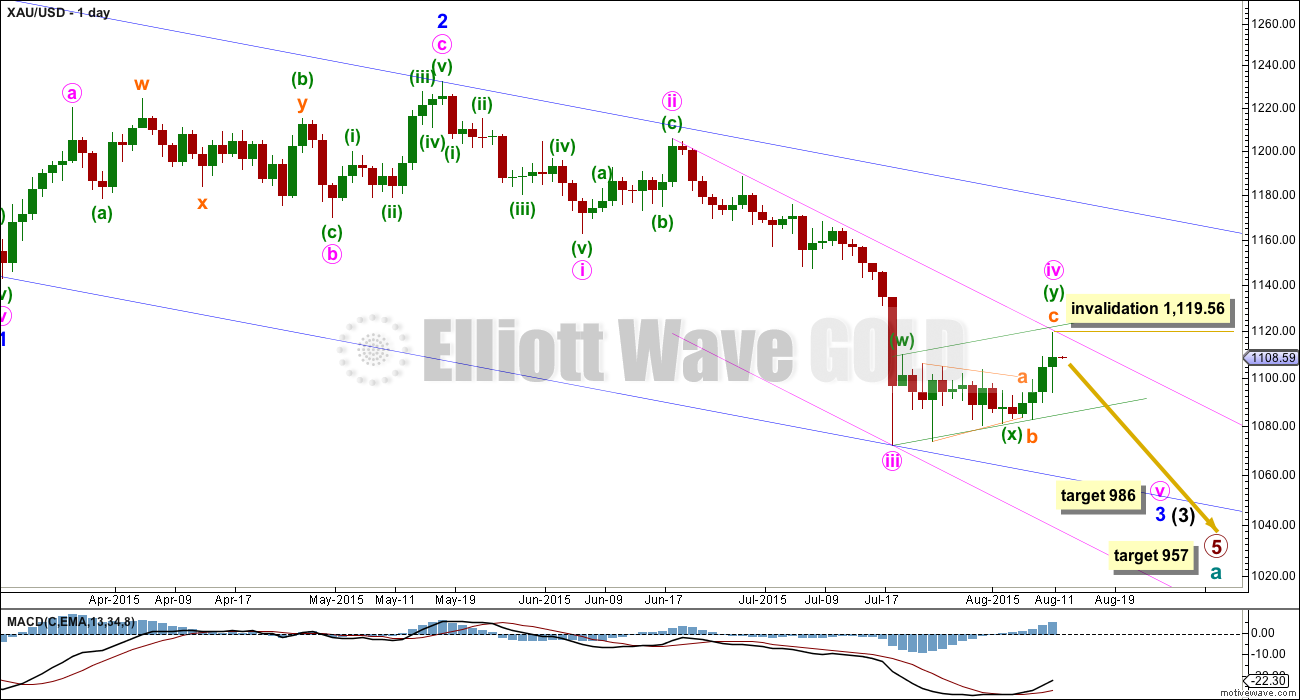
MAIN ELLIOTT WAVE COUNT
Click chart to enlarge.
Cycle wave a is an incomplete impulse.
Within primary wave 5, the daily chart focuses on the middle of intermediate wave (3). Within intermediate wave (3), minor wave 3 now shows a slight increase in momentum beyond that seen for the end of minor wave 1 at the left of the chart. Third waves for Gold usually have clearly stronger momentum than its first waves, so I still expect to see a further increase in downwards momentum. The strongest downwards movement is still ahead of us, and now it may be expected to show up within the next fifth wave down of minute wave v to end minor wave 3. Gold often exhibits very strong fifth waves, and when it does this they usually turn up to end its third wave impulses.
It is possible (just, with an unusual looking expanded flat within it for a second wave) to see minute wave iii as over. The duration of this current correction indicates that despite the problem within its subdivisions minute wave iii must have been over and this current correction is minute wave iv.
Minute wave ii was a deep 0.618 single zigzag lasting nine days. Minute wave iv is a shallow 0.359 double combination which provides perfect alternation.
Within minute wave v, no second wave correction may move beyond its start above 1,119.56.
Add a second channel to the daily chart. Draw a channel about minor wave 3 using Elliott’s second technique: draw the first trend line from the ends of minute waves ii to iv, then place a parallel copy on the end of minute wave iii. The upper edge of this channel now perfectly shows where corrections have been finding resistance, and so this channel finally looks right. Minute wave v may end about the lower edge of this channel.
The blue channel is a base channel drawn about minor waves 1 and 2: draw the first trend line from the start of minor wave 1 (off to the left of the chart at the high of 1,308) to the end of minor wave 2, then place a parallel copy on the end of minor wave 1. The lower trend line perfectly shows where minute wave iii found support. Minor wave 3 should have the power to break through support at the lower trend line; when its fifth wave arrives, then it should be strong enough to do that.
There is no Fibonacci ratio between minute waves i and iii, which makes it very likely that minute wave v will exhibit a Fibonacci ratio to either of minute waves i or iii. At 986 minute wave v would reach equality in length with minute wave iii. This target expects minute wave v will be very swift and strong (once it is underway, not necessarily right at the start) particularly toward the end of it. The strongest piece of downwards movement may be the fifth wave of the fifth wave: minuette wave (v) of minute wave v to end minor wave 3.
Along the way down to the final target for primary wave 5 at 954, there will be two more big fourth wave corrections: one for minor wave 4 and another for intermediate wave (4). They may be expected to be less time consuming than their counterpart second wave corrections; they may also be expected to be shallow, but they will both still likely be multi week corrections (at least two weeks in the case of minor wave 4 and longer for intermediate wave (4) ).
At 957 primary wave 5 would reach equality in length with primary wave 1.
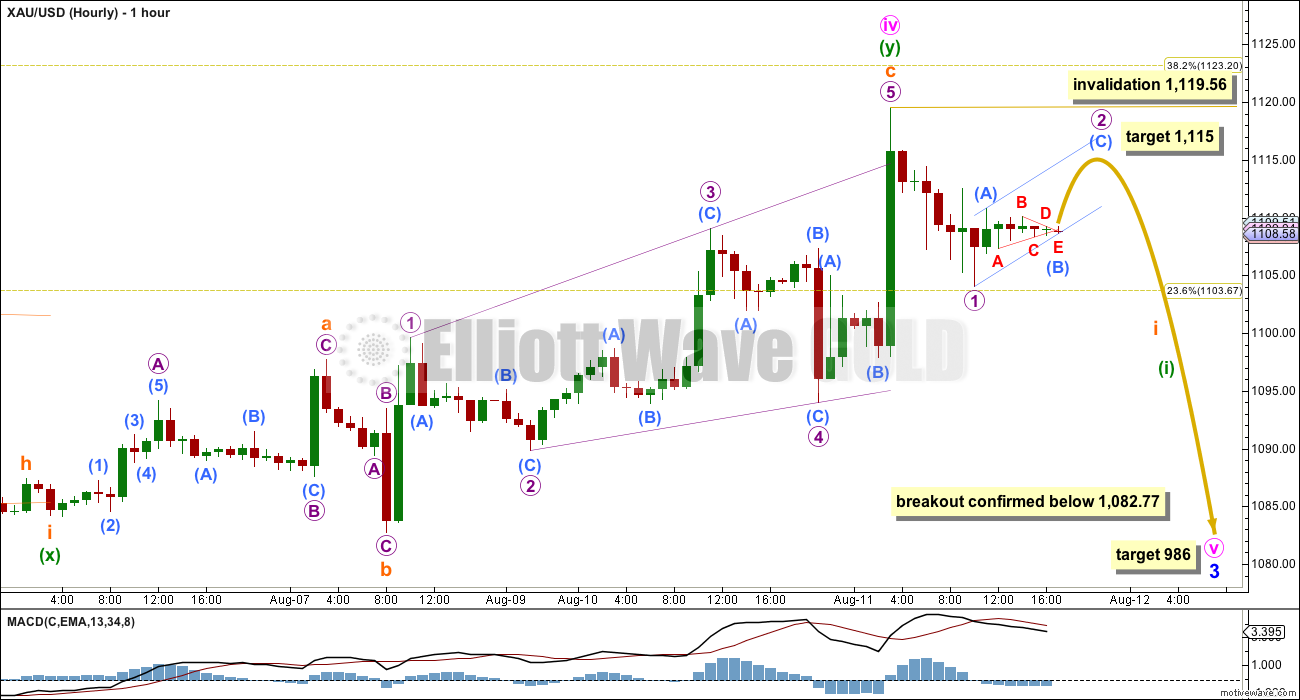
Click chart to enlarge.
Minute wave iv fits as a double combination, providing alternation with the zigzag of minute wave ii. The first structure in the double was a simple zigzag, the double is joined by a “three” in the opposite direction, a nine wave triangle, labelled minuette wave (x). The second structure in the double is now a completed expanded flat correction labelled minuette wave (y).
Double combinations are very common structures.
Within minuette wave (y), subminuette waves a and b both subdivide well as threes as they must for a flat. Subminuette wave b is a 111% correction of subminuette wave a, so this is an expanded flat (their B waves are a minimum 110% of the A wave). Subminuette wave c is 1.5 longer than 2.618 the length of subminuette wave a.
Subminuette wave c is an ending expanding diagonal. C waves may subdivide as either impulses or diagonals. Within an ending diagonal, all the sub waves must be zigzags and the fourth wave must overlap first wave price territory as this one does. The common depth for second and fourth waves within diagonals is between 0.66 to 0.81 the prior wave. Here micro wave 2 is 0.58 of micro wave 1 and micro wave 4 is 0.78 of micro wave 3. This diagonal looks reasonably typical and most importantly the subdivisions fit.
An expanding diagonal must have the third wave longer than the first, the fifth wave longer than the third, the fourth wave longer than the second, and the trend lines must diverge. These rules here are met.
The final fifth wave overshoots the 1-3 trend line, which makes it extremely likely that the structure is complete.
I have spent considerable time on the five and one minute charts today to determine the structure of the first wave down from the end of minute wave iv. It must subdivide as a five. It could be forced as a leading diagonal, but that doesn’t look right. I have concluded it is either a corrective structure hence the alternate wave count below, or it may also just fit as an impulse on the one minute chart.
It looks like a triangle is unfolding as this analysis is prepared; this may be a B wave within a second wave zigzag for micro wave 2.
Micro wave 2 may not move beyond the start of micro wave 1 above 1,119.56.
Draw a small channel about micro wave 2. It may end when price comes up to touch the upper edge of that channel. At 1,115 submicro wave (C) would reach equality in length with submicro wave (A).
A new low below 1,082.77 would finally confirm a downwards breakout is underway.
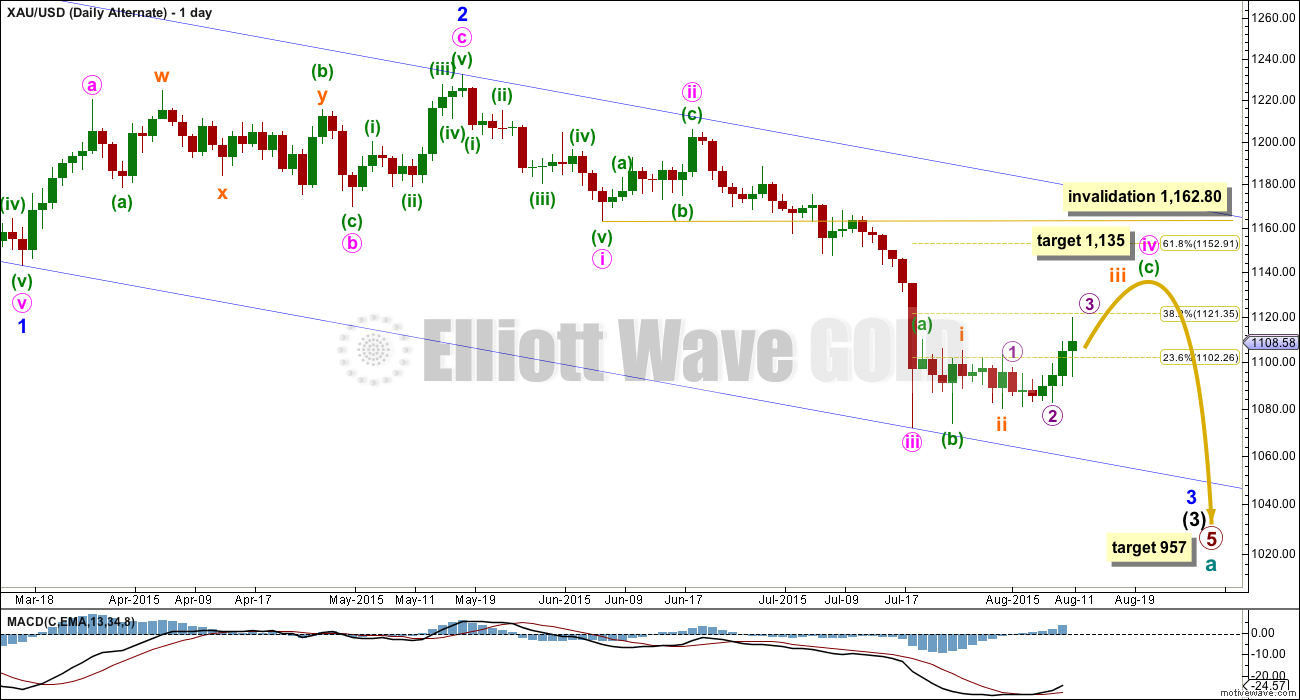
ALTERNATE ELLIOTT WAVE COUNT
Click chart to enlarge.
Because I am concerned with the volume profile – this rise in price for the last four days is supported by rising volume – I want to consider all possibilities.
This wave count is different from the main wave count only in the structure of minute wave iv. The trend remains down at minor, intermediate and primary degree and the final target remains the same.
What if minute wave iv is not over? What other structure could it be?
Minute wave iv does not fit as a zigzag because the first wave up labelled minuette wave (a) is a three, not a five. A zigzag would also not provide alternation with the zigzag of minute wave ii, so a zigzag is very unlikely.
It does fit as a flat correction, which subdivides 3-3-5, and minuette wave (b) is over the minimum of 90% the length of minuette wave (a) at 96%. Both minuette waves (a) and (b) subdivide easily as threes.
Minuette wave (c) may only subdivide as a five, either an ending diagonal or an impulse. So far it looks like it may be more likely to be an impulse.
At 1,135 minuette wave (c) would reach 1.618 the length of minuette wave (a). If minuette wave (c) upwards shows declining volume as it ends, then the problem I have today with rising volume for the first part of it would be resolved.
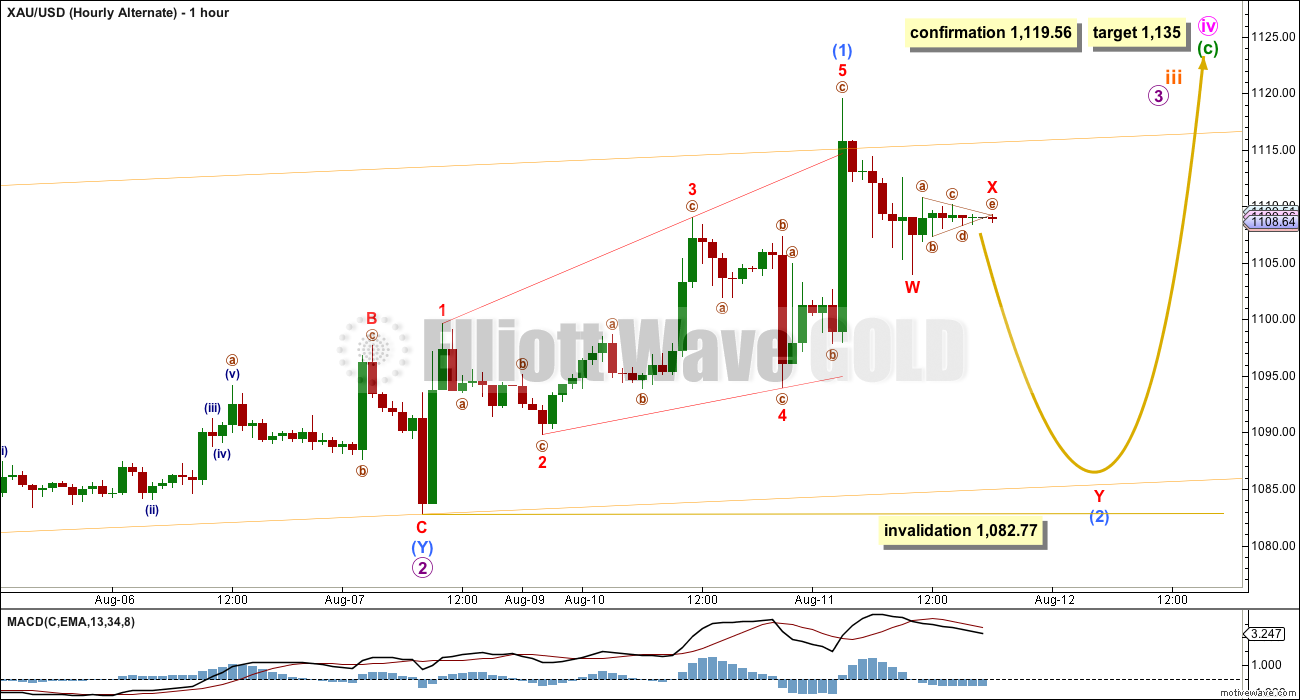
Click chart to enlarge.
At the daily chart level, this wave count does not look very good: minuette wave (c) is too slow and much longer in duration than minuette wave (a). At the hourly chart level, the wave count looks worse.
It is not possible to see micro wave 3 as complete; there is too much overlapping for an impulse to fit, and a third wave may only subdivide as an impulse.
There are now three overlapping first and second wave corrections (with submicro wave (2) still to complete lower) within the impulse of minuette wave (c).
Submicro wave (1) will only fit as a leading expanding diagonal. While this is not a rare structure, it is not very common either which reduces the probability of this wave count.
Submicro wave (2) should be a very deep correction because second waves following leading diagonals in first wave positions are usually very deep. It may not move beyond the start of submicro wave (1) below 1,082.77. It may be unfolding as a double zigzag, although minuscule wave W does not fit very well as a single zigzag (it fits better as a double, but it is invalid to label a multiple within a multiple).
Invalidation of this alternate wave count would provide confidence in the main wave count.
TECHNICAL ANALYSIS
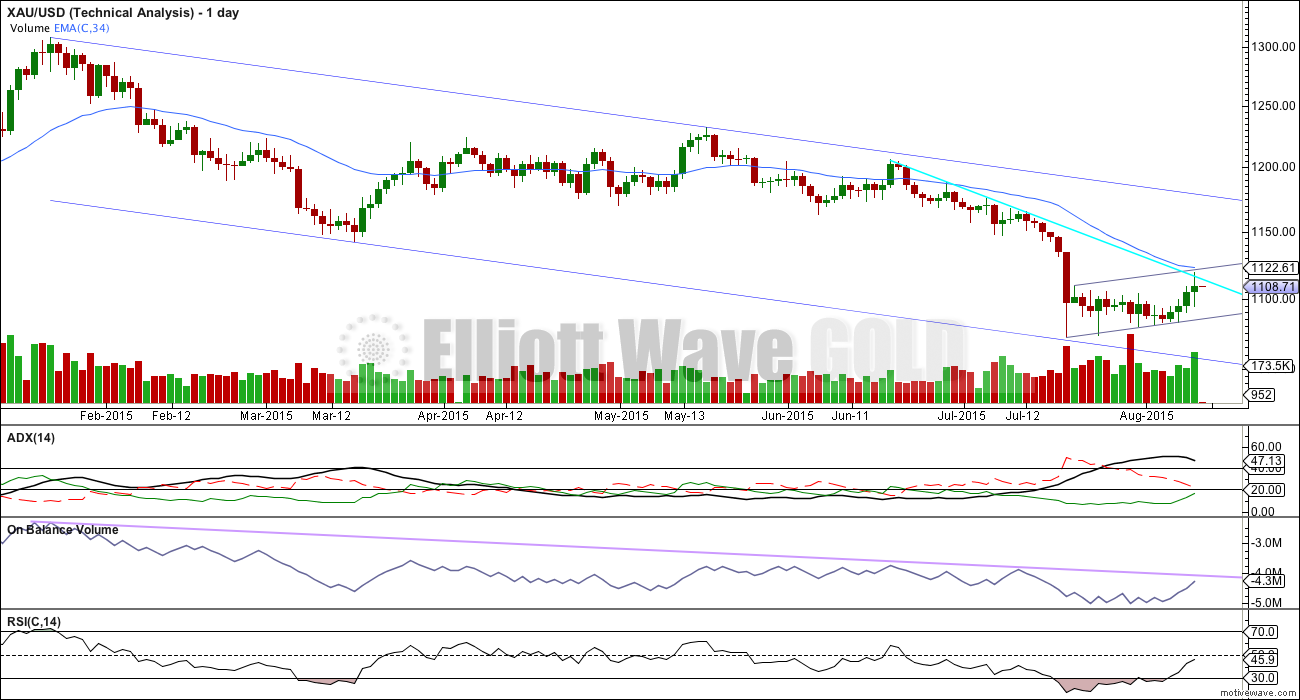
Click chart to enlarge.
ADX is above 45 and now clearly declining. This indicates the market is overextended, and a trend turning point should be expected. I expect that was the last low. ADX does tend to be a lagging indicator. Price or indicator patterns should be used.
This pattern no longer looks like a typical flag, and now entering the third week it is too long in duration. It looks overall like a correction against a downwards trend, but this is no longer as clear. So far it does fit within a parallel channel but the upper trend line has not been tested enough for a classic pattern of a channel or a flag to be indicated. If the upper trend line is breached, then an upwards breakout may be indicated.
The bright aqua blue trend line is added. This may be providing some resistance along with the upper edge of the small parallel channel.
On Balance Volume has come up to almost touch its long held lilac trend line. This line may allow for a very slight new high until it is more clearly touched, but it indicates an end to upwards movement may be about here. This trend line is longer held and more tested than the trend lines for price, so it is more technically significant.
RSI is well above oversold, back into normal range. There is plenty of room for the market to move either up or down.
Overall, price and OBV indicate resistance. During recent sideways movement, it is still a downwards day which shows clearly stronger volume. This overall indicates a downwards breakout is still more likely than upwards, but the rise in price for the last four days is making this message less clear. The parallel channel about this sideways / upwards drift should be used to indicate what direction price will break out before any confidence may be had in the next direction.
This analysis is published about 07:00 p.m. EST.
Looks like dust is starting a 5th wave down to min 20.50.
yeah yeah, probably wants to tag the 200 on the daily. I’m so bumbed out about getting caught up in the XAU EW fourth wave correction completion being right around the corner that I obliterated my own trading sense about the Dust daily chart. I entered way prematurely and I shouldn’t be trying to trade dust right now! Dang it. I knew that!
I must remember that I am the expert when it comes to my money.
I really really hope the gold metal wants to finish its fourth wave hoo ha soon. I hope that gold is not interested in some long drawn out up-to-the-top trend line touch where it would push Dust back to its bottom bottom (just revisiting Dust’s last trendline touch actions) Oh, well. More than you wanted to hear probably.
Held too mate – Also expecting imminent reversal and downside.
Will hold now indefinitely and wait for reversal.
Aware these have massive decay, but few options.
If you are holding you will very soon get your money back!
Not so sure about that. If gold does not pullback, another $6/day decline in Dust??? Look at your weekly chart all the way back to 2013. See any resemblences?
I think it depends on USD reversing. But anyway, I wouldn’t advise holding. I’m scaling out. I cut some losses today. Really don’t want to see a $6 drop tomorrow.
Hi Shahab
Very unlikely unless we complete this 4th Wave correction tonight and start the fifth wave tomorrow.
Believe Matt (below) is correct and we completed the 3rd wave at (b) on the alternate.
Tomorrow Dust will be green or I will visiting my DIY store.
Well crap. Has gold got any downward motion forthcoming in the immediate future?
hard to see it happening in the immediate future
Maybe yes. See Lara’s comment to John below.
Thank you I saw the GDX chart with possible correction coming.
The miners had a strong up day after a gap open. I think odds are that gap is a runaway gap which will give you a measured move price objective. Any one who buys DUST before GDX at least gets near to its PO has, IMO, excessive courage.
I don’t see how Gold and gdx can go up much more without wiping away all bear theories/waves.
Right now it looks like a very small fourth wave triangle is unfolding. Which indicates more upwards movement to come.
I’ve looked at various possible structures this morning. Every single one needs more upwards movement.
There is so much overlapping within this last two days upwards movement, a third wave has not yet ended.
The target will be about 1,131 – 1,135 for this to end. 1,131 may be more likely because that’s providing strong resistance; previously it was a strong support line.
There is slight decrease in volume for today, but it’s still relatively high.
This is still a fourth wave correction and the bigger trend is still down, the question is what structure is this fourth wave? When will it end?
I’m leaving comments now to continue working on trying to answer those two questions.
GDX volume…
Referencing last GDX report
“The gap looks like a breakaway or measuring gap and not a pattern gap, so it should not be expected to be filled.”
Unfortunately this has now been the case.
Does this open GDX up to further upside?
GDX has risen and may or may not have retested the 2008 bottom of 15.37…depending on your data feed….also GDX has closed the gap from Jul 17-20 at 15.37…….5min and 15min MACD of GC are rolling over ………entered first DUST position….
Lara it is a strong possibility that SPX will close below 2063 invalidating the other bull wave count.
Does 2044 to play any roll?
Amazing!!! SPX appeared to have close today below 2063???
What happen????
Still waiting for SPX to close below 2063. Bull wave is not invalidated yet???
Tham, your analysis of DUST several days ago semed unlikely but has proven correct. Congrats.
Thanks, Davey. Just a correct interpretation of EW.
Anyway, DUST did drop to a low that is lower than my count, at 23.28. I guess that should stop it.
This response is also for Alister & Joseph as we ran out of room for direct responses below.
Alister : There is yet a 4th wave and a 5th wave before it is really safe to buy in DUST.
Joseph : My target for the 4th wave bounce is 26.61 (most likely) with a further upside of 29.94 possible, and an outside chance of 31.57. But be careful, indicators give conflicting signals at the moment so it might be safer to stay on the sidelines; MACD is bearish, Stochastics is bullish, and RSI does not give a clear signal. Extrapolating, I expect the 5th wave to end at 22.01 / 19.35. That is when I am loading up. There is a very good chance that DUST will then rise to double that value, at 42.5 – 45.9 (depending on when the 5th wave ends).
Yes, Tham, I appreciate that. Not looking to get in just yet. Thanks as always for your thoughts on DUST.
Tham, would you please comment…..DUST at 42.5 – 45.9 (or thereabouts) equals what wave point on gold daily chart?
My best guess is end of Intermediate 3 in gold because beyond that there is another set of 4th and 5th waves at higher degree for DUST.
Tham, thanks.
Lara,
Is there anything technically wrong with this idea… My struggles within the subwaves are with 5’s that really look like 3’s…
The idea works with gdx however..
??
gdx update as a possibility…
same chart oops..
I think that idea works very well indeed. I will take a closer look at the subdivisions.
Nice. Thank you John.
It seems to jive with GDX but its the subdivisions… need your expertise..
thanks
My two cents: what is marked as the (b) wave on the daily alternate is what I have always seen as the low and I am not the only one to note this. The reason this is relevant here is because the .382 retracement would actually be about $5 higher than what Lara has, namely 1126.47 or thereabouts. In other words, it is not far away. Moreover, after observing EW patterns now for a few years, I am very inclined to believe that gold will adhere very well to this important marker. This is a classic 4th wave retracement level and is quite reliable. In this instance, I have even more confidence in the level because the 2nd wave counterpart to this 4th wave retraced almost exactly .618.
It should be noted that everyone and their mothers are expecting gold to retrace all the way to former support. Is it really going to be that obvious? Gold may fall slightly short of that goal.
It won’t be long until the market turns around, so get ready. It may catch the bulls off guard.
Interesting. Your post prompted two thoughts in my head.
1) you have alternation in retrace depth between waves 2 and 4. What about alternation in form? They both look like zigzags to me.
2) The miners just gapped up on substantial volume. If that is an exhaustion gap, it would be consistent with your idea of gold declining soon. If that is a runaway gap, I cannot see gold plunging until the miners have spent their upward force.
I am counting on Lara to answer your question on the form.
The dollar is getting hammered today, with no end in site. That’s ultimately giving gold its fuel.
Matt, I kind of agree with you: (1) I´m expecting the 38.2% fib retrace to stop this corrective rally, meaning ~ $1,130, (2) recall that $1,131 is November 2014 low, which acted as support before BUT now is resistance. That is, Gold’s previous low is $1,131 and 38.2% fib retrace is about that (3) many times that Gold was oversold at the RSI level, it’d rally to about 50-60 before putting in a local top; it happened many times before and it could be happening again today….
RSI should have increased substantially today. Not in front of a computer now, so I couldn’t check. My guess is that the upper Bollinger Band may be close by now as well.
RSI is now in the zone you mention.
It would be nice if that was the low, and although it would be slightly truncated that truncation would come after the end of a third wave which did move “too far too fast”.
The biggest problem is to see that wave down to the truncated low you have to subdivide it as a five and it just won’t do it.
I did consider that at the time it unfolded, it looked likely, but it just won’t work.
I do like the idea of an ending diagonal unfolding for the C wave though, and I’ll look into that now to see how it fits and if it works.
I see slightly lower volume for today, so this rise in price is no longer supported by volume indicating the upwards movement may be ending soon.
I would think that this is a diagonal of some sort, but it is too messy for me to identify. Can’t wait to hear where gold is in that pattern.
Tham: “Candlesticks analysis deems that an inverted hammer is a high probability reversal signal.”
You are good. Yes there is a high prob of reversal today.
Plus in Price volume analysts yesterdays high volume high must be tested by atleast a tick above with lower volume and then close down with red candle. If that happens that will a reversal Lara is looking for.
Lets hope gold has done going higher and has turn as of today.
Lara: ” The main wave count is invalidated. The alternate is the only valid wave count I have at this stage.”
So wave x is current high and now gold should move down in wave y to 1083 then go to target high 1135 is that correct?
I think it’s likely that submicro 2 is complete at ~ 1,101 and we go up from there to the target of ~ 1,135. I don’t think we go down to 1,083.
Looks like we are getting the backtest of the breakdown.
Nice chart. I am afraid a backtest of big BO?????
Again Stewart Thompson? the ultra bullish no-matter-what-for-gold? Not reliable !
IMHO: Although Gold price appears to be looking to top, it is bottomy at $1101-1099 with $1093-91 below there holding and unlikely to see a break below $1083…. Looking to close shorts and initiate longs…. //// Price sustaining above 20dma is bullish, I would imagine the next probable upside target to be 50dma….
Hi dsprospering, Davey.
This is a continuation from yesterday, and it shows my current thoughts on DUST.
I notice on the daily chart for DUST that yesterday’s session ended with an inverted hammer. Candlesticks analysis deems that an inverted hammer is a high probability reversal signal. That is a good indication that the drop in DUST is over. Gold price should rise a bit more after hours but I reckon that it should be done by market open. DUST only captures the day’s events, and the movement ought to translate to an opening gap when the market opens, bringing DUST closer to the lower 27s (my target was 27.30). In the event that the correction in gold is much higher than envisaged (invalidating the main count, stopping in the 1130s), then my next lower target for DUST is 24.03 @ 0.618 retrace.
If all proceeds smoothly and the correction is indeed over (at 27+), I would expect the next interruption to DUST’s rise will be at 42 / 43.50 / 45 (depending on the final current value at 27+). This is because in the short term Stochastics and MACD are bullish while RSI has yet to become oversold.
Since the main count for gold has been invalidated, and gold will be rising higher, that means my lower target of 24.03 (will change, depending on the last low at 27+) is in play.
DUST will rise first due to the inverted hammer as well as gold moving into micro 4 once micro 3 has completed. I will recompute this rise once the low at 27+ is known.
It looks like DUST is ignoring the inverted hammer and is hell-bent on dropping to my next target at 24.03.
i have this move from around 30 to now as a 3 rd wave, should get a bounce for a 4th and then a final 5th wave down to your target or lower.
I agree. Only thing I started off from 36.86 as the second. This is a deep third.
The continuation of this count ties in with gold’s alternate count, matching it turn for turn until gold’s bottom at 957. There is good inverse correlation.
looks like a never ending 3rd wave, lol!!!
We’ll be able to buy DUST at $-store prices soon!
What is your 4th wave estimate?
Lara, could you possibly please comment before the open as to which count you think gold is following?
Would the push to 1101 at 18:20 be miniscule Y of the alternate?
I think you are correct since we just made a new high. Going higher.
The main wave count is invalidated. The alternate is the only valid wave count I have at this stage.
I think that gold’s movement over the last few hours aligns most with the main wave count.
I think it is fair to say it is neither of the wave counts.
The vast majority of analysts have called for 1130 minimum.
The main wave count was invalidated.
Lara’s alternate calls for 1135, but may require some reworking.
Here is a super close look at GDX under a 5min microscope. The chart shows the last submin. “C” wave of a flat correction that should complete wave iv.
Here is a clean daily chart showing volume…
Chart broken down into two pictures
png #1
.png #2
I agree John with your analysis, I have dust in a 3rd of a 3rd of a 5th. Do you think we can finish wave iv tommorow? I am going to start scaling in during that final 5th of the fifth push.
Nice charts!
Looks like this aligns with golds move up. Good chart. Thanks for sharing.
COT Data: Last weeks COT data was flashing upward movement. Commercials got out of the shorts in hurry.
It will be interesting to see what is the COT data for today which will be published on Friday. I bet comm shorts will rise big.
It appears traders must pay attention to short term up/down of gold using COT data.
Following is the latest COT
8/7 Commercial shorts 268826, Spec long: 181234
7/31 Commercial shorts 273993, Spec long: 180989
7/24 Commercial shorts 316862, Spec long: 183702
7/14 Commercial shorts 307511, Spec long: 189648
Commercial shorts keeps shrinking. From Jul 24 comm short has shrunk by -48036. That is/was bullish. AT gold’s highs comm shorts should be very high and up from previous week.
By Friday we will know what comm shorts are for today???? Delayed data.
You have posted this several times and I have been meaning to comment on it. Your thoughts are generally correct, but you should also note that buying has dried up as well. In other words, the participation in the gold market at this time is very low. That might explain why we have seen long periods of hardly any movement, or alternately aggressive, sudden jerks. The gold market is just thin – it is near the end of 4 year bear market and it is also vacation time for those of us in the Northern Hemisphere.
All of that said, the indications are there for a short term bottom. Nonetheless, I would warn you that it is better used as a longer term indicator. That is, weeks can go by before that what is expected actually materializes.
Every Saturday I read Jack Chan’s brief COT weekly summary on gold-eagle (which by the way has a lot of silly articles on it, but this one is legitimate). It tells me everything that I need to know.
Lara,
Assuming gold does not drop much further, could this last bit of downward movement fit as a flat correction? That is, could it be a part of the B wave per the main hourly count? Thanks.
The market may have answered my question already with a resounding ‘yes!’
Good Day Lara,
thank you very much for your always excellent work.
Could you please update Oil, I am wondering if the correction is over?
Regards
Ursula
I’ll get to that in the next few days.
For now for Oil price is contained within that channel. The target may not be low enough for intermediate (1); it’s been reached but price keeps going down.
The trend for Oil is down, has been for weeks, it’s trending not correcting. And it’s not done yet.
Thanks Lara!!!
Price has moved below the micro wave 1. Does this mean that micro wave 2 is over and gold is in microwave 3 down ????
No. That was invalidated.
This fourth wave is not over.
Technical analysis is key here, I think. Volume should be our main indicator given trendlines and On Balance performance. It´s clearly an upward correction against the main trend, so it´s a matter of a few more hours/days to start the fifth wave.
I do think you’re right. TA is going to be really useful here to figure out what EW count is correct.
On Balance Volume is pretty reliable. I’d expect that trend line to hold.
What do you make of the rise in volume for the last four upwards days? I’m unsure how much weight I should give it seeing as there is a prior downwards day which is still clearly stronger.
It’s a confusing message.
Lara,
Gold’s previous low and support was $1,131 marked in November 2014. That is now resistance. In addition, Gold has surpassed now the 23.6% fib retrace and the next fib retrace upwards is 38.2% at ~ $1,130+/-. That coincidence is a good clue to consider about where gold might stop this corrective rally.
Furthermore, in the recent past many times that (i) the RSI was oversold and (ii) gold put a local bottom (which is i think ~$1,072), then (iii) the RSI rise to about 50-60 along with gold to a local top. They’re a few dollars away from that.
Finally, Gold’s 50-day MA is about $1,145 and declining. Will the 50-day MA stop gold’s rally? In sum: $1,131 resistance, ~$1,130 is 38.2% fib retrace, 50-day MA is declining and now is ~$1,140…
Thank you.
Yes, that makes sense. It fits reasonably well with a target about 1,135, which is probably a bit too high.
Except I can’t see the 0.382 Fib ratio at 1,130. Even if I draw the retracement from the start of minute iii to the low as a truncated fifth at 1,073 the 0.382 retracement comes out at 1,124, not 1,130.