
The main wave count was invalidated with a new high above 1,119.56.
The alternate was confirmed, which expected more upwards movement.
Summary: The structure is still incomplete. The structure is still seen as a fourth wave correction, and expected to end about 1,131 or 1,142. These price points previously provided support; now they may provide resistance. A new low below 1,105.18, at this stage, would be strong indication that the correction is over, that price is breaking out downwards. A breakout would only be confirmed with a red daily candlestick coming on increased volume. Until that is seen, we must accept more upwards movement is likely, and so the correction is not over.
To see weekly charts and analysis click here.
Changes to last analysis are bold.
ELLIOTT WAVE COUNT
Click chart to enlarge.
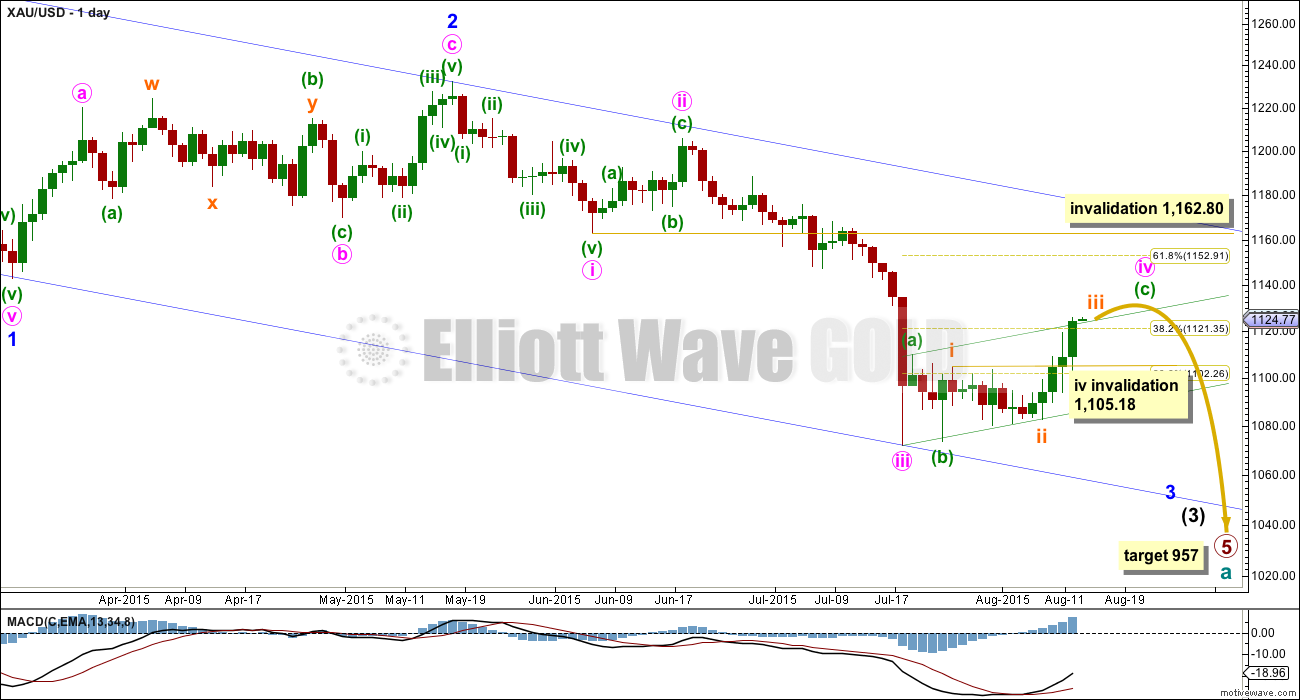
Cycle wave a is an incomplete impulse.
Within primary wave 5, the daily chart focuses on the middle of intermediate wave (3). Within intermediate wave (3), minor wave 3 now shows a slight increase in momentum beyond that seen for the end of minor wave 1 at the left of the chart. Third waves for Gold usually have clearly stronger momentum than its first waves, so I still expect to see a further increase in downwards momentum. The strongest downwards movement is still ahead of us, and now it may be expected to show up within the next fifth wave down of minute wave v to end minor wave 3. Gold often exhibits very strong fifth waves, and when it does this they usually turn up to end its third wave impulses.
It is possible (just, with an unusual looking expanded flat within it for a second wave) to see minute wave iii as over. The duration of this current correction indicates that despite the problem within its subdivisions minute wave iii must have been over and this current correction is minute wave iv.
Minute wave ii was a deep 0.618 single zigzag lasting nine days. Minute wave iv is a more shallow flat correction, which is still incomplete. Within minute wave iv, minuette wave (c) is a five wave impulse, and its fourth wave yet to show up may not move into its first wave price territory below 1,105.18.
Minute wave iv may not move into minute wave i price territory above 1,162.80.
The blue channel is a base channel drawn about minor waves 1 and 2: draw the first trend line from the start of minor wave 1 (off to the left of the chart at the high of 1,308) to the end of minor wave 2, then place a parallel copy on the end of minor wave 1. The lower trend line perfectly shows where minute wave iii found support. Minor wave 3 should have the power to break through support at the lower trend line; when its fifth wave arrives, then it should be strong enough to do that.
There is no Fibonacci ratio between minute waves i and iii, which makes it very likely that minute wave v will exhibit a Fibonacci ratio to either of minute waves i or iii. When minute wave iv is confirmed as complete, then a target for minute wave v down may be calculated. It is likely to be extended and very strong.
Along the way down to the final target for primary wave 5 at 954, there will be two more big fourth wave corrections: one for minor wave 4 and another for intermediate wave (4). They may be expected to be less time consuming than their counterpart second wave corrections; they may also be expected to be shallow, but they will both still likely be multi week corrections (at least two weeks in the case of minor wave 4 and longer for intermediate wave (4) ).
At 957 primary wave 5 would reach equality in length with primary wave 1.
Click chart to enlarge.
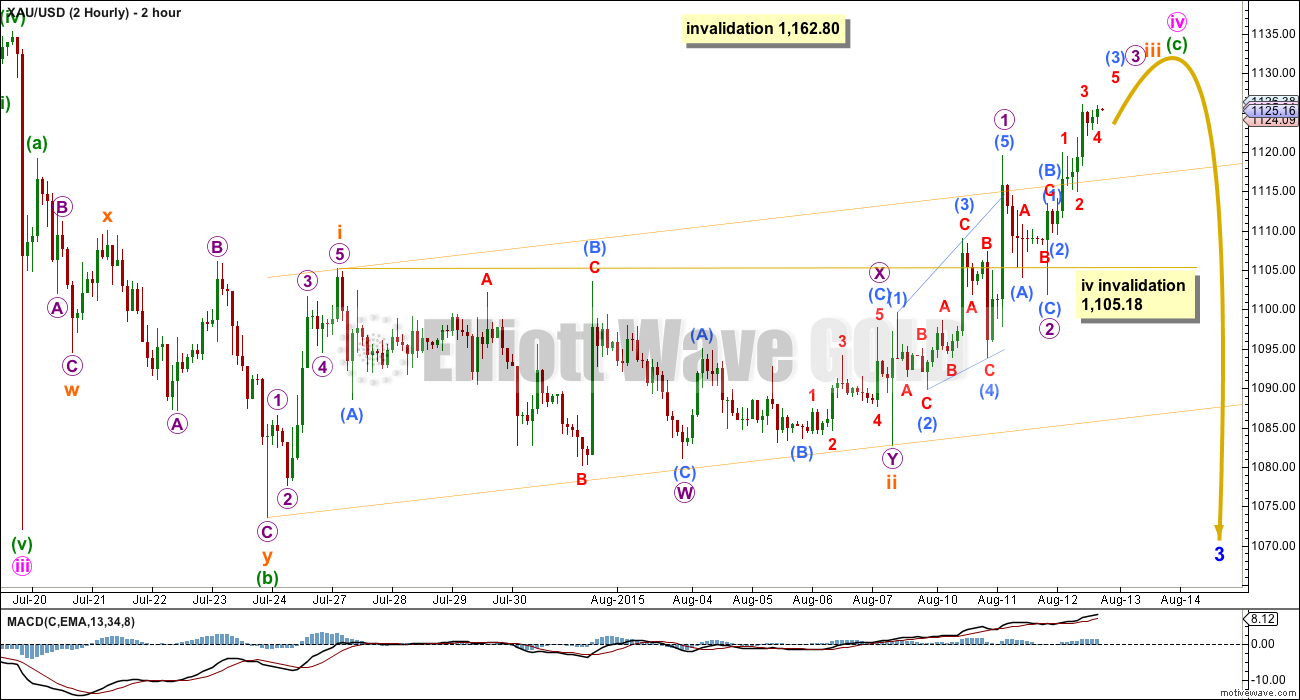
This two hourly chart shows the whole structure of this fourth wave correction.
I have considered various possible structures for minute wave iv and eliminated all except for a flat correction.
Minute wave iv is very unlikely to be a single or multiple zigzag, because that would not provide structural alternation with minute wave ii which was a single deep 0.618 zigzag.
Minute wave iv is clearly not a triangle; that idea was invalidated days ago.
Minute wave iv is no longer likely to be a combination, because the second structure in the double now ends well above the end of what would be the first. Double combinations move price sideways, but this correction has a clear slope against the prior trend.
That leaves the only possibility of a flat correction. Within this flat correction, minuette waves (a) and (b) both subdivide well as three wave corrections on the hourly chart. The only low for minuette wave (b) is as labelled because only there is it more than 90% of minuette wave (a).
I have also considered the possibility that minute wave iii ended with a truncated fifth wave at the low labelled minuette wave (b). That idea is invalid, because the final fifth wave for the truncation absolutely will not subdivide as a five. The final fifth wave fits neither as an ending diagonal nor as an impulse, although it does have a cursory look as a five; the problem there is that what would be the third wave would be the shortest, violating a core Elliott wave rule.
Minuette wave (c) would reach 1.618 the length of minuette wave (a) at 1,150. If this target is reached, then price first has to break through strong resistance at 1,131. This would see little alternation in depth between minute waves ii and iv. Minute wave ii was 0.618 of minute wave i, and at 1,150 minute wave iv would be 0.58 of minute wave iii. This target is entirely possible, and it must be accepted today that it is possible, but it is unlikely due to the guideline of alternation.
When subminuette wave iv arrives, then it may be quick and shallow. It may not move into subminuette wave i price territory below 1,105.18.
Click chart to enlarge.
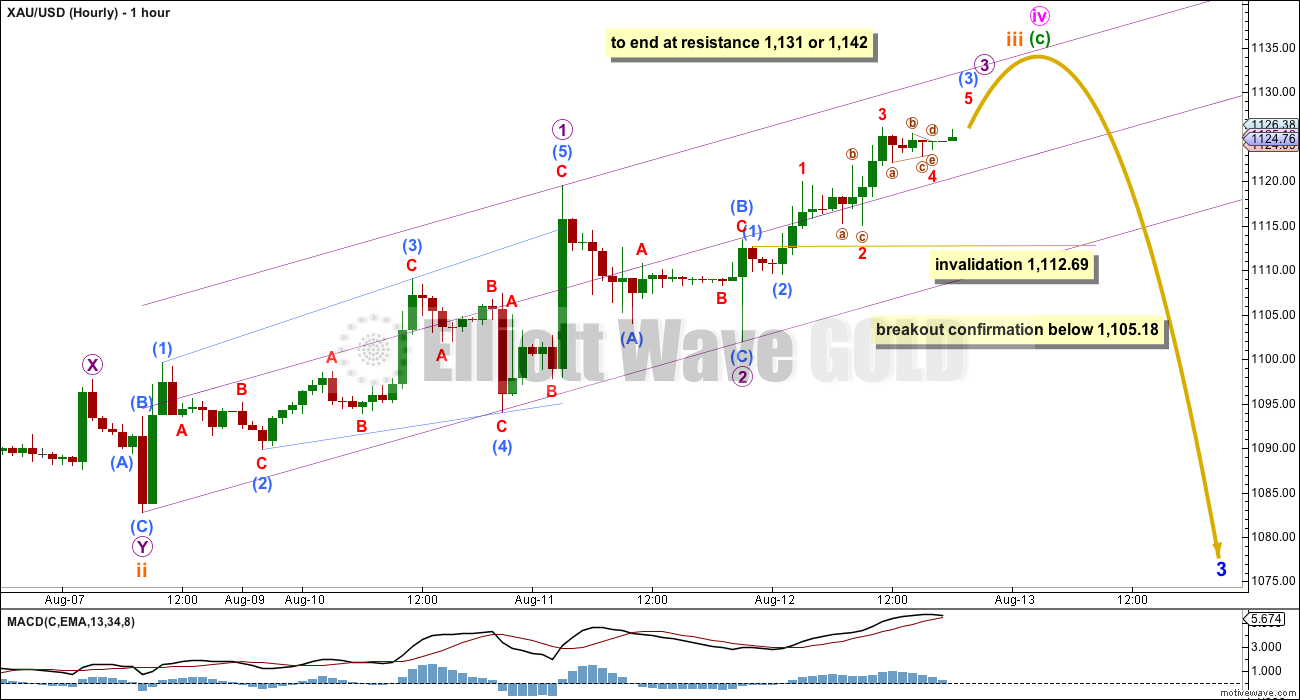
The upwards movement for Wednesday will not subdivide as a complete five wave impulse. To try and see a complete five wave impulse would have the third wave as the shortest, violating a core Elliott wave rule. Sideways movement to end Wednesday’s session fits as a small triangle indicating a fourth wave and more upwards movement. Because the middle of the third wave within the impulse of minuette wave (c) is still incomplete, more upwards movement should be expected.
Draw a best fit channel about subminuette wave iii. Along the way up, corrections should find support at the lower edge or possibly about a mid line. Submicro wave (4) should be the next correction to unfold, and may not move into submicro wave (1) price territory below 1,112.69.
Eventually a new low below 1,105.18 would be early price indication of a breakout. At that stage, downwards movement may not be subminuette wave iv, so subminuette wave iv and minuette wave (c) in its entirety would then be likely to be over.
The next thing to look for is confirmation of a downwards breakout with a red daily candlestick on increased volume.
This fourth wave is close to maturity, but the structure is still incomplete.
TECHNICAL ANALYSIS
Click chart to enlarge.
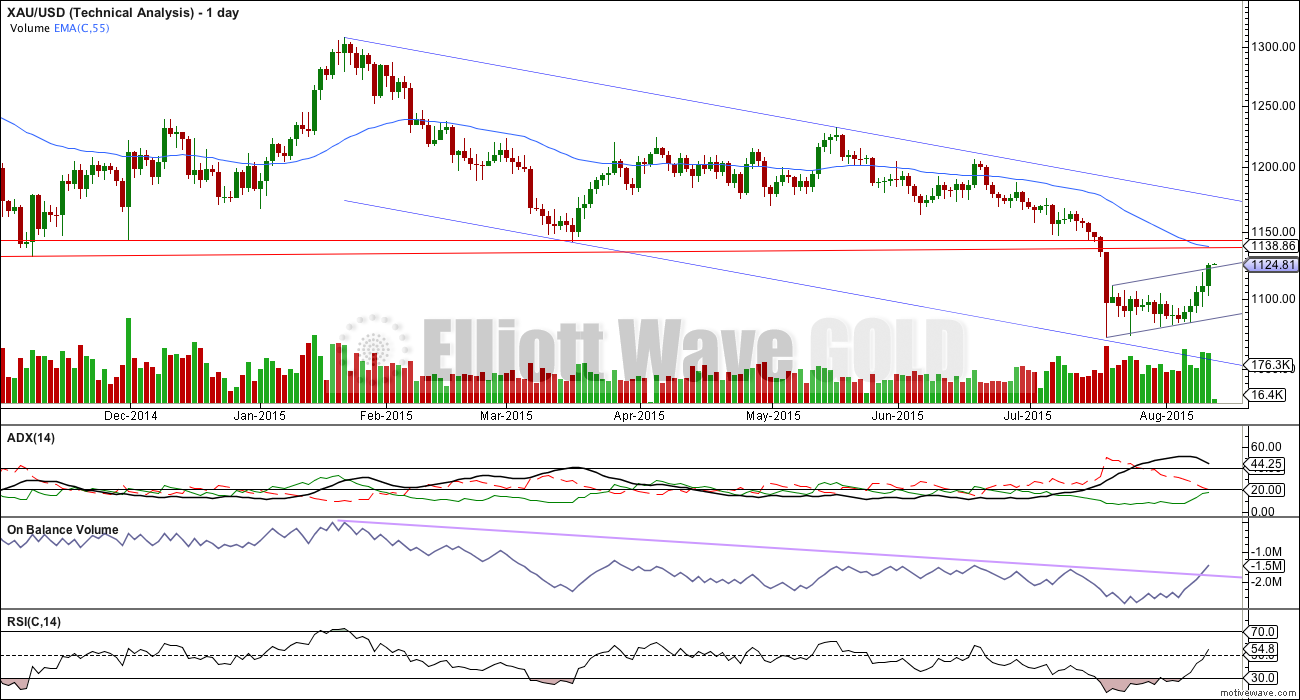
ADX is below 45 and clearly declining. A correction is likely. This is what has been unfolding now for over two weeks; ADX does tend to be a lagging indicator. However, at this stage, what ADX clearly shows today is that this upwards movement is not a new trend.
On Balance Volume has breached its long held lilac trend line, a very bullish indicator which is at odds with ADX. This now gives a mixed message about where price may be expected to go next.
I have added two horizontal trend lines of resistance, which were previously support. The first is at 1,131 from that low on 7th November 2014. The second is at 1,142 from the lows at 1st December 2014 and 17th March 2015. If price breaks above 1,131, then the next line at 1,142 may show where upwards movement ends. 1,142 was tested four times, so it is highly technically significant.
RSI has returned well into normal range. There is plenty of room for the market to rise or fall.
The EMA is changed to a Fibonacci 55 days. This may also provide some resistance.
Note: It is extremely disappointing to see volume data has again changed. Up to 6th August, volume during this correction was strongest for the down day of 23rd July. On 7th August, volume data for that day changed: volume was strongest for the downwards day of 30th July. Now data has changed a third time: a downwards day is no longer showing strongest volume. This makes volume analysis, which is vital to technical analysis, impossible to do with any reliability. I do not trust this volume data anymore, so today I’ll be looking for another data feed.
This analysis is published about 07:34 p.m. EST.
Matt, a very thought-out look at gold, EW plus mindset of bulls and bears etc, thanks for that. Possibly you have current thoughts on GDX?
I don’t trade GDX, so I can’t comment on that. Sorry. I like to keep it clean and simple with gold futures.
As Matt below points out (just in case anyone misses his excellent comment) this is most likely subminuette wave iv.
It may drift sideways for a few days to be better in proportion to subminuette wave ii.
Although, subminuette ii was a combination, this fourth wave may be a zigzag and so may be quicker.
A final fifth wave up is still required to end the five wave impulse for minuette (c). If that all plays out then (c) will have a clear five wave look to it on the daily chart and the bigger correction of minute iv will finally be over.
The invalidation point is now at 1,105.18.
Overall the bigger trend remains down, this is still a correction against the trend. It’s taking longer and moving higher than I had originally anticipated, and it’s not done quite yet.
If minute iv continues for three more days it would end in a Fibonacci 21. Give or take one either side of that number and we can say it is close enough to a Fibonacci number.
Once subminuette iv is finally over then I’ll add a target for the whole thing to end. For now look for resistance at 1,131 and 1,142.
The risk is price can move all the way up to 1,162.80, that’s how far up minute iv has to play with.
Lara; Is today’s red candle an inverted hammer a reversal you were looking for?
It should be lighter volume than previous day high volume day. High volume drop may come in in next few days.
No. I think Matt below is correct.
This is subminuette wave iv which can’t go into subminuette i below 1,105.18.
When the breakout comes it should be a red daily candlestick on higher volume. Today’s volume is too low.
Although you’re quite right, sometimes the sharp volume increase doesn’t come on the first day. Which means we shall have to wait until it does.
IMO, things look a lot clearer today. I believe that within minuette wave (c), 3 of 5 waves are complete. The 4th is now underway and must remain above 1105.18.
My best guess is that gold will bob around between the low 1120s and 1110ish (or lower – just has to stay above 1105.18) into next week. This wave can be brief, but has to go on for at least a little longer to be even close in duration to its 2nd wave counterpart. Once complete, the final 5th wave to complete minuette (c) and minute wave iv, might now be some kind of blow off top.
I wasn’t inclined to think about a blow off top yesterday, but have changed my thoughts since the .382 hurdle was cleared.
Looking back at other C waves, they often end with long wicks. That would make perfect sense here because the 1130-1140 zone is so important for both bulls and bears. Bulls will get their hopes up that a final low is in once gold crosses that 1130 threshold, while bears will be panic covering their positions. This will, in turn, give gold that last thrust up.
However…..then the smart EW traders like us come in to take advantage of the lofty prices to once again bring prices down.
A possible timeframe for the 5th wave to unfold may be this time next week. Weds the minutes of the last FOMC meeting will be released, which usually shakes things up.
I think you may be absolutely correct.
Thanks. Your analysis yesterday added much clarity.
Tham (aka Dust Divinator) is this the Dust 4th wave you expected?
Yes. My current target for it to end is 26.60, or 26.97 when calculated one degree higher.
This makes sense as gold price is still floundering, and cannot seem to rise, probably either having completed a fourth wave at 1113.72 (submicro 4 according to Lara’s count) or is starting on the fifth.
Tham, thank you.
Please find attached.
Isn’t this exactly what has played out?
Just Wondering: Gold price in limbo staying with its pivot: Really need to see a break below 1115 to test 1108-07 with a break below here to likely target 1195-93, or a break above 1118-1119 and then 1124 to go higher…. I guess one just has to be patient…. Gold price is looking to top….
Fundamental – Dollar Weakness Gold Strength caused by China selling $?
Traders said the central bank appeared to have been caught off guard by the intensity of selling that was sparked off by its surprise move on Tuesday, and believe it ordered big state banks to support the currency late on Wednesday, which influenced the PBOC’s official guidance rate for the following day.
State banks were also believed to be buying yuan and selling dollars on Thursday.
Anyone looking into whether it is possible that primary wave 5, and thus cycle wave a, was over at the end of 2014, and this is cycle wave b unfolding as an expanded flat? This would be a variation of the bull weekly and monthly wave counts in the historical charts. If so, this might mean the low is in and gold is going well over 1300.
Trying to make sense of the COT reports and dangerous USD chart.
EWI have a similar view. They don’t necessarily see the low is in. However, they expect gold to at least move above the high of 2015 at 1307.
That scenario has been considered by Lara and eliminated as she only sees the move up from the YE 2014 low into early 2015 as a “5”. She therefore does not see the expanded flat as a valid count.
If you accept the huge triangle for primary wave 4 then no, primary wave 5 simply cannot be over. The following downwards movement will fit neither as an ending diagonal nor as an impulse.
Therefore it must be incomplete.
I would be very curious to see what the Gold wave count for EWI is actually. I’d be interested to see how they resolved that one.
Lara,
If you’re interested I can email you the chart they published on Aug. 3rd, which is almost the same as their most recent one. Though, I’ll have to wait until Aug. 25th to avoid violating their copyrights.
That would be great thanks, and no worries on the waiting until 25th.
Hi Lara,
A couple quick comments/questions.
1) Do you think you will have a GDX chart updated tonight? I think you commented that you thought John’s looked pretty good, but I am still looking for your update.
2) How long do you estimate circle iv to last? Sometimes you give an estimate based on fibs or have a recommendation of 24-48 hours, I’d like to get a sense of your perspective as I look to start positioning for the drop.
3) Do you have a sense of how long until the 957 target? I think you have communicated fib weeks in the past, wondering where we are at if you can.
Thanks.
Here is a daily chart for GDX.
I’ll not have the time today to do a more thorough analysis of it, and you’ll note it only includes data uploaded yesterday. I haven’t updated the data today (I import it manually into Motive Wave).
It’s been a horrible day and I cannot manage any more analysis today.
Thank you!
2. if this current minute iv ends in 3 more days it would total a Fibonacci 21. so that seems a reasonable expectation at this stage. however, as you all know I had expected this correction to end before this, it really is taking it’s time.
3. so far primary 5 is in it’s 57th week, so it has passed a Fibonacci 55. The next number in the sequence is 89, which would see it continue for a further 32 weeks (excluding this one)
Thanks!!
Lara- Nice report. Back testing multi year support at 1131 was suspected by many chartists including me.
However if tonight gold crosses below 1112.89 and invalidates this wave count will that abort the backtesting????
Hopefully gold will go up to 1131 tonight and by US market opens to morrow it will be in the V wave down– Hoping.!!!!!!!!
If it moves below 1,112.69 in the next 24 hours then I’d rather expect my hourly chart analysis is wrong than the whole thing is over.
Only a new low below 1,105.18 AND a red daily candlestick AND increased volume for that day would give me confidence that this correction is finally over.
Nice Lara. Like it. So it seems we are heading up to a cluster of a resistance area: (1) $1,131 as previous support, (2) $1,135-38 as the 38.2% fib retrace of the entire MIC third wave, (3) $1,142 another previous support and ~ 50% fib retrace from the entire MIN third wave (as MIN second wave had 62% fib retrace it wouldn’t make sense to expect a greater retrace).
Algo, I like the idea from a technical standpoint that this mighty be a throwback to the previous strong support of $1,131, as it happens many times in charting analysis.
As you mention, somewhere between $1,130-$1,140 looks like this MIN fourth wave may end.
Yes, at this stage it does look to be pretty typical.
The EW structure on the hourly chart is a nightmare at this time. Usually when it’s like that it’s because the structure is incomplete. And when it’s incomplete and you’re trying to see it as complete… it won’t fit. Obviously.
It was find up until a new high above the expanding diagonal (micro 1). Then the subsequent overlapping was a real problem.
So it needs to keep going up to resolve that problem. At least, at this stage that is my conclusion.